Square
Following
Hot
News
Notifications
Profile
Share your thoughts
placeholder
Article
$INIT is showing signs of a strong rebound! After consolidating near $0.12 for a long time, buyers are entering with fresh momentum. The latest 4-hour candle is pushing toward resistance at $0.142. Add INIT to your watchlist. A confirmed breakout could kick off a new rally. Buy and trade $TRUMP
$SNDK
post-image
INIT-2.53%
TRUMP-0.95%
SNDK-0.18%
$RUNE Short setup update:

On the 4-hour chart, price is capped below the EMA50, and the current structure is weak. The 0.5931–0.5947 area is the shorting zone I’m watching, but I won’t chase price blindly. I’ll wait for it to return to this range before considering an entry.
🔴 Short entry zone: 0.5931–0.5947Target levels: 0.5881 / 0.5843 / 0.5785Stop level: 0.6035
Rationale: 0.594 is below the 4-hour EMA50 (0.599), and the moving averages point downward. The 1-hour RSI is 61, so momentum is not extreme, meaning there may still be room to move lower. The funding rate is -0.006%, indicating su
post-image
RUNE-0.14%
Trenches
牛逼
牛
bade
b
牛逼
0x96...7777
Market Cap
$.
Change
.
24h Vol
$.
Holders
.
STONK
S
bade
b
STONK
6GmA...UNgx
Market Cap
$.
Change
.
24h Vol
$.
Holders
.
BTC
B
bade
b
BTC
C5xp...pump
Market Cap
$.
Change
.
24h Vol
$.
Holders
.
PUSSY
P
bade
b
PUSSY
FZxH...Loat
Market Cap
$.
Change
.
24h Vol
$.
Holders
.
PIEVERSE
P
bade
b
PIEVERSE
0x0e...25a9
Market Cap
$.
Change
.
24h Vol
$.
Holders
.
A friend who had held NVIDIA $NVDA for three years saw Huang send an all-hands letter admitting to an affair and was so frightened he placed sell orders overnight, ready to liquidate his entire position.
With a position worth millions, he ignored NVIDIA’s monopoly over global computing power and instead fell for a sex scandal script cooked up by Washington politicians.
At two in the morning, he was still frantically sending me voice messages: “It’s over, it’s over. Huang’s reputation is ruined—he got involved with a female spy and is under congressional investigation. The stock has already lo
NVDA-5.31%
The most critical point in today's market
$AMD 's positive contribution to Q basically offset Nvidia's drag. Estimated at the same time:
AMD: contributed about +0.42 percentage points to Q.
$NVDA : down about 5.33% at the time, dragging Q down by about −0.41 percentage points.
AMD is currently above today's extreme position-reduction level, with calls above it seeing substantial position reductions.
$AVGO is also nearing the GEX Wall at 320.
For Q, here comes the key point: whether AMD can hold above a market price of 500.
For bulls, today's target price has been more than met. Whether bulls
post-image
AMD+13.66%
NVDA-5.31%
AVGO+9.29%
The funding rate has been positive for three straight days, which means longs in perpetual futures are paying shorts. I know this setup all too well—from when I was selling options for premium last year. Back then, I liked this kind of structure: selling options meant earning time value and volatility premium, and the more crowded the market and the more bullish the sentiment, the fatter the premiums. A funding rate that stays positive is essentially the same kind of signal: long positions in the futures market are too crowded, pushing up the cost of holding them. Under the usual mechanics of
post-image
US500+2.50%
NAS100+3.50%
NVDA-5.31%
GOOGL+1.76%
MCD+2.18%
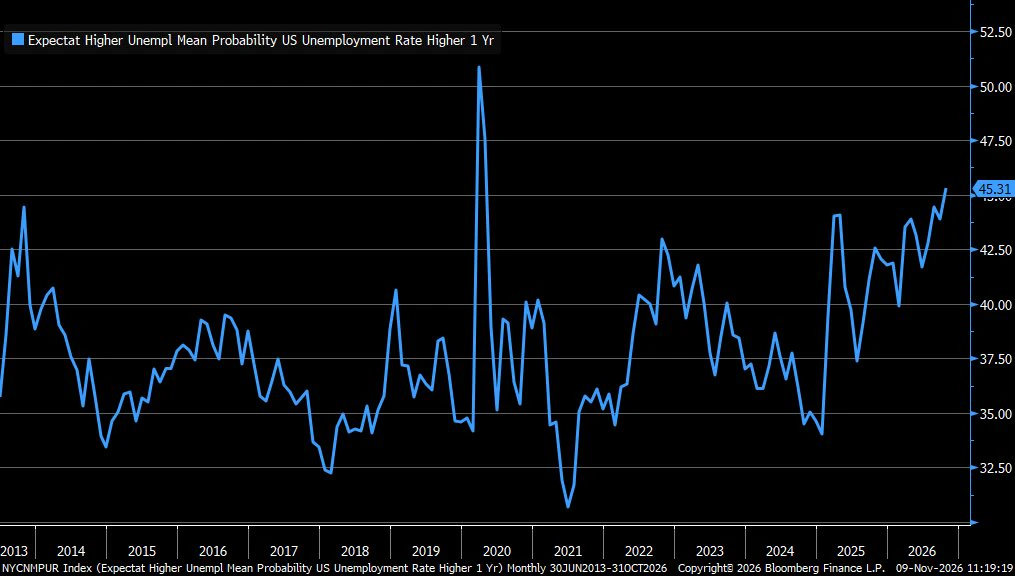
Consumer expectations for higher unemployment a year from now rose to 45.3% in October, highest since the pandemic, according to @NewYorkFed
post-image
When the whole screen was full of cries of “The bull market is back—buy the dip,” I went the other way and opened a short. $ETH I entered at 2297 and didn’t take profit at 2225. Watching it rebound and pull back with fierce volume, that familiar feeling of sideways action at the highs was unmistakable—I knew it would fall, so I added to my position, bringing my average price to 2343. Yesterday, I closed half the position at 2070.

$SND This trade was initially showing a small profit. When everyone rushed to buy the dip, I also opened a short. The direction was right; greed was the mistake. Yes
post-image
BTC-0.67%
#pi
With the current total released supply of 11.362 billion, releasing another 500 million will only push the next steady sideways price of 0.06U lower, not higher. Once the total released supply reaches 13 billion, 0.05 is sure to break. After 0.05, when the official team grants full mapping to all compliant node builders, the domino effect will begin. When all zero-cost users receive mapping, a collective panic sell-off will gain momentum, and 0.03–0.02 will definitely be reached. Lao Si will start using the Great Star-Absorbing Technique at 0.01 to test the bottom and gain control over liq
PI-0.60%
  • 2
Market Updates ABout BTC, ETH, SOL and ZEC...
live-cover
LIVE1,846
$JCT ‌ Mildly bearish, with potential for consolidation. Downside targets: 0.0100 – 0.0073. Resistance: 0.0120. The price remains below the 0.0120 resistance level following a sharp decline. The recent uptick appears to be a temporary recovery. Should it fail to break through the resistance, the price may weaken further toward the 0.0100–0.0073 range. Conclusion: Leaning toward a SHORT position. A strong breakout above 0.0120 would increase the likelihood of a bullish reversal.

Note: Crypto and stock transactions carry the risk of loss. Please conduct your own research (DYOR) before trading.
post-image
JCT-3.26%
  • 3
  • 1
$BTC ‌ BTC may see further weakness after failing to sustain its gains. The price remains below the MA5 and MA30, indicating that bearish pressure is still dominant. - Support: 74,314 – 73,550 - Resistance: 75,000 – 75,211 - MACD: Momentum is beginning to improve, but a bullish reversal has not yet been confirmed. Conclusion: BTC has the potential to decline and test the 74,314 area—or even 73,550—should selling pressure persist. The bearish scenario would be invalidated if the price manages to break through and hold above 75,211.

Note: Crypto and stock transactions carry the risk of loss. P
post-image
BTC-0.65%
  • 3
  • 1
$RSR ’s contract open interest has recently declined significantly, while short sellers are gradually applying pressure in an attempt to push the price toward lower support levels. The current trading bias for $RSR is bearish. Entry reference range: 0.001726–0.001735; first target: 0.001647; second target: 0.001580; stop-loss reference: 0.001787. Be aware that the price could rebound sharply near the 1-hour MA25 support band, triggering a short squeeze. Do not take oversized positions; position size must match your account’s risk tolerance. Risk warning: The above is for market analysis only
post-image
RSR-2.30%
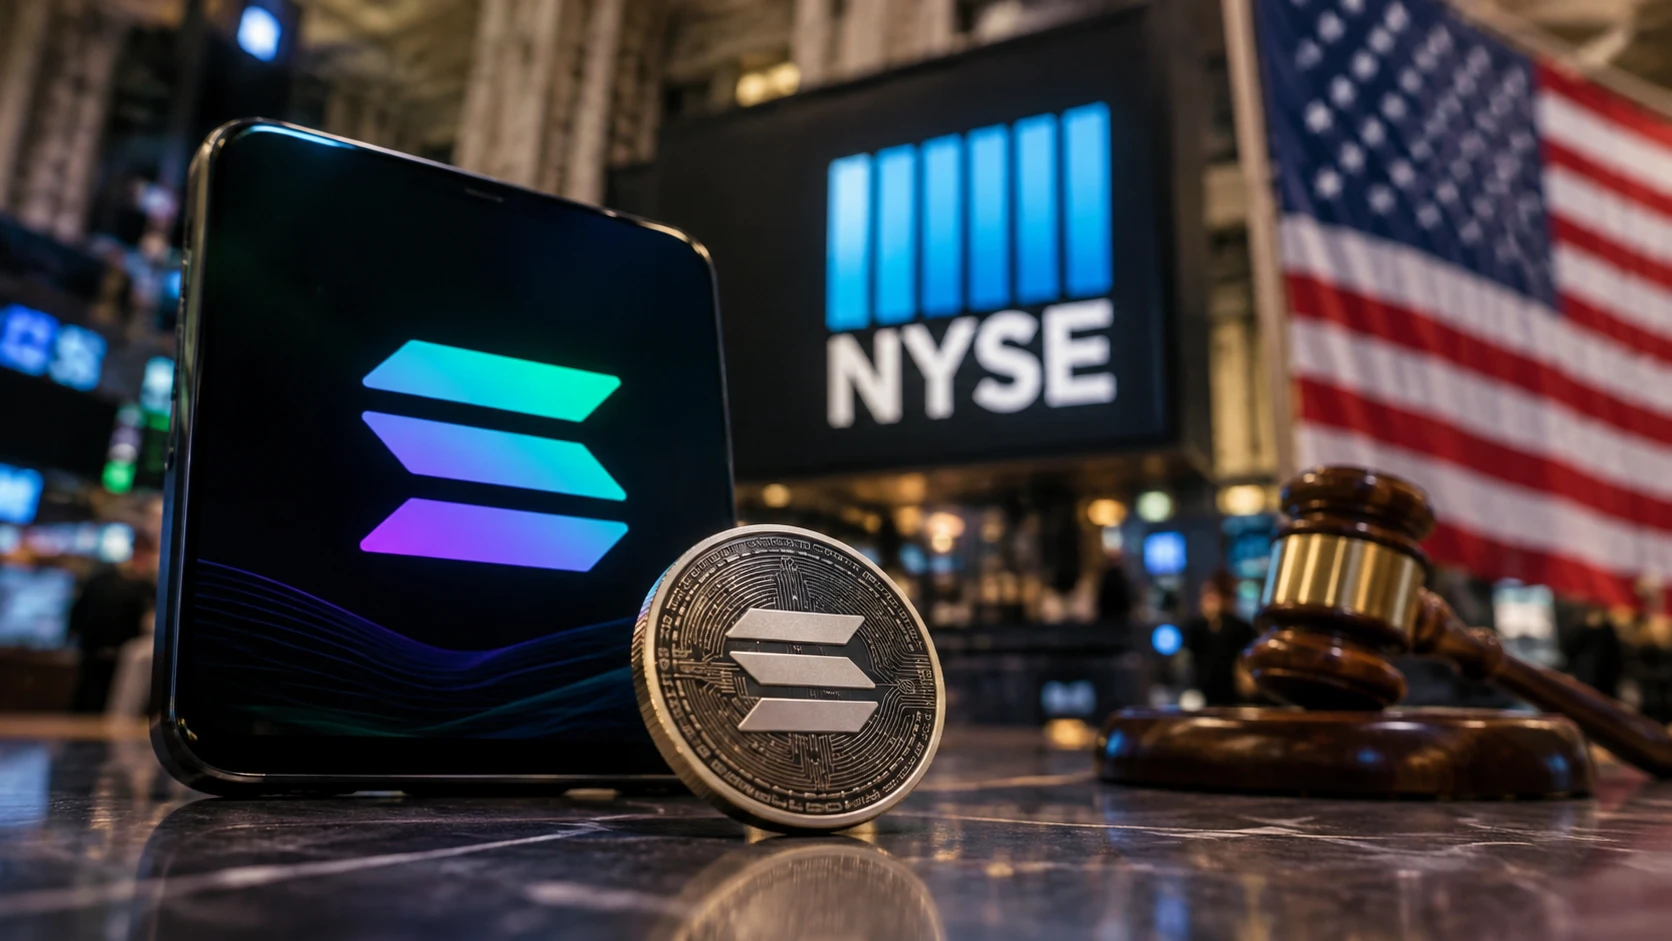
$SOL Wall Street Is Getting Closer to Solana.

Formation Securities plans to bring tokenized stock trading to Solana in early 2027, with Galaxy Digital, Forward Industries and Exodus among its initial listings.

This could be a major step for Solana beyond DeFi.

Tokenized equities could bring institutional activity, new liquidity and real-world financial use cases on-chain.

But there's a bigger question:

Will increased network adoption translate into actual demand for $SOL ?

The opportunity is significant, but execution, liquidity and regulatory approval remain key.

Can Solana become a m
post-image
SOL-0.77%
$ZEC The rally is over; it's time to go down, everyone. Take a look at this 4-hour chart. If you're still holding a long position, it's time to wake up and face reality. ZEC has seen an incredible rally, but the top is now firmly in place. Look at the structure it's formed—a textbook series of lower highs and lower lows. Buyers are completely exhausted, and every slight bounce is immediately met with heavy selling pressure. Smart money has already cashed out. The downward pull is about to take over the market. This is your chance to ride the inevitable downtrend. Entry: on a weak bounce Take
post-image
ZEC+1.16%
BTC Technical Outlook: Bitcoin Breaks Below $76K as Bearish Momentum Builds

Bitcoin is trading around $74,539–$74,555, showing renewed selling pressure after failing to sustain its October recovery. Price has dropped below the major moving averages and the 0.236 Fibonacci level near $75,503, putting the market in a vulnerable position.

The daily structure is currently bearish. RSI is approaching oversold territory, but buyers have not yet shown a convincing reversal. Bitcoin needs to reclaim nearby resistance levels before a meaningful recovery can develop.

📊 EMA Structure – Bearish Alignm
BTC-0.67%
  • 1
Democrats Sweep Congress: Is a Major Shift Coming for Crypto? Tighter SEC Oversight and Prediction M
live-cover
LIVE64
LPing on Elysium feels surreal. We're back in 2020 DeFi summer.
$HYPE Currently at 74.8, down 2.92% over 24 hours. The 1H trend is weak, with RSI at 54.12, a moving average at 74.81, and resistance at 76.87; the 4H trend is weaker, with RSI at 36.03, a moving average at 76.76, and resistance at 79.68. The 1H structure is weaker than the 4H structure, with price trading below the short-term moving average. The weak 1H trend indicates that selling pressure remains dominant. RSI at 54.12 is still well below overbought territory, and the short-term moving average is acting as resistance. Lower 4H indicators point to bearish market sentiment, and price may cont
post-image
HYPE+0.24%
Every time you land a fish, you have to check whether your shoes are dirty. It’s standard procedure.
Load More

Join 40 M users in our growing community

⚡️ Join 40 M users in the crypto craze discussion

💬 Engage with your favorite top creators

👍 See what interests you

Trending Topics

USCPIDataIncoming

43.08k Views2.03k Discussing

The U.S. October CPI report will be released on November 10 at 8:30 a.m. ET. September CPI came in at 3.7% year over year, and markets will be watching closely for signs that inflation is cooling, especially in core CPI. A softer-than-expected reading could strengthen rate-cut expectations, while hotter inflation may pressure risk assets through higher Treasury yields and a stronger dollar. How do you think this CPI print will move $BTC, U.S. stocks and gold?

RedBullDoublePodiumInBrazil

9.24k Views30.59k Discussing

BTCFlashCrash

201.03k Views66.58k Discussing

View More