Square
Following
Hot
News
Notifications
Profile
Share your thoughts
placeholder
Article
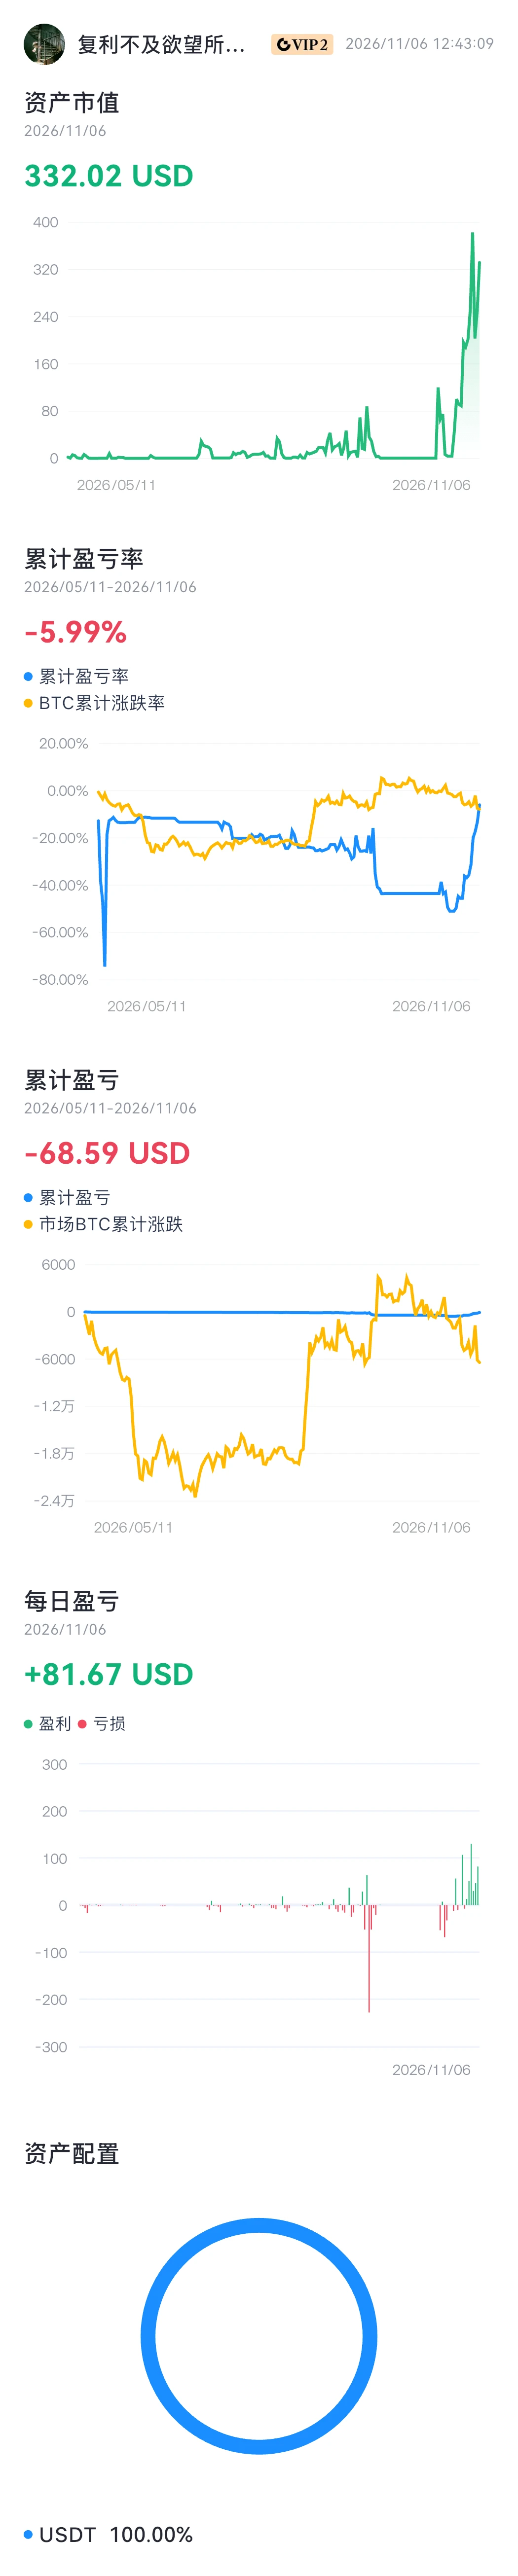
#资产分析 https://www.gate.com/wallet/assetsAnalysis
Breaking even and turning things around are just around the corner. The right timing, favorable conditions, and support are all indispensable. Starting copy-trading mode is truly a poor strategy! With no other choice, we’ll wait until the day we soar and see the light!
post-image
#USStocksFaceHistoricSelloff

The US stock market is facing a historic selloff, creating uncertainty and concern among investors. Major stocks are under pressure, and market volatility is becoming an important topic for traders around the world.

A major market selloff can happen when investors become worried about economic conditions, company earnings, interest rates, or future market growth. When confidence becomes weak, many investors choose to reduce their positions, which can increase selling pressure across the market.

This situation reminds us that financi
Trenches
fxUSD
f
bade
b
fxUSD
0x08...d8f6
Market Cap
$.
Change
.
24h Vol
$.
Holders
.
ZIG
Z
bade
b
ZIG
0x8c...1145
Market Cap
$.
Change
.
24h Vol
$.
Holders
.
BTC
B
bade
b
BTC
C5xp...pump
Market Cap
$.
Change
.
24h Vol
$.
Holders
.
CORLA
C
bade
b
CORLA
0xba...7777
Market Cap
$.
Change
.
24h Vol
$.
Holders
.
STONK
S
bade
b
STONK
6GmA...UNgx
Market Cap
$.
Change
.
24h Vol
$.
Holders
.
$PI Xiaopaipai took 2 Viagra pills and was relatively erect and firm.
post-image
PI-0.60%
🔹Democrats Sweep Both Chambers of Congress as the Dow Surges Over 3! But AI Stocks Fall Across
live-cover
LIVE2,388
📉 U.S. tech stocks tumble across the board | Post to claim a red packet, with the weekly leaderboard winner taking home up to 100 USDT!
Gate Square’s “Weekly Share” special edition on trending topics is underway!

🎁 Event rewards
New users who post: 100% chance to claim a red packet
Weekly leaderboard rewards: win up to 100 USDT

📌 How to participate
1️⃣ Sign up for the event 👉 https://www.gate.com/campaigns/6244
2️⃣ Share your views with the hashtags #每周来晒 and #美股史诗级抛售

💬 This week’s topic
U.S. stocks faced a massive sell-off on Thursday, with the Nasdaq closing down more than 5% and A
post-image
NAS100+1.31%
NVDA-9.33%
AMD-17.64%
  • 12
  • 6
🔥 What’s worth talking about today? Gate Square trending topics are live!

🔹 #USStocksFaceHistoricSelloff
Tech stocks are under heavy pressure. Is this just a correction, or the start of a deeper selloff?
🔹 #USNonfarmPayrolls
U.S. jobs data is due tonight. Will it help markets stabilize, or trigger another round of volatility?
🔹 #CryptoMarketUnderPressure
$BTC and $ETH are falling with broader risk assets. Buy the dip, reduce exposure, or stay on the sidelines?

Quality content can get traffic support + Featured placement.
💰 Got a view? Share it:
https://www.gate.com/post/topic
Gate_Square
🔥 What’s worth talking about today? Gate Square trending topics are live!

🔹 #USStocksFaceHistoricSelloff
Tech stocks are under heavy pressure. Is this just a correction, or the start of a deeper selloff?
🔹 #USNonfarmPayrolls
U.S. jobs data is due tonight. Will it help markets stabilize, or trigger another round of volatility?
🔹 #CryptoMarketUnderPressure
$BTC and $ETH are falling with broader risk assets. Buy the dip, reduce exposure, or stay on the sidelines?

Quality content can get traffic support + Featured placement.
💰 Got a view? Share it:
https://www.gate.com/post/topic
repost-content-media
BTC-0.67%
ETH-1.26%
$ELSA After this -26.8% bloodbath, I advise you not to rush to buy the dip.
I just finished watching the market, $ELSA is now at 0.0783, plunging straight from 0.1219 to 0.0770 in 24 hours, with trading volume hitting 210.9M—the kind of volume that would normally keep it moving sideways for a week was all used to sell off today. The order book is crystal clear: buy orders stacked above 0.08 were eaten up one bite at a time, and the rebound never even touched 0.085. This is a classic panic-driven sell-off, not a shakeout. The capital flows are even more obvious: heavy-volume decline + no meani
ELSA+5.80%
  • 10
  • 1
Morning Updates
live-cover
LIVE2,237
I only caught two fish, so I can't say I got skunked today, right?
The fourth trade is already up 8 points. I’ve moved the stop to breakeven—holding tight #Gate安全卫士免费开通
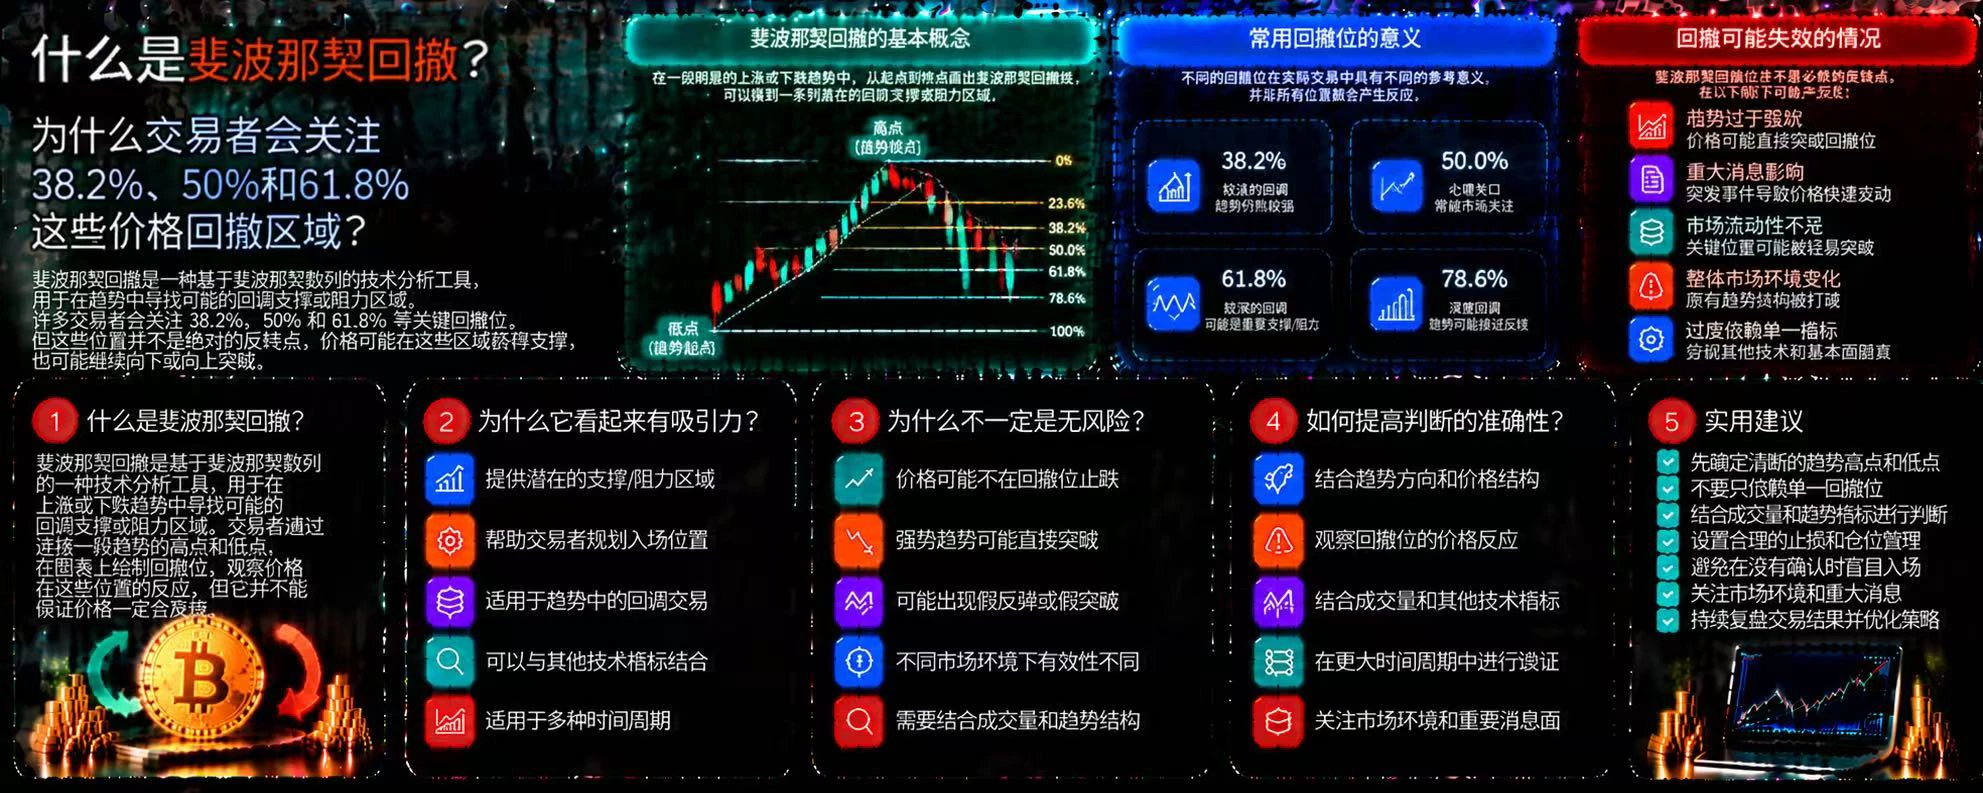
What Is Fibonacci Retracement? Why Do Traders Pay Attention to the 38.2%, 50%, and 61.8% Price Retracement Levels?

In crypto trading, prices often pull back after rising and may rebound after falling. Fibonacci retracement is a common technical analysis tool that traders use to identify potential support and resistance zones based on specific ratios. However, these ratios do not mark places where prices must reverse, nor do they guarantee profitable trades.

First, what is Fibonacci retracement?

It calculates different retracement levels between the start and end points of a significant pric
post-image
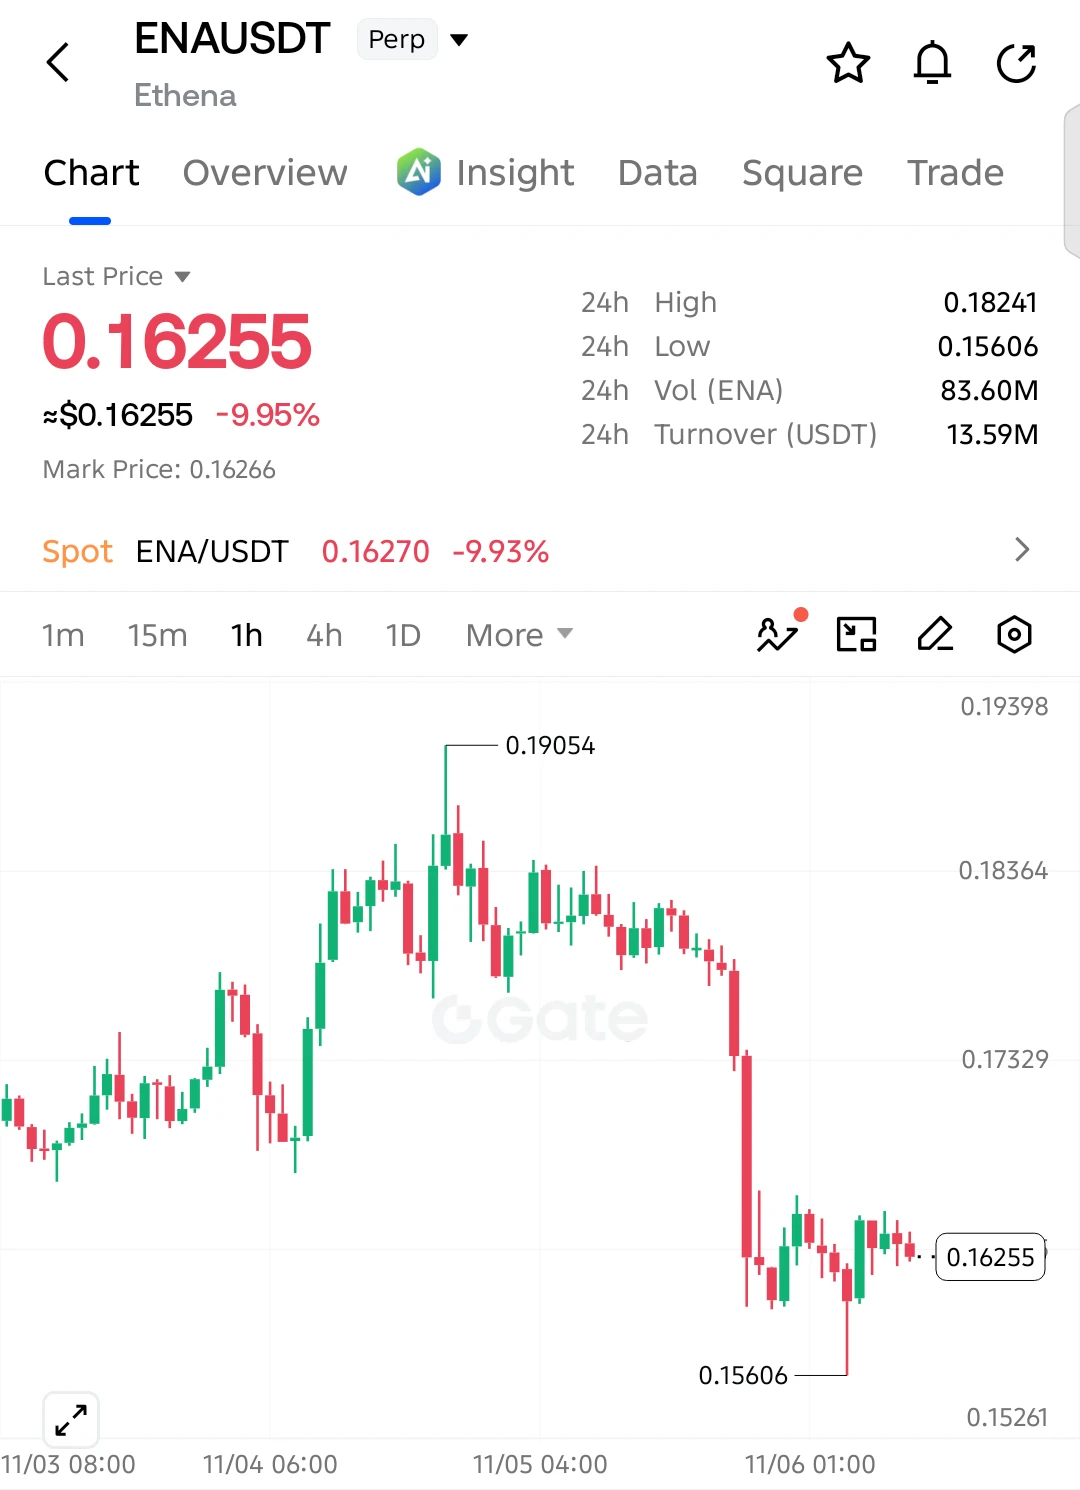
$ENA SHORT SETUP — BEARS ARE NOT DONE YET!

$ENA has plunged 9.95%, and sellers remain in control after a massive breakdown. The weak recovery suggests another downside move could be developing.

Entry: 0.16255
SL: 0.16620

TP1: 0.16000
TP2: 0.15800
TP3: 0.15606
Final Target: 0.15300

The chart shows strong bearish momentum, with price struggling to recover above 0.1650. If sellers maintain pressure and 0.15606 breaks, another wave of selling could push $ENA toward 0.15300.

Invalidation: A sustained recovery above 0.16620 weakens the bearish setup.
post-image
ENA+8.04%
  • 3
  • 2
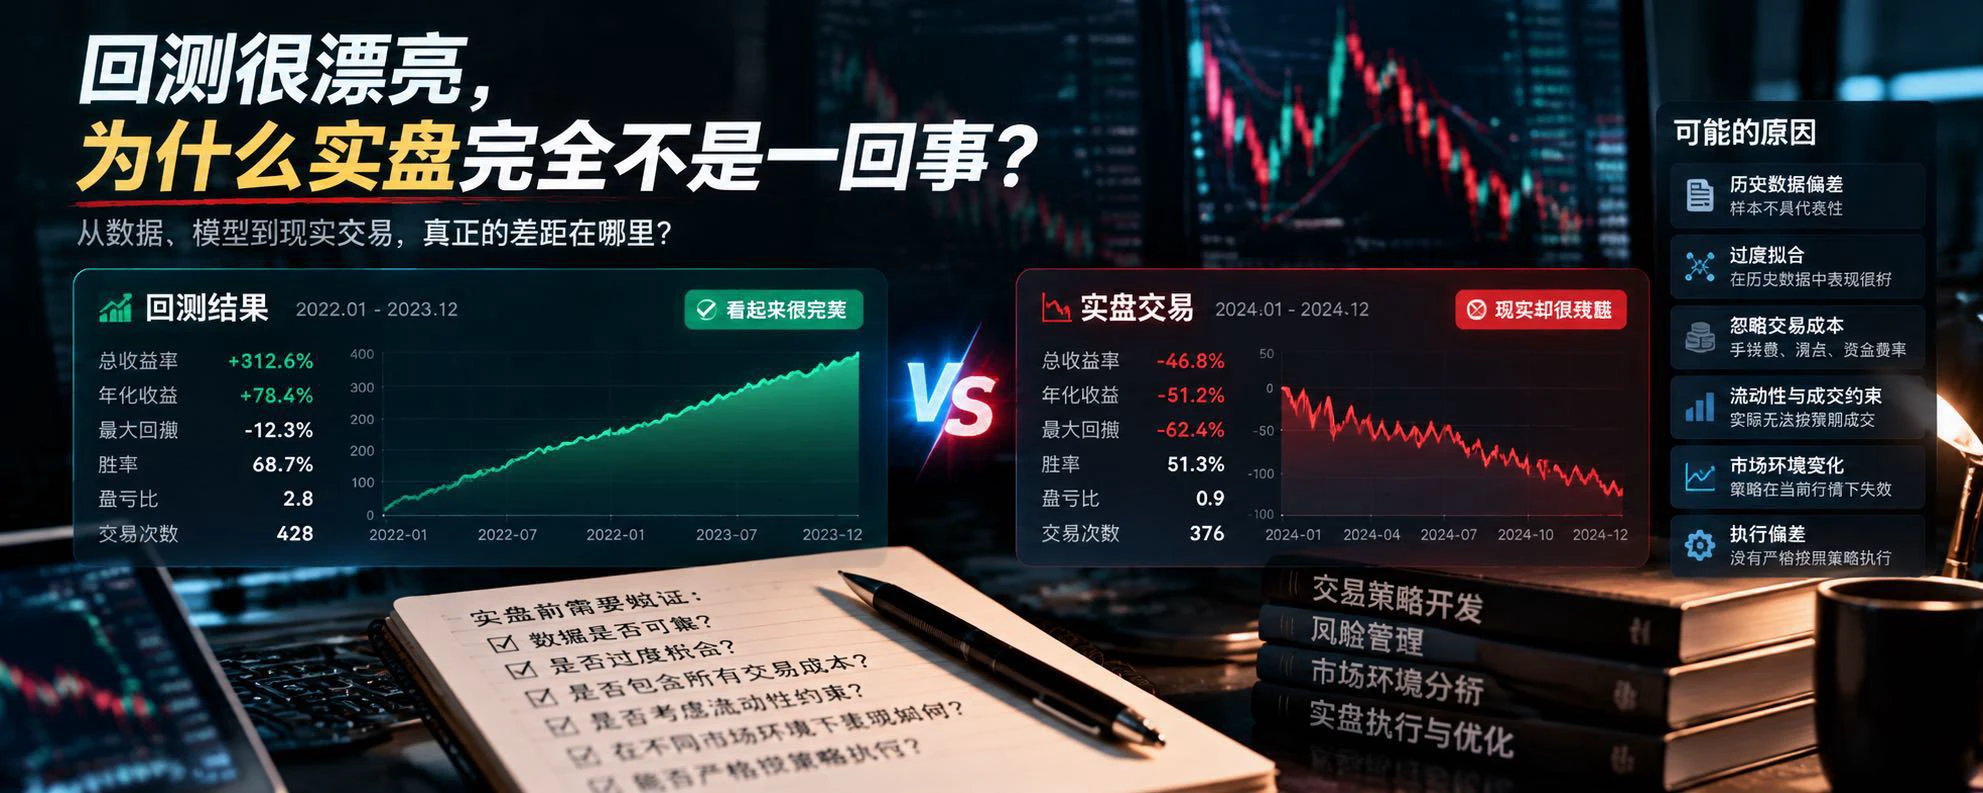
The better the backtest returns look, the more you should ask: do these results hold up in real markets?

A trading strategy has a high historical return, a decent win rate, and a maximum drawdown within an acceptable range.

You might think the only thing left is to deploy it in live trading.

But why do some strategies perform noticeably worse as soon as they enter real markets?

The problem may not be that the strategy is completely ineffective, but that the conditions it relies on in backtesting do not match those of real trading.

A backtest shows that under specific data, assumptions, an
post-image
BTC
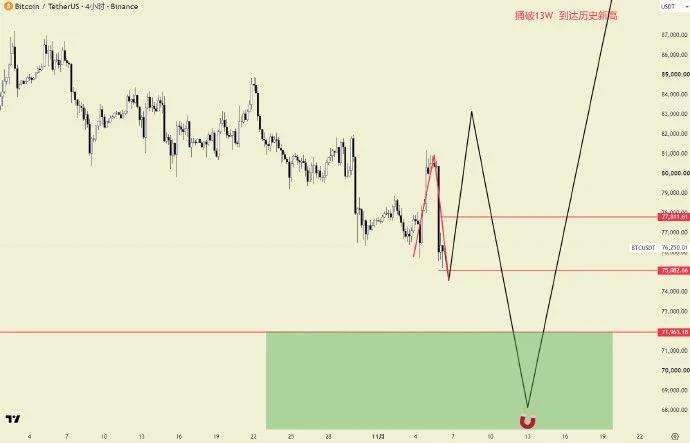
I used to constantly remind myself that if my forecast called for two V-reversals, I’d stop posting short-term analysis here and focus only on the long-term outlook.
But I was young and hotheaded, unable to let go of my conviction or swallow my pride. Once again, I’ve put myself in a position I didn’t want to be in.
If things here go the way I think they will, there’ll be three more V-reversals! That would make four V-reversals in total in the short term!!!!
But fuck it, this is my call. #btc
post-image
BTC-0.67%
📢 Reposted signal card | Source: Jotham Numb
$BCH Long trade incoming: Entry 261.49 / Stop-loss 253.8 / Target 322.94 Time: Not specified in the original post
By the way, I reposted this person's $ETHFI trade earlier today, and now they're back again. They're so diligent, even I feel outdone.😂
As always, I just repost the signals. Whether to follow and how much to put in is up to you to decide. The market can go crazy, but risk management mustn't.
Personal notes shared for reference only; this is not investment advice. #Must-read for beginners: Everything you need is here.
BCH+1.05%
ETHFI+1.48%
This level once again tested the previous low from the early-morning drop without breaking it. Accumulation at the bottom continues, though there is still some pressure. Go long at the current price—bulls, charge with me!#美股史诗级抛售 #Gate首创资金安全证明
$MSTU Down 21.67% in a day—this isn’t a pullback; someone just flipped the table.
Last night, the group was still shouting “to 33”; today, it hit a low of 23.69, with the price now at 25.63 and 24-hour trading volume at $11.1 million. What does that mean? It’s like the entire day’s sales of a medium-sized mall being crammed into this one coin, with everyone rushing for the exits. From a high of 33.02 to a low of 23.69, the range was nearly 40%. Anyone who chased the price higher this morning now has an account that feels like it’s on a drop tower ride.
In plain English: it’s like cabbage going
MSTU-3.61%
  • 6
  • 1
#AsiaPacificStocksPlunge 🔬

Is the sea of red in Asia merely profit-taking?

Those fixated on the massive red percentages flashing across their screens during the historic collapse of Asian markets are missing the true paradox: the very companies that ignited the artificial intelligence revolution are now buckling under the political uncertainty of the future they themselves created.

The wave of selling triggered in global markets following the U.S. midterm elections has swept across the Pacific, striking the heart of Asia’s technology sector with the force of a bombshell. In South Korea, th
post-image
User_any
Don’t let the numbers mislead you; those figures don’t point to a market collapse, but rather to an entirely different structural mechanism.

The real story lies within a historic wave of selling—triggered in the artificial intelligence and semiconductor sectors following the U.S. midterm elections—that rippled across the Pacific all the way to Seoul. What unfolded on Thursday, November 5, 2026, was more than just a correction; it was a watershed moment—a stress test for the AI trade, challenging both its valuations and the underlying policy landscape.

Just how severe was the sell-off on Wall Street?

The wave of selling that hit U.S. markets on Thursday marked the sharpest decline in recent years. The Nasdaq tumbled 5.52% to 24,315 points, falling 11.9% from its early-October peak and officially entering correction territory. The S&P 500 dropped 4.36%, while the Dow Jones slid 3.44%, shedding 1,833 points.

The devastation was most acute in the semiconductor sector. The semiconductor index plummeted 12.25% in a single day—its worst performance since March 2020. The stocks on your screen tell the story: Nvidia fell 9.33%, AMD 17.64%, Micron 17.23%, and SanDisk 22.24%, with various Asian ADRs also posting losses exceeding 10%. In total, approximately $2 trillion in market capitalization evaporated in just one day.

What was the hidden cause behind the sell-off?

There isn’t a single reason, but the midterm elections served as the primary catalyst. The Democrats gaining the upper hand in Congress has raised questions among investors as to whether regulations concerning the construction of data centers might become more stringent.

The market has begun to price in the possibility that the development of data centers—the backbone of the artificial intelligence revolution—could slow down due to new energy and environmental regulations. Signals from newly elected officials in states like Texas, Georgia, and Ohio, suggesting potential restrictions on data centers, have further fueled these concerns. According to one analysis, approximately 30% of the projected data center capacity in the United States through 2028 is now at risk due to potential construction delays.

Compounding this, a chip manufacturer’s announcement of a 26% decline in sales for its mobile phone chips has led the market to wonder: is spending on artificial intelligence beginning to cool off?

How did the shockwave from across the Pacific hit Seoul?

The turmoil on Wall Street spread to South Korea the moment its markets opened. The KOSPI index plummeted by more than 8%, falling below the 5,000-point mark and triggering a circuit breaker just three minutes into the trading session.

Korean corporate giants were at the heart of this collapse: SK Hynix shares fell by as much as 11.71% to 1,116,000 won—a sharp reversal, considering the company had reported record-breaking quarterly sales just a week earlier. Samsung Electronics shares dropped 9.98% to 181,400 won. A similar trend emerged in Japan, where Tokyo Electron, SoftBank, and Advantest saw their values decline by 2.58%, 8.59%, and 5.07%, respectively. Because the stock markets in South Korea and Japan are heavily weighted toward the semiconductor sector, they tend to amplify any technology-related shock originating in the United States. What is the secret behind the "-38" figures on the screen?

The extreme figures—such as -38.65% and +38.64%—seen in the leveraged products in the image do not represent a market collapse; rather, they are the result of reverse splits and the structural nature of leveraged ETFs.

For a product designed to deliver triple the daily performance of an index, a 12% decline in the semiconductor index would mathematically result in a drop of approximately 36%. The 38% decline shown on the screen also reflects a price adjustment following a reverse split. Conversely, a product designed to move inversely to the index (betting on a decline) will rise as the index falls. However, because such funds tend to lose value consistently over the long term, they frequently undergo reverse splits. The +38% increase seen on the screen is actually a byproduct of the consolidation process intended to offset the fund's historical loss in value.

In short, these figures are "structural noise" inherent to the nature of leveraged ETFs; they do not reflect the actual performance of the underlying stocks.

Is this a buying opportunity or a new regime?

The market is currently caught between two opposing scenarios. On one side are those who argue that this is merely a temporary correction—a liquidation of overheated positions in the artificial intelligence sector. On the other side are those who believe that AI valuations remain detached from reality and that this is, therefore, not a buying opportunity.

One thing is certain: the market is no longer driven by the same narrative. The triad of valuation, policy, and liquidity is being recalibrated. It would not be surprising to see further macro shocks of this nature until regulations regarding data centers in the United States are clarified. What you should monitor is the distinction between technical price adjustments in leveraged products and the primary market trend; the extent to which the declines in Seoul and Tokyo are driven by regulatory uncertainty in the United States; and whether semiconductor companies—despite these policy-related headwinds—are managing to maintain their order backlogs.

This content is for informational purposes only and does not constitute investment advice.

$MU $AMD $SNDK $TSLA $INTC
#USStocksFaceHistoricSelloff
#GateSquareTradingChallenge #Gate股票畅聊季 #GateStockTalkSeason #ShareWeekly
repost-content-media
HK50+0.05%
JPN225+0.75%
NAS100+1.31%
US30-0.42%
  • 11
  • 1
🪔 HAPPY DHANTERAS 2026 🪔
🙏 शुभ धनतेरस
✨ May Goddess Lakshmi bless you and your family with wealth, good health, happiness & prosperity.❤️
🙏 धनतेरस की हार्दिक शुभकामनाएँ!
❤️ With Love
🔥 TEAM CRYPTO AMAN 🔥
post-image
Damn, 360 blocked my system, so I can't click it
post-image
Load More

Join 40 M users in our growing community

⚡️ Join 40 M users in the crypto craze discussion

💬 Engage with your favorite top creators

👍 See what interests you

Trending Topics

USStocksFaceHistoricSelloff

1.63k Views3.53k Discussing

U.S. stocks suffered a sharp selloff on Thursday, with the Nasdaq closing down more than 5% and the Philadelphia Semiconductor Index falling over 12%. AI and chip stocks including $NVDA and $AMD were hit especially hard. Markets are reassessing AI valuations, data-center spending and future returns. Is this just short-term deleveraging, or the start of a deeper correction in the AI trade? Which sectors are you watching next?

GateLaunchesPoSECProofOfSecurity

12.56k Views576 Discussing

USNonfarmPayrolls

9.83k Views4.01k Discussing

View More