
Share your thoughts
placeholder
Article
Insiders are calling this the exact setup that gets retail liquidated.

$BTC /USDT - LONG

Trade Plan:
Entry: 77352.50 – 77455.42
SL: 76909.94
TP1: 77774.48
TP2: 78021.49
TP3: 78392.01

Why this setup?
Why now? The daily trend is bullish, the 1h price sits at 77403.96 inside the entry zone, and the 15m RSI at 61.02 shows room to run before overbought. The 1h ATR of 205.843659 means the next leg can easily push past TP1 at 77774.48 and toward TP2 at 78021.49. If the 1h price closes below the invalidation level of 77572.34, the entire long thesis breaks and the trade must be exited immediatel
BTC-0.55%
The $20 million small-cap token swept onto the gainers list overnight—I’m not chasing, just waiting for a pullback entry
Damn, $STRAX volume reached 10.256 times the 30-day average, and the 15-minute snapshot still swept it onto the gainers list. I’m not chasing here, only buying dips on a pullback.
There’s no catalyst from the event; the highlight is the volume—the $21.48 million small-cap is still 99% below its historical high.
After the event, the price moved from 0.0108 to 0.01085, while the 0.0133 high was hit before the snapshot—money is taking profits. The underlying structure remains
STRAX+5.80%
$BZ
The Hundred-Dollar Question: What Oil's Return Above $100 Means for the World Economy
Good morning. If you are reading this from a trading desk in London, a manufacturing hub in Shanghai, or a logistics office in Houston, the number staring back at you from the screen this week is one you have not seen in months. Brent crude has crossed $100 a barrel for the first time since late July, and WTI has followed it above $100 after a brief pause in early September. The last time we saw these levels, the world was still processing the initial shock of the Iran war. Now, with the conflict showi
BZ+3.27%
CL+3.69%
XTIUSD+2.72%
  • 3
  • 2
I was just about to go in and criticize it, but then I looked at the account and thought, forget it—let it pump however it wants, I’ll keep quiet.

I opened the $MAGMA chart this morning and saw funds quietly flowing in. After ranging at the bottom, it started moving up. I said not to rush to get off; the pullback was still an opportunity.

From 0.17163 to 0.25056, +905.83%—a massive gain. The wait was worth it, and this profit feels great. Those still onboard should be waking up laughing.

Being out of the market isn’t a sin; opening positions recklessly is the mistake. No matter how much
post-image
MAGMA-0.13%
DOGE-2.48%
XRP-1.92%
Thinking about $ZCAT at $5b
post-image
ZCAT-22.05%
🚨 VIP SIGNAL: $CVC /USDT
Pair: $CVC USDT
BUY ZONE / ENTRY:
Entry Range: 0.03450 - 0.03650
TARGETS:
TP 1: 0.03970
TP 2: 0.04450
TP 3: 0.04800
STOP LOSS:
SL: 0.03180
$CVC ‌#CoinDeskRevealsGateRWAPerpetualsTop3Globally
post-image
CVC+56.26%
  • 3
Everyone is sleeping on SUI while this 4h bearish trend quietly tightens its grip.

$SUI /USDT - SHORT

Trade Plan:
Entry: 0.7185 – 0.7213
SL: 0.7336
TP1: 0.7096
TP2: 0.7027
TP3: 0.6924

Why this setup?
Why now? The daily trend is firmly bearish, giving short sellers a credible macro backdrop that most feeds are ignoring. The 15m RSI sits at just 52.71, meaning momentum is flat and a directional move lower could trigger fast. With the 1h ATR at 0.005725, each candle carries enough raw volatility to deliver a clean push toward TP1 at 0.7096 and TP2 at 0.7027 from the 0.7185 to 0.7213 entry z
SUI-2.81%
$VTHO Signal】Long + Negative Funding Rate Short Squeeze/1H Sideways Accumulation
$VTHO 1H sideways accumulation, 4H upward structure intact, current price 0.0008012 near the 1H Bollinger middle band.
🎯Direction: Long
⚡Entry/Pending Order: 0.000798796 - 0.000801200
🛑Stop Loss: 0.000793188
🚀Target 1: 0.000813218
🚀Target 2: 0.000819227
🛡️Trade Management: - Execution Strategy: Reduce the position by 50% after reaching Target 1, and move the stop loss up to breakeven. If the price falls back to the entry level, exit automatically to protect the principal.
In-depth Logic: Funding rate -0.118
post-image
VTHO+21.14%
BTC-0.51%
ETH-1.60%
SOL-1.79%
I was just about to go to the forum and rant, but then I saw my balance and thought, forget it—the market is always right. 😤 When I had just finished reading the bearish news, I was still debating whether to cut the position, but the chart gave me the answer itself, so I didn’t need to worry.

The logic for shorting it isn’t complicated: insufficient support. Every rebound looks staged—there’s no one to catch it on the way up, and the volume is even lower than a few days ago. The bull-trap vibe is stronger than coffee from a few days ago. With this structure, if you don’t short it, what do y
post-image
BTC-0.55%
DOGE-2.48%
Layout for Bitcoin, Ethereum, and Dogecoin
live-cover
LIVE1,782
This isn’t a rebound—it’s just a tube being inserted into an account that’s about to flatline.

A few days ago, I looked at $ETHFI before bed. The pullback held, buying strengthened, so I said to go long with the trend once the pullback was confirmed—don’t get fired up and enter only after it takes off.

From 0.4789 to 0.6493, +2525.01% nailed it. With the rhythm timed right, those still on board should have woken up laughing.

Don’t get bloated by profits, and don’t despair over drawdowns. The market is here to cure all kinds of arrogance, especially in the person who thinks they’re the sm
post-image
ETHFI-11.32%
BNB-1.27%
SNDK-3.57%
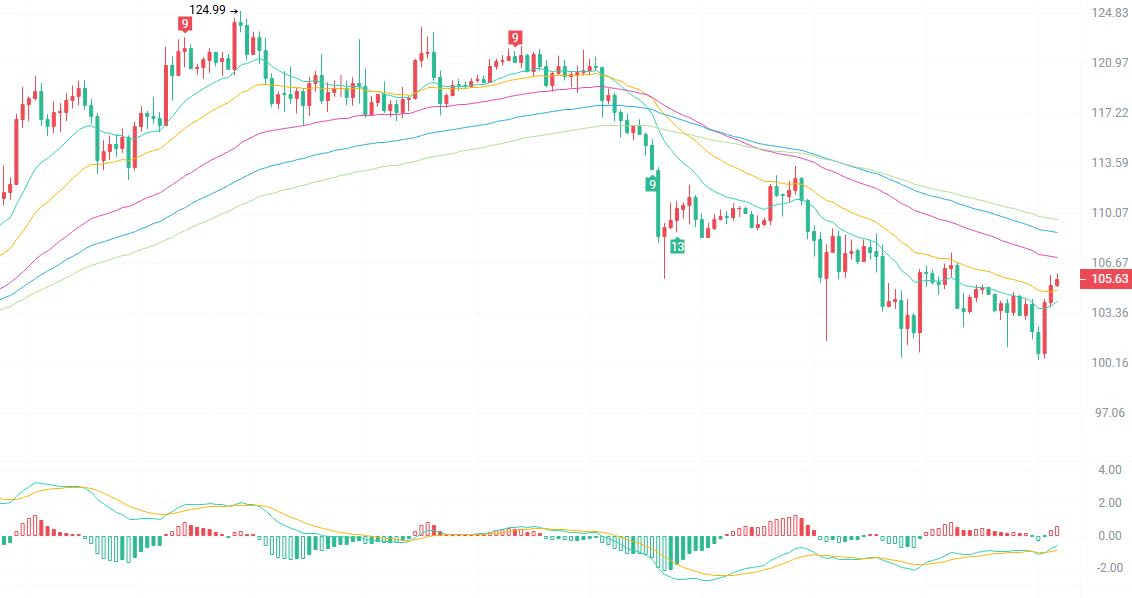
$SOL Signal】1H oversold dip buying / Bollinger lower-band rebound / Risk-reward ratio 1.5
$SOL 1H RSI 42.03, with the price falling below EMA20 (100.8220) and EMA50 (101.0097); the Bollinger lower band at 99.2435 is close to the current price.
The 22:00 1H candle saw volume surge to 512198, with a buy/sell ratio of 0.43. Selling pressure was concentrated, driving the price down, while the lower shadow closed at 100.14. Dip buying was active in the 99.24-99.59 range. The MACD histogram is at 0.0817, with bearish momentum contracting. Order book depth imbalance is -4.68%, the buy/sell ratio is
post-image
SOL-1.87%
BTC-0.51%
ETH-1.60%
$SPY $Q
Futures are sharply negative
post-image
SPY-0.75%
Everyone is about to get blindsided by a quiet SOL breakout.

$SOL /USDT - LONG

Trade Plan:
Entry: 101.14 – 101.42
SL: 99.98
TP1: 102.25
TP2: 102.90
TP3: 103.88

Why this setup?
Why now? The daily trend is bullish, the 1h price is sitting at 101.28, and the 15m RSI is at 67.6, meaning momentum is strong but not yet overbought. The 1h ATR of 0.540835 shows volatility is compressed enough to justify an entry at 101.28 with a tight stop at 100.99. If the trade holds, TP1 at 102.25 and TP2 at 102.90 are realistic targets before the extended move toward 103.88. The invalidation level of 100.99
SOL-1.87%
$STEEM Signal】Buy on pullback, capitalize on negative funding
$STEEM RSI 1H 50.09, 4H 64.33; MACD 1H bearish momentum weakening, 4H bullish momentum weakening, with momentum converging simultaneously across both timeframes. The current price of 0.06144 is below the 1H EMA20 at 0.0628, while the 4H remains above the EMA20 at 0.0547. Order book depth imbalance is -17.10%, with a buy/sell ratio of 0.71 and relatively high sell-order density above. Funding rate is -0.6199%, OI Stable, and short-side cash flow pressure continues to accumulate. The risk/reward ratio is 1.5, with a stop-loss dista
post-image
STEEM+24.34%
BTC-0.51%
ETH-1.60%
SOL-1.79%
Smart money is loading SYMBOL while retail is still sleeping on this setup.

$NEAR /USDT - LONG

Trade Plan:
Entry: 2.3402 – 2.3564
SL: 2.2709
TP1: 2.4063
TP2: 2.4450
TP3: 2.5031

Why this setup?
Why now? The daily trend is bullish and the 4h structure is armed for a long, giving us a high-confidence directional bias. The 1h ATR of 0.032246 tells us volatility is compressed enough for a clean breakout, while the 15m RSI at 55.59 confirms room to run without overbought exhaustion. Entry sits at 2.3483 with a tight zone between 2.3402 and 2.3564, offering a precise risk-defined point. Targets
post-image
NEAR-1.91%
BTC HPDATE
live-cover
LIVE88
I originally wanted to cut my losses as a sacrifice to the heavens, but before the heavens could be appeased, the meat roasted itself. The last thing I saw before bed was $SKHYNIX at 1236.43. It had stayed flat at that level all day without breaking, and the bottom structure was exceptionally clean. I figured that if it still fell, there would truly be no justice, so I went long immediately, then turned off my phone and went to sleep.
This morning, when I opened the charts, the price had already reached 1296.1, +343.99%. I got the timing right, and the profits naturally followed. The late nigh
post-image
SKHYNIX-3.48%
BNB-1.27%
SOL-1.87%
No vision, can't hold; the profit on this trade is paper-thin, but I absolutely love it. 😜

After lunch, when I checked the chart, $ARK tried to push higher again, but every surge fell just short, with no volume coming in and the key level looking intimidatingly large. Seeing this setup, I knew the rebound had clearly topped out, so I immediately placed a short order at 0.1626. I didn't even have time to post it to my feed—just got on board first.

Looking again now, the price is already at 0.1388, with a +358.92% return. I timed the move perfectly—feels great. While I can't claim to have c
post-image
ARK+11.07%
SNDK-3.57%
BNB-1.27%
Load More

Join 40 M users in our growing community

⚡️ Join 40 M users in the crypto craze discussion

💬 Engage with your favorite top creators

👍 See what interests you