Share your thoughts
placeholder
Article
I wasn’t watching the charts or thinking about it—it was moving on its own, like it was working overtime for me. When it plunged intraday, the selling pressure was indeed strong and support was insufficient. Seeing the volume get thinner and thinner, I knew there was no one to catch it on the way up. So my call at the time was simple: the rebound lacked strength, so don’t become exit liquidity. As a result, $AIOT ground straight down from 0.04561 to 0.0427, delivering +31.75% profit on the short—absolutely nailed it.

The sleepless grind paid off. In this kind of market, close 80% first and
post-image
AIOT+0.02%
LAB-26.39%
SOL-3.53%
Just hit CoinGecko’s trending searches, then the market dumped 6.4%: DOGE’s wave of attention is for unloading
Well, $DOGE had just climbed onto CoinGecko’s trending searches, only to drop 6.4% in 24 hours to a current price of 0.0836. I’m bearish; I see any rebound as an opportunity to unload.
Current status: The intraday range is 0.0823–0.0894. The daily MACD has just formed a death cross above the zero line, while RSI at 54.2 is not oversold; MA7 remains above MA30.
Bearish logic: First, the hype has peaked—the token is trending while the market is dumping; second, longs are crowded—the lon
DOGE-5.60%
Everyone is about to find out why ETH is about to run

$ETH /USDT - LONG

Trade Plan:
Entry: 2448.79 – 2460.57
SL: 2398.16
TP1: 2497.07
TP2: 2525.32
TP3: 2567.71

Why this setup?
Why now? The daily trend is bullish and the 1h price is sitting at 2454.68, right inside a tight entry zone between 2448.79 and 2460.57. The 15m RSI is at 40.39, showing just enough weakness to avoid a blowoff top while the 1h ATR of 23.547991 tells us the next move should be sharp. The first target is 2497.07, with a deeper run to 2525.32 if momentum holds, but the line in the sand is 2455.70. If that level breaks
ETH-0.82%
🚀 The EU's MiCA regulation is live! By July 2026, centralized crypto platforms will operate under a unified rulebook. But what about DeFi? 🤔 With a legal gray area looming, what’s next for $ETH ? #CryptoRegulations
ETH-0.83%
Yesterday’s Market Recap | All Four High-Level Shorts Paid Off!
▪Bitcoin: Short near 79800, capturing 3000 points
▪Ethereum: Short near 2520, capturing 110 points
▪SNDK SanDisk: Short near 1800, capturing 120 points
▪XAU: Short near 4430, capturing 110 points

When it comes to trading, choosing the right direction and following the right person are crucial. All resistance levels are analyzed and anticipated in advance, with a unified strategy shared with everyone. Only by identifying the right direction and holding onto positions can floating profits be turned into real, tangible gains. #美股录得
BTC-1.60%
ETH-0.82%
Market Analysis
live-cover
LIVE1,241
I was scared to tears—I thought the 2400 stop-loss was going to wipe me out. The flight attendant finally took a long position for once.
post-image
  • 4
I was just about to go to the forum and rant, but then I saw my balance. Never mind—the market is always right🙏.
Ever since the topping process began, I’ve been watching $BOME . Every intraday push upward kept falling just short, and the shrinking volume was visible to the naked eye—clearly, there was heavy resistance above. On an afternoon a few days ago, I decisively opened a short at 0.0011263 and warned people not to chase longs. When I opened the chart this morning, the price had already been pushed up to 0.0008452, with unrealized gains of +1203.2%. Nailed the timing on this move🎯.
When
post-image
BOME-5.00%
ETH-0.82%
DOGE-5.63%
Everyone is shorting SYMBOL, but the 15m RSI says the opposite.

$ESPORTS /USDT - LONG

Trade Plan:
Entry: 0.01091 – 0.01103
SL: 0.01022
TP1: 0.01153
TP2: 0.01191
TP3: 0.01247

Why this setup?
Why now? The daily trend is bearish, yet the 15m RSI has crashed to 15.09, signaling extreme short-term exhaustion. The 1h ATR sits at 0.00024, showing compression that often precedes a sharp expansion in the direction of the squeeze. The entry zone is pinned between 0.01091 and 0.01103, offering a precise risk-defined spot above the current 1h price of 0.01097. The first target of 0.01153 and the ext
ESPORTS-15.09%
#CNPY
CNPY Market Analysis: Can CNPY Recover From This Pullback?
CNPY is currently trading around $0.1887, and after a sharp correction from its recent highs, the market is now entering an important decision zone. The question is simple: is CNPY preparing for another recovery, or does it need more time to build a stronger bottom?
My view is that CNPY is still a high-volatility setup, but the current area is interesting because price is sitting close to an important support region.
The next move will depend heavily on whether buyers can defend this zone and push price back above the nearby re
CNPY+19.58%
I lost everything today, first $laptop now hikes...
goodbye
post-image
The latest data released by the U.S. Bureau of Labor Statistics this Thursday showed that rising energy prices last month once again fueled inflationary pressure, potentially increasing pressure on the Federal Reserve to raise interest rates at next week’s meeting.
The August core producer price index (PPI), excluding food and energy costs, rose 0.2% month over month, below the market expectation of 0.3% and slowing from the revised 0.3% increase in July; the year-over-year growth rate remained unchanged at 4.6%.
Although the core data cooled marginally, overall U.S. PPI has remained elevated
post-image
GLDX-1.86%
PAXG-1.48%
CME-0.06%
GAS-4.42%
  • 1
A few days ago, I was still wondering how to exit gracefully. This morning, it sent me straight into profit.
As it kept oscillating intraday, every upward push fell just short, with heavy resistance overhead. I opened a short at 0.06198 and left it untouched, waiting to see which direction it would choose.
Looking again just now, it had already dropped to 0.04962, bringing the position's floating profit to +489.01%. The wait wasn't in vain—I finally got the timing right for once.
Take profit on 80% first, and move the stop loss on the remaining 20% back to the entry price. Don't let profits in
post-image
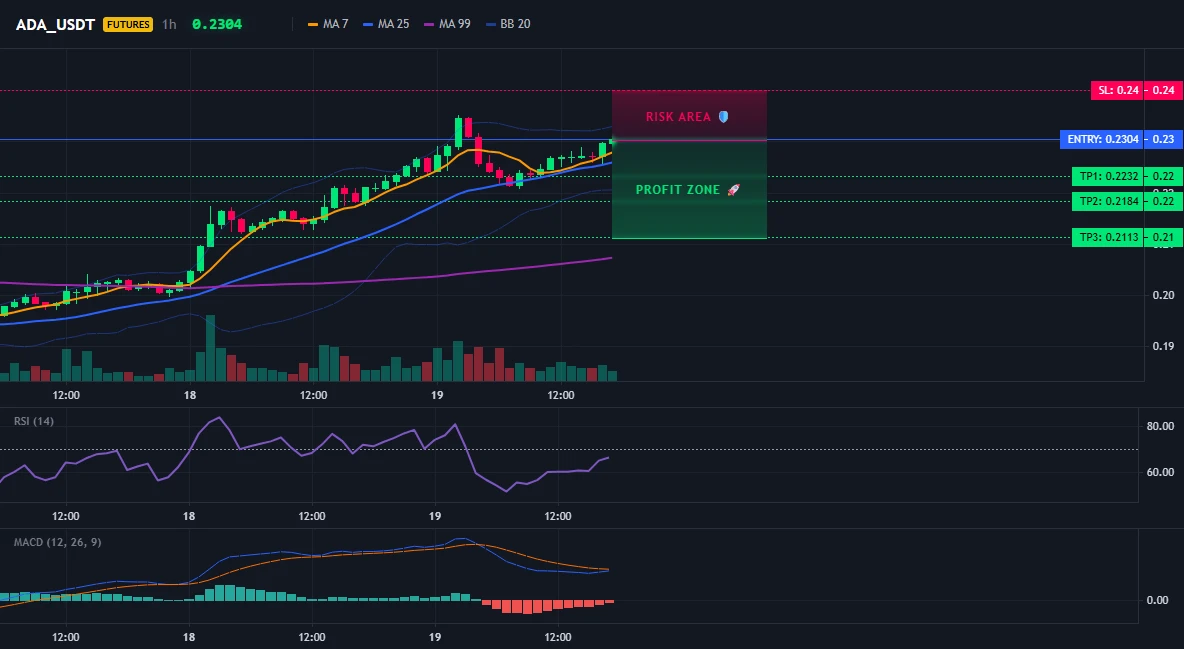
ADA-3.59%
ZEC-10.54%
Nobody is talking about the quiet move forming in $MU /USDT right now.

$MU /USDT - LONG

Trade Plan:
Entry: 980.05 – 985.31
SL: 949.82
TP1: 1007.32
TP2: 1023.75
TP3: 1048.40

Why this setup?
Why now? The daily trend is range, which means the market is coiling for a directional break, and the 1h ATR of 10.53 shows enough volatility to fuel a serious move once it decides. The 15m RSI at 27.06 signals deep oversold conditions, suggesting sellers are exhausted and buyers are stepping in near the entry zone of 982.68. With TP1 at 1007.32 and TP2 at 1023.75, the setup offers a clear ladder of up
MU-4.13%
BTC and ETH Weekly Structure Improves! Can Buyers Confirm the New Trend?
live-cover
LIVE402
$STRK has finally broken out of a well-defined cup-and-handle structure, backed by a noticeable expansion in volume.
More importantly, price is holding above the breakout zone instead of immediately losing it — a constructive sign for the higher-timeframe structure.
As long as this breakout area remains support, the setup favors continued upside and a potential trend expansion from here.
Structure first. Confirmation over hype.
#GateTop4MainstreamCEX #AppleSeptemberEvent #GateUSPartnersWithRQDClearing #GateLaunchesTrenchesWith0GasFee
post-image
STRK-13.41%
  • 6
  • 2
This move is so obvious I don't even need to think—the account is dancing on its own💃.
During the repeated intraday swings, $BTR was the most glaring name on my watchlist: its rise was sluggish, every rebound was a fake move, and the volume-price divergence was absurd. No one was buying into the rise—what else could this be but distribution? I opened a short directly at 0.20941, with the stop-loss placed above the key level from the previous wave.
Looking again just now, the price had already touched 0.04869, with +1511.55% sitting on the account. I caught the rhythm right, so there was nothi
post-image
BTR-13.38%
XRP-4.75%
SNDK-2.92%
$GT
Coiling under 9.46 after sweeping 8.89. MAs flat and converged—tight range. Volume thin, so a breakout needs a spike. Clear above 9.46 triggers continuation; rejection retests 9.17. Momentum neutral—wait for the close.
Entry Zone: 9.28 – 9.32
TP1: 9.40
TP2: 9.46
TP3: 9.60
Stop-Loss: 9.10
#GT #GateTop4MainstreamCEX #AppleSeptemberEvent #GateUSPartnersWithRQDClearing #GateLaunchesTrenchesWith0GasFee
post-image
GT+0.64%
  • 2
  • 1
Load More

Join 40 M users in our growing community

⚡️ Join 40 M users in the crypto craze discussion

💬 Engage with your favorite top creators

👍 See what interests you