Square
Following
Hot
News
Profile
Share your thoughts
placeholder
Article
🌅🚀 GATE.IO ⚡ HOT TRADER LIVE | BTCS NEXT BREAKOUT? ₿📈 | MORNING MARKET WATCH 🔥🐂🐻
live-cover
LIVE1,743
#USSeptemberPPIBeatsExpectations
📊 CPI yesterday, PPI today— inflation has repeatedly exceeded expectations. How will the market respond?
U.S. PPI rose to 6.3% year-on-year in September and increased 1.3% month-on-month, once again surpassing market expectations.
Combined with the previously stronger-than-expected CPI data, inflationary pressure has once again become the market’s focus.
But interestingly, the market has not moved in a single direction:
📉 BTC has pulled back to around $80,000, putting bulls to the test
📊 U.S. tech stocks are under pressure as funds begin reassessing risk
🥇
post-image
BTC+1.15%
$SOXL closed at $107.35 on October 15, 2026, dropping $3.19 (or -2.89%) during the regular session.
Last Close / Price: $107.35 (After-hours around $104.45)
• Day Range: $95.24 – $108.80
• 52-Week Range: $28.12 – $302.00
• Trading Volume: ~29.1 million shares
• Leverage Strategy: Seeks 3x (300%) daily performance of its underlying semiconductor index.
SOXL+0.41%
#JapanAndKoreaStocksPlunge Japan and Korea Stocks Plunge: Global Markets Face a Major Technology Sell-Off
Global financial markets experienced a sharp wave of selling on October 15, 2026, as Japan and South Korea witnessed significant stock market declines. The sell-off was primarily driven by rising concerns about persistent U.S. inflation, the possibility of additional Federal Reserve interest rate hikes, and growing uncertainty surrounding the sustainability of the artificial intelligence (AI) investment boom.
The sudden downturn highlighted the vulnerability of technology-heavy Asian marke
post-image
At 11:30, Fed Chair Powell is about to speak, and volatility is very high. This kind of event is unpredictable. The market has been sluggish recently, so there probably isn’t much room for further declines. As long as Powell does not deliver overly bearish news, the market will not become too extreme. The market will be closed on Saturday and Sunday, and the timing is right—the broader market will gradually rebound. $ETH You can open a position, set your stop-loss properly, and 2500 will be reached. #美国9月PPI大超预期
ETH+2.95%
#美国9月PPI大超预期 #每周来晒 September PPI Surges to Four-Year High—Will the Fed Take Drastic Action in December?
Following Wednesday’s hotter-than-expected CPI, the PPI once again confirmed mounting inflationary pressure. U.S. PPI rose 6.3% year over year in September, far above the expected 5.3%, marking the largest increase since December 2022; it rose 1.3% month over month, also well above the expected 0.5%, marking the largest increase since March 2022. Core PPI, excluding food and energy, was also strong. It rose 5% year over year and 0.7% month over month, both above expectations.
Energy Drives P
GAS+3.37%
CME+1.39%
C+0.76%
  • 2
Var's points for this week are out—here's how things went this week
My 12M in volume was all from SWAPs and only earned 22 points, nearly 540,000 per point. Last week it was 180,000 per point, and I got over 50 points. Although I earned very few points this week, I basically achieved zero loss
I took a look at everyone's points:
There are users ranging from 120,000 to 700,000 per point. Based on the results I've seen so far, spread is still a very important metric (because when I got 180,000 per point last week, 50% of my volume was RWA)
Although Swaps offer double points and low loss, that's
post-image
SWAP+1.96%
RWA+1.69%
FARM-0.09%
SOL+2.86%
ME+3.56%
🔥 $OGN
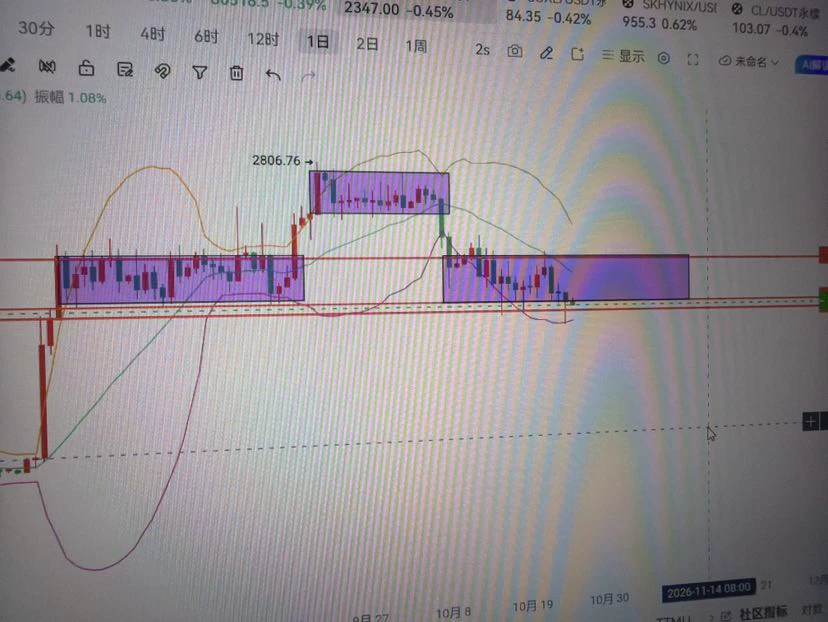
After encountering resistance near the $0.0500 resistance zone, it has continued to show bearish momentum. The price has consistently formed lower highs and lower lows, gradually falling to the $0.0300 support area. If selling pressure persists and the support level breaks, OGN may retrace further to lower levels. 📉Take profit: 0.010556 Stop loss: 0.03747 Short $OGN 👇
post-image
OGN-3.73%
Tong-ge's 10.16 ETH strategy
$ETH Enter a short around 2460-2480, stop-loss at 2500, targets 2400-2350-2300
Current price: 2442. Yesterday morning, it plunged to a low of 2313, then rebounded slightly. In the evening, bearish PPI news prompted BTC to retest 2323, but it did not break the morning low. It then rebounded sharply to a high of 2466 and has now pulled back to 2438. The fact that even bearish PPI news failed to break the previous low shows that bears are struggling to push prices lower in the short term. However, the rebound to 2466 failed to hold, so overhead resistance remains effe
post-image
ETH+2.95%
$PEPE The most interesting thing right now is not guessing whether prices will rise or fall, but seeing who will be forced to change their tune first.
The bulls' test is at 0.00000421, while the bears' test is at 0.00000383. $PEPE is currently priced at 0.00000409, up 4.60% in 24 hours. The 1-hour support is 0.00000383, resistance is 0.00000421, and current volume is 0.17 times the average volume of the past 20 bars.
I’ll first note that the $PEPE price has already moved, but trading activity and volume have not caught up, because the direction can be trusted for now, but its continuity cannot
post-image
PEPE+4.85%
$ETH A $28 billion bloodbath! A whale cut losses by $13.45 million—will the main force “kill shorts” or “bury longs” this time?
Bull markets often see sharp drops; don’t mistake a whale’s “desperate retreat” for the “charge signal” to buy the dip!
Personal view: ETH plunged to 2313 on the one-hour chart before rebounding in a deep V, currently at 2438. Combined with the liquidation chart, $280 million was liquidated over 24 hours, mainly longs, with the largest single liquidation at $11.84 million! Looking at fund flows, there was a net outflow of $53.42 million over one hour, but net inflows
ETH+2.95%
$KORUB Short-term outlook is bullish, but the risk of chasing highs is already considerable. Here is the conclusion first: the current price of 11.9 is above MA5 (11.744) and MA20 (11.389), the bullish moving-average alignment remains intact, and the MACD histogram at +0.1204 is still positive, with the trend structure under bullish control; however, RSI is only 53.4, indicating that this +11.84% rally has not pushed momentum into overbought extremes, leaving room for support on a pullback, while also meaning that the upper Bollinger Band at 12.4672 is the nearest resistance test.
From a capit
post-image
MEGA+0.53%
Live market update
live-cover
LIVE2,434
#美国9月PPI大超预期
U.S. September PPI Comes in Much Hotter Than Expected — What Does It Mean for the Market?
Recently, I have been paying close attention to U.S. economic data because I believe inflation is one of the biggest factors influencing the direction of financial markets. The latest September Producer Price Index (PPI) report has caught my attention, as producer prices increased much more than economists expected.
According to the reported figures, U.S. PPI rose 1.3% month over month in September, while the annual increase reached 6.3%. The monthly increase was the largest since March 202
10.16 Morning Analysis$BTC $ETH ‌
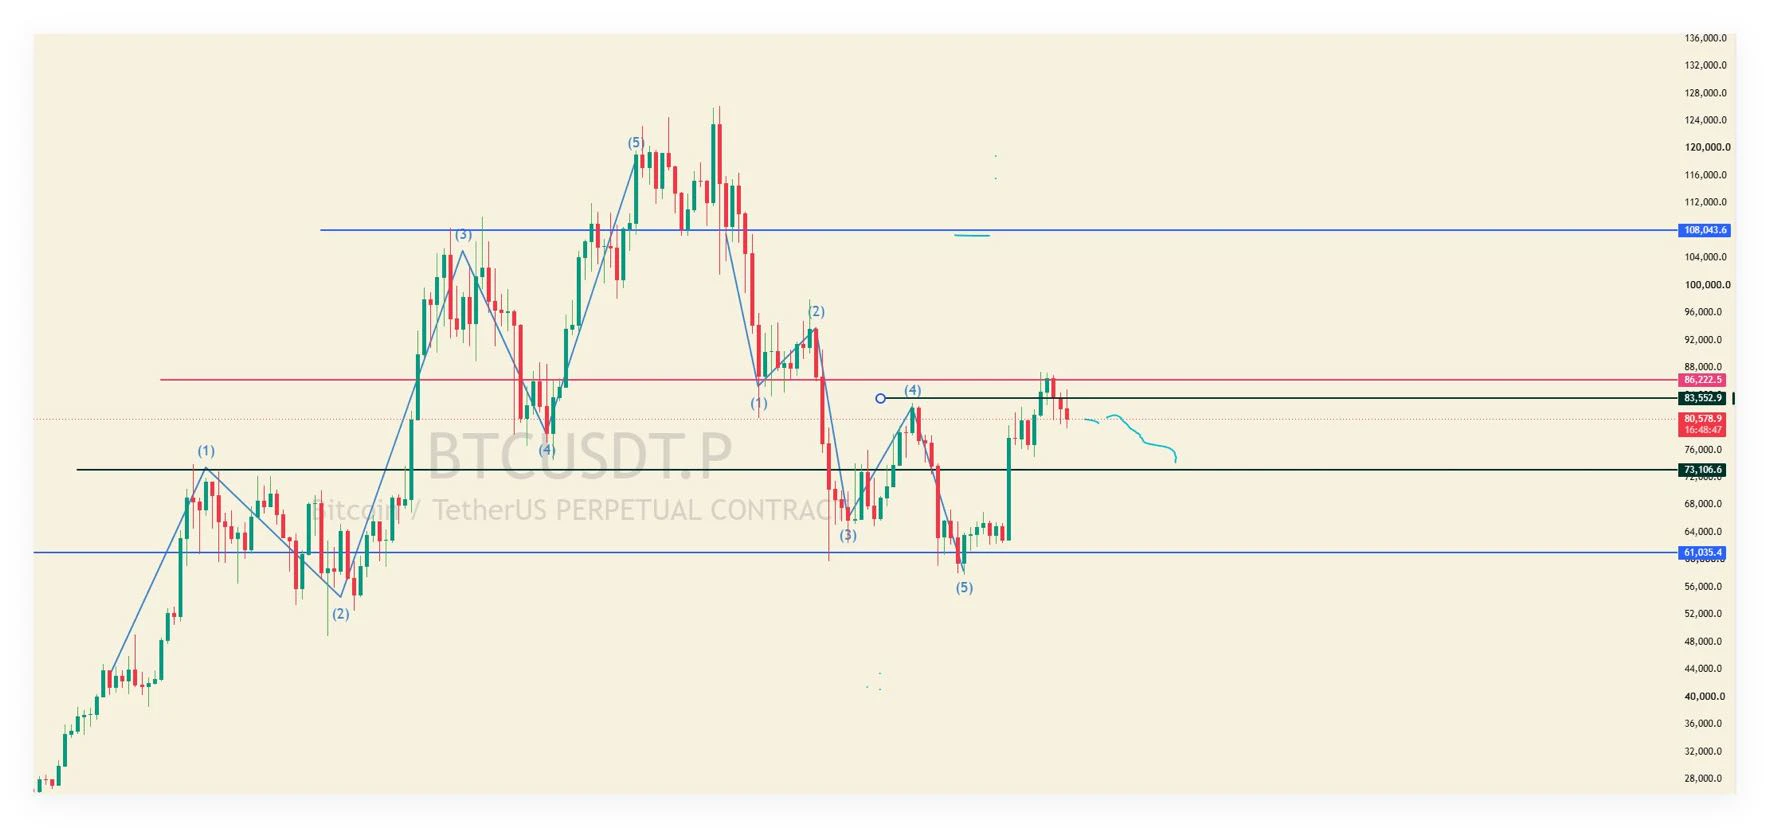
After the sharp decline in the previous period on the four-hour chart, Bitcoin finally halted its downturn at the lows and began to rebound. A solid bullish candle rose sharply from the lower Bollinger Band, with the short-term price breaking above the EMA15 resistance, showing initial signs of recovery by the bulls. However, the EMA30, EMA60, and EMA90 remain densely aligned above, forming layer upon layer of resistance and temporarily limiting the rebound. Fortunately, the oscillation indicators have already begun to improve, and the signs of a counterattac
post-image
BTC+1.12%
ETH+2.95%
Although South Korean stocks triggered a circuit breaker, there are actually two pieces of good news today: the probability of an October rate hike has fallen again, and both short- and long-term U.S. Treasury yields have also declined.
The problems that have long plagued U.S. stocks, besides aging narratives and elevated valuations prompting the market to demand earnings expectations, include U.S. stocks, Treasuries, and corporate bonds competing for liquidity.
This time, the decline in U.S. stocks drove liquidity into Treasuries, bringing in buyers and easing the Treasury crisis, while gold
$TRX TRX at End of Multi-Year Correction, Could go to $55+
TRX has spent months in an extremely tight range within what I’m counting as wave-e of E. My volatility-compression indicator is showing extreme, persistent readings, with the current stretch approaching its historical duration record.
I’ve labeled the potential 2018–2026 correction as a triangle, although other interpretations remain possible. The more immediate focus is the contracting structure developing from the 2024 high. If this triangle is completing, the count favors an upward thrust.
The bigger question is what that triangle
post-image
TRX+1.37%
🧧 Gate Live’s daily red packet rain is here—did you grab yours today?
🎙 Chat about hot market trends in real time, watch the market with professional hosts online, and join voice interactions anytime to discuss hot topics and find opportunities together~
Look for livestreams with the red packet icon on the cover—enter to participate in the red packet giveaway!
⚡ Get your fingers ready: https://www.gate.com/live
post-image
  • 2
#美国9月PPI大超预期 #美国9月CPI超预期
U.S. September CPI and PPI Both Beat Expectations — Is Inflation Becoming a Bigger Problem for the Market?
Recently, I have been paying close attention to the U.S. inflation data because I believe inflation is one of the most important factors influencing the direction of financial markets. The latest September CPI and PPI figures have given investors another reason to be cautious.
Both consumer and producer inflation came in higher than expected. For me, the biggest question is not just why inflation is rising, but how this could affect the Federal Reserve's next de
post-image
BTC+1.15%
XAU+0.52%
Load More

Join 40 M users in our growing community

⚡️ Join 40 M users in the crypto craze discussion

💬 Engage with your favorite top creators

👍 See what interests you

Trending Topics

USSeptemberPPIBeatsExpectations

91.35k Views1.9k Discussing

US September PPI came in at 6.3% YoY, well above the 5.3% market expectation, pointing to renewed producer-side inflation pressure. Weekly jobless claims were 199K, broadly in line with forecasts. Could hotter inflation further reduce room for rate cuts, and what does it mean for $BTC, US stocks, and gold?

GateWCTCS9GlobalTradingCompetition

37.87k Views6.41k Discussing

WarshIMFSpeech

62.4k Views748 Discussing

View More