Square
Following
Hot
News
Notifications
Profile
Share your thoughts
placeholder
Article
(NEW STREAMER) BTC PREDICTION
live-cover
LIVE1,091
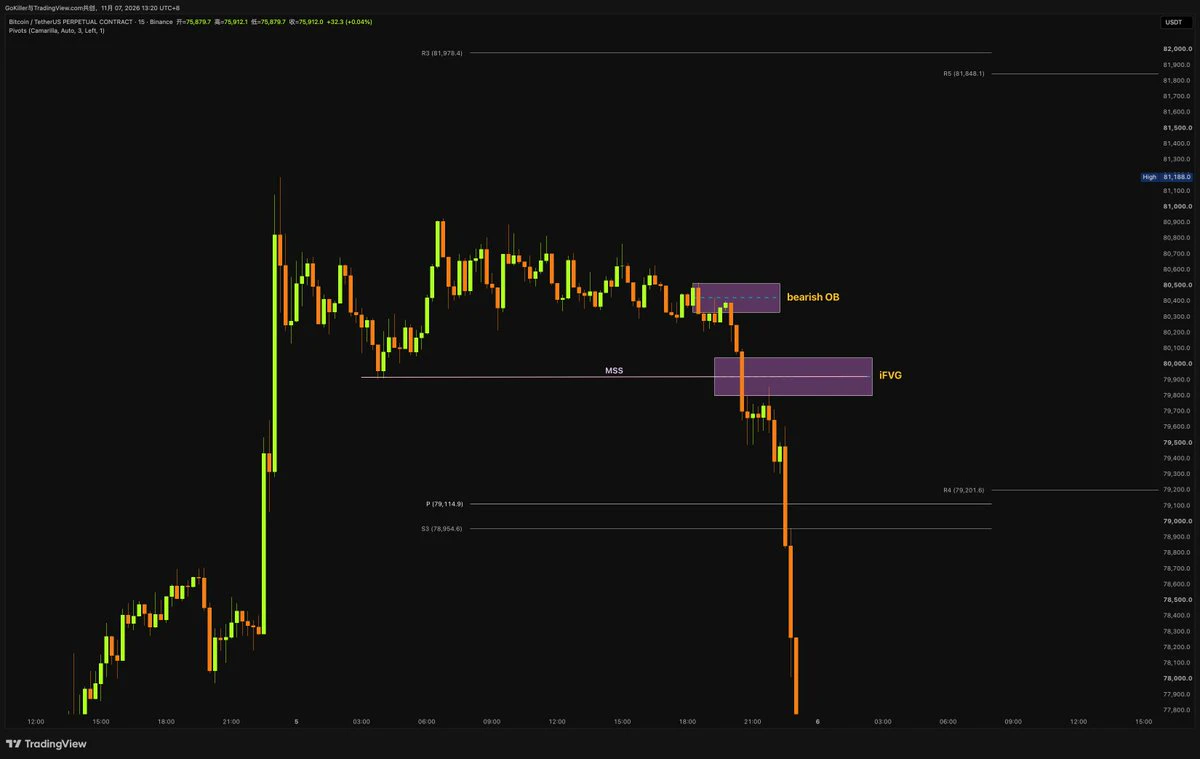
ICT reviews the signals that appeared before the drop
1. Bearish order block
2. MSS
3. iFVG
post-image
Trenches
ZIG
Z
bade
b
ZIG
0x8c...1145
Market Cap
$.
Change
.
24h Vol
$.
Holders
.
BTC
B
bade
b
BTC
C5xp...pump
Market Cap
$.
Change
.
24h Vol
$.
Holders
.
GM
G
bade
b
GM
0x13...7777
Market Cap
$.
Change
.
24h Vol
$.
Holders
.
Diamond
D
bade
b
Diamond
5VCE...pump
Market Cap
$.
Change
.
24h Vol
$.
Holders
.
STONK
S
bade
b
STONK
6GmA...UNgx
Market Cap
$.
Change
.
24h Vol
$.
Holders
.
$ONE It surged 68% in a day. I chased in at 0.0012 and almost got shaken out. Yesterday afternoon, I saw a high-volume breakout above the 1-hour chart’s previous high of 0.0013, with a MACD golden cross above the zero line, so I jumped in with half my position. After holding for half an hour, it climbed to 0.0016 and I thought I was safe. Then a big 15-minute bearish candle slammed it back to 0.0014. I nearly lost my nerve—I nervously hit close and took 12% profit. Then I watched helplessly as it surged to 0.0020. Kicking myself. Lesson: after a high-volume breakout above the previous high, as
$BTC Pay attention to the higher time frames. The lower time frames are too difficult to trade—afraid of going long at the top or short at the bottom.
As long as the weekly chart doesn't break below 70,000, I still see this as the early bull market. Those saying it will fall to 30,000 or 40,000, show your orders. Are you holding any short positions?? If not, could you analyze things rationally?? Why keep calling for 30,000 or 40,000?
Looking at the 4h chart, BTC is near the lower boundary of the ascending channel, with a confluence level at 70,500. The two relatively important support levels a
BTC-0.67%
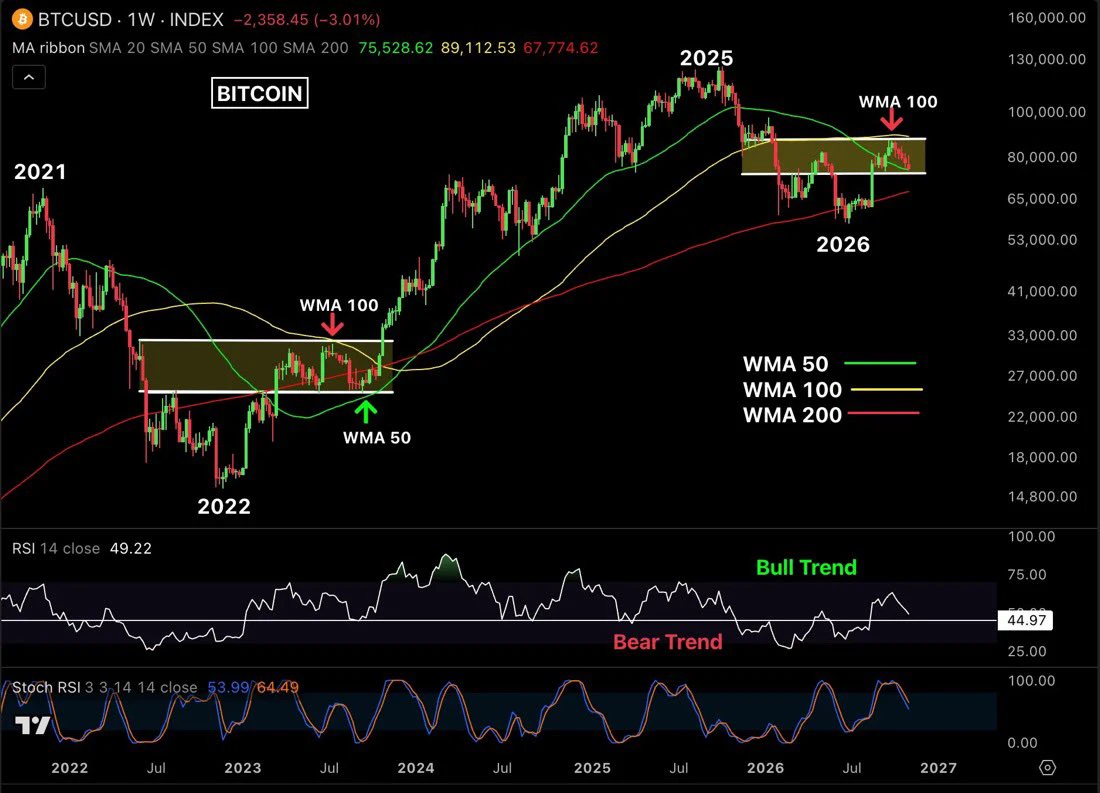
#Bitcoin is showing a similar setup to 2023.
Back then, $BTC consolidated between the Weekly MA 50 and MA 100 before breaking out into a major rally.
Now, in 2026, it’s trading between the same moving averages after getting rejected near $87,400.
Key levels to watch:
Support: $75,500 and $67,800
Resistance: $82,000 and $87,400
RSI: Around 50
Stochastic RSI: Still weak
If BTC holds support and reclaims the Weekly MA 100, another major rally could follow.
Will history repeat itself?
post-image
BTC-0.67%
$SHIPPED @shippedbond
Delivery bonds for tokens, NFTs
and apps. Creators lock real money behind a public promise. Ship on time and they get it back, miss and holders get paid.
Launched on @ripplesdotrun .
Feels like the third solid utility play there after $BRAIN and $ZENI, both ran hard.
Worth a gamble.
0xCdF2aD9e12D599640321372499768eCA4C4C0000
RR.
post-image
Why might your account's overall risk be far greater than expected even when you've only made a few trades?

Many traders review their positions one by one but overlook a more important question: Do these trades share a common source of risk?

Suppose you hold long positions in BTC, ETH, and SOL at the same time. On the surface, you hold three different assets; but if they are all affected by a broad market downturn, a contraction in liquidity, or declining risk appetite, all three trades could lose value together.

These are three issues in portfolio risk that are often overlooked.

1. Correl
post-image
BTC-0.67%
ETH-1.26%
SOL-0.77%
How much capital should be allocated to a single trade? Why do some traders get the direction right, yet their accounts continue to lose money?

Many people study entry signals, technical indicators, and market forecasts, but overlook a more fundamental question: how much risk should each trade take on?

Even if the trade direction is judged correctly, the final result may still be unsatisfactory if the position is too large, the stop-loss distance is unreasonable, or trading costs are underestimated.

Today, we compare three common position-sizing methods.

I. Fixed position sizing: invest th
post-image
#GateGuardNowAvailableForFree #GateGuardNowAvailableForFree
Remote device control and SIM-swapping attacks are the most concerning risks on the list. Unlike standard phishing, SIM-swapping bypasses traditional SMS-based 2FA, while malware that grants remote access can hijack authenticated sessions directly on a device—without ever requiring a password.

Beyond standard passwords and 2FA (via SMS or email), robust security setups typically rely on several additional layers:

Essential Advanced Security Measures

Hardware Security Keys: These replace software-based authentication apps or SMS wi
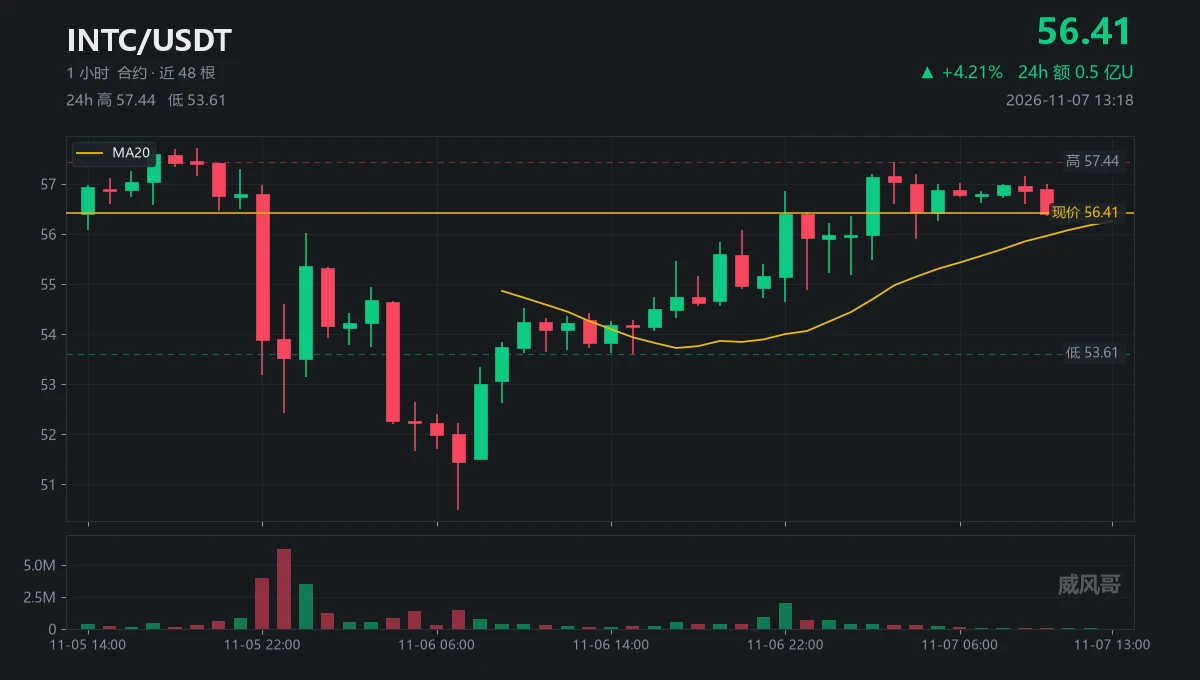
$INTC 56.40, up 4.42%
High 57.42, low 53.60
Now trading just 1.8% below the high
Four days ago, it was still hovering around 52
This move is semiconductor-wide
MU and NVDA are both following
But it’s the weekend
The U.S. market is closed—who set this price?
A few market makers on the floor are testing each other
Before Monday’s open, 56.40 means nothing
I’m not chasing it
If you really want to chase, wait for it to hold above 57.42
Set the stop-loss at 55.8, target 60
Risk-reward ratio of 2.8, but you have to wait until Monday
(Not investment advice; you’re responsible for your own gains and l
post-image
INTC+0.05%
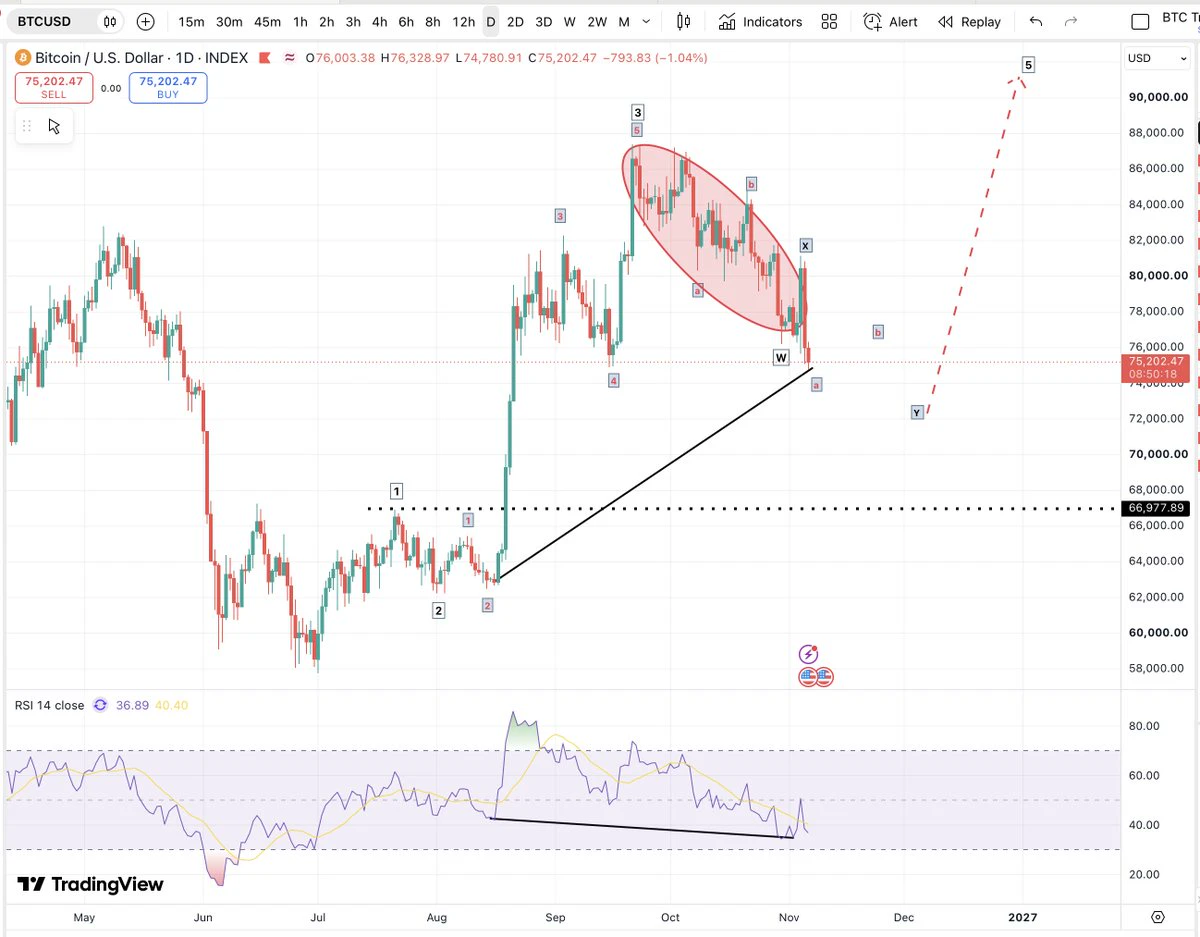
#BTC alternate count: Wave 4 may still be unfolding as a W–X–Y correction. That leaves room for a move toward $72k before a potential wave 5 higher. A break below $67k would invalidate the impulse count as drawn.
post-image
BTC-0.67%
🚀 ONE/USDT Market Breakdown: Explosive Bullish Momentum and Technical Outlook

Harmony (ONE) is making massive waves in the market today, showcasing an impressive explosive rally on Gate.io. Let's dive deep into the key metrics, technical chart structures, and what traders should watch next.

📊 Key Market Statistics
Trading Pair: ONE/USDT (Harmony).

Current Price: Trading dynamically around 0.0019282 USDT (moving up from recent lows of 0.0010973 USDT).

24-Hour Performance: Surged significantly by +72.70% (and +70.78% on alternating ticks).

24-Hour Trading Range: Reached a 24-h
ONE-1.38%
  • 1
Tech Stocks Plunge: Is Buffett-Style Investing Back in Favor? Three Sectors Worth Revisiting!

As AI darling stocks plunge across the board, investors are finally remembering one thing: There are other options in the stock market besides tech stocks.
All 11 sectors of the U.S. stock market fell on Thursday, suggesting this is not simply a rotation within tech stocks, but a clear decline in overall market risk appetite.
If the market remains volatile, I’ll focus on three areas.
First, consumer staples. Demand is relatively stable, and corporate earnings may be less affected by economic fluctuat
AMD+11.55%
  • 47
What is maximum drawdown? Why doesn’t an asset’s eventual recovery mean that holding it involved no major risk?

In the cryptocurrency market, some traders assess an investment this way: “It eventually went back up, so I just needed to hold on.”

But this view overlooks an important question: How much did the asset fall before recovering? Could the account withstand this drawdown? If leverage was used, could the position have been liquidated before the recovery?

To answer these questions, we need to understand Maximum Drawdown (MDD).

First, what is maximum drawdown?

Maximum drawdown measure
post-image
Can BTC hold $76,000? Will the next bull market start again from here?

If BTC really can stabilize around $76,000, I believe market sentiment will improve significantly. But what I'm more concerned about is whether this rally has staying power.
I think there are three key areas to watch.
First, price structure: Can it form higher lows, rather than seeing every rebound pushed down by selling pressure?
Second, fund flows: Are institutions and spot markets continuing to buy, rather than activity being limited to the futures market?
Finally, the macro environment: Fed policy, the dollar's traject
BTC-0.67%
  • 23
Layout: Bitcoin, Ethereum, Dogecoin
live-cover
LIVE1,320
  • 1
Buying stocks is like dating! When I’m bullish on a company, is it because of its fundamentals or because I’m caught up in the excitement?

What do you look at first when you’re bullish on a company? Revenue growth, industry prospects, or the CEO’s ability to paint a rosy picture?
To me, investing is a bit like dating. When you first meet, you notice the looks—that is, the stock price trend. Once you get to know each other, you look at the personality—that is, the company’s fundamentals. What really determines whether you can stay together long term is its ability to make money.
A company wort
  • 40
What Is Correlation? Why Don’t Two Coins Have the Same Risk Even If They Often Rise and Fall Together?

In cryptocurrency trading, many people notice that when BTC rises, ETH often rises too; when the market falls, many altcoins also decline together.

This phenomenon of moving together can be analyzed using correlation coefficients. But an important question is: if two coins often rise and fall together, does that mean they have the same risk?

The answer is no.

First, what is a correlation coefficient?

A correlation coefficient is a statistical measure of the direction and strength of the
post-image
BTC-0.67%
ETH-1.26%
After that last wave, things have been quiet on $LIT 's side. Now just watching these moving averages—have buyers really regained their footing, or are we just waiting for the next rug pull? Take-profit: 3.5826 Stop-loss: 3.3065 Other coins: $BTC : Current price 75,889.7 - 24-hour change: +0.34%$ICNT $ICNT : Current price 0.2968 - 24-hour change: +33.39%
post-image
LIT-4.56%
ICNT-10.32%
#USStocksFaceHistoricSelloff #ShareWeekly
U.S. Tech Stocks Face a Historic Sell-Off: Is AI Entering a Deeper Correction or Creating a New Buying Opportunity?

The U.S. stock market experienced a massive sell-off on Thursday, November 5, 2026. Technology stocks, semiconductor companies and AI-related businesses faced heavy selling pressure. The Nasdaq plunged more than 5%, while several leading chipmakers recorded double-digit losses.

In my opinion, this is not an ordinary market dip. Investors are reassessing expensive AI valuations, data-center investments, future profitability and the risk
Load More

Join 40 M users in our growing community

⚡️ Join 40 M users in the crypto craze discussion

💬 Engage with your favorite top creators

👍 See what interests you

Trending Topics

USAIStocksHitHard

15.28k Views3.64k Discussing

U.S. stocks sold off sharply on Thursday, November 5 (UTC). The Nasdaq closed down around 5.5%, entering correction territory, while the Philadelphia Semiconductor Index plunged roughly 12%, with chip stocks including $NVDA and $AMD posting steep losses. Beyond profit-taking, investors are growing concerned about the pace of AI data center construction, capital spending, and future returns on investment. The key question now is whether the AI sector’s lofty growth expectations need to be repriced. Where do you think the next opportunities will emerge: chip stocks, tech giants, or other sectors?

USNonfarmPayrolls

22.89k Views4.24k Discussing

StakeOnLaunchpoolToShare450KVLX

2.02k Views759 Discussing

View More