Square
Following
Hot
News
Notifications
Profile
Share your thoughts
placeholder
Article
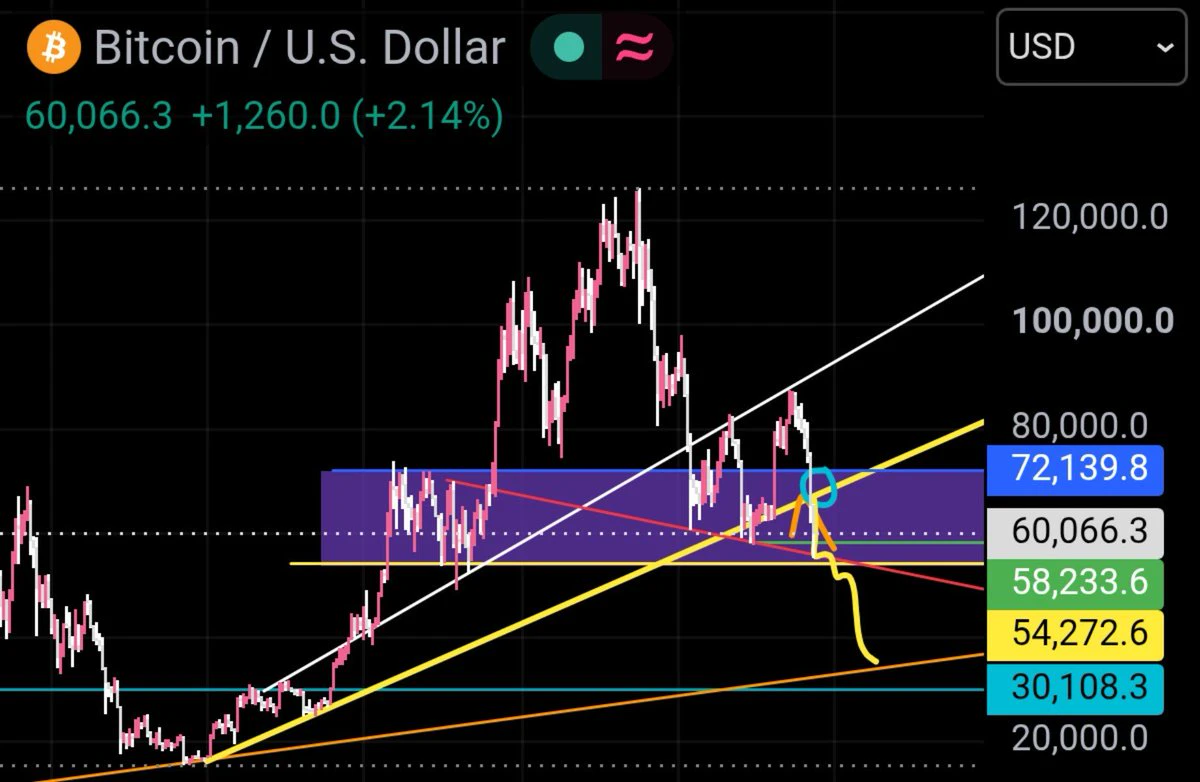
Continue holding the core long position and make T-trades based on the subscription levels.
At short levels, reduce your long position; at long levels, add to it. Repeat this process to preserve and maximize profits#BTC跌破6万美元关口
See the subscription updates below for specific levels
TradingKingGaoYuliang
Sharing the latest early-session levels! #BTC跌破6万美元关口
Last day of the limited-time subscription offer; prices return to regular rates tomorrow!
BTC-0.67%
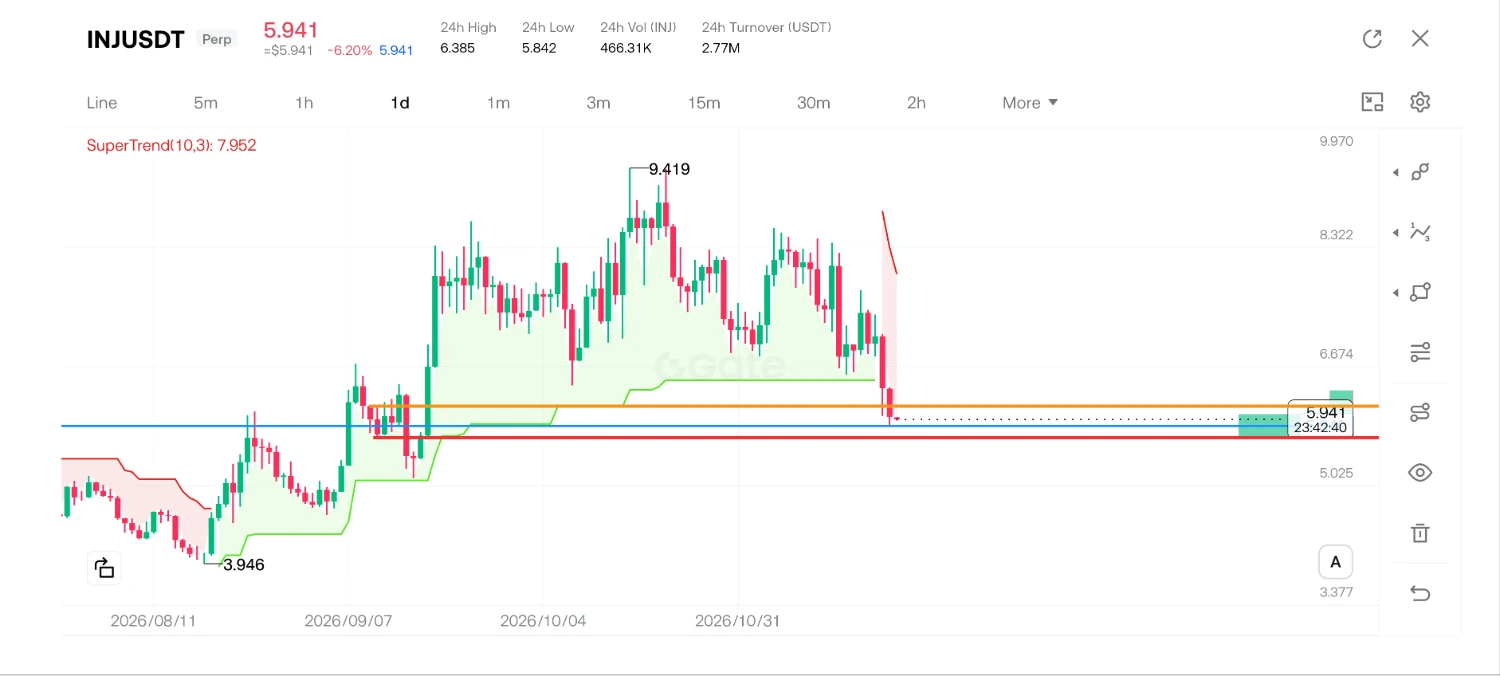
$INJ ‌
⏳If my calculations are correct, the candle will close bullish today.
✅ I am adding to my long position today.
post-image
INJ-1.67%
Trenches
IDOL
I
bade
b
IDOL
0x3b...ab07
Market Cap
$.
Change
.
24h Vol
$.
Holders
.
PIEVERSE
P
bade
b
PIEVERSE
0x0e...25a9
Market Cap
$.
Change
.
24h Vol
$.
Holders
.
FIONA
F
bade
b
FIONA
B34n...pump
Market Cap
$.
Change
.
24h Vol
$.
Holders
.
CLAUDIA
C
bade
b
CLAUDIA
2j5S...W2ZM
Market Cap
$.
Change
.
24h Vol
$.
Holders
.
Singularity
S
bade
b
Singularity
7R4M...pump
Market Cap
$.
Change
.
24h Vol
$.
Holders
.
$ENA Cycle Divergence: 1-Hour Strength, 4-Hour Weakness—Which Will Shift First?
Currently, $ENA is at 0.0989 USDT, down 0.60% over 24 hours, with a range of 0.0897–0.1002. The 1-hour trend is bullish, with support at 0.0897 and resistance at 0.1; the 4-hour trend is bearish, with support also at 0.0897 and resistance at 0.1181. The two timeframes give opposing signals, and the direction is still being contested.
The 1-hour RSI is 75.6, already in overbought territory, and EMA20 at 0.09770221 is below the price; the 4-hour RSI is 37.8, indicating weakness, and EMA20 at 0.10242771 is above the
post-image
ENA+8.04%
#PI News, everyone, any thoughts??
post-image
PI-0.60%
  • 1
The Musk-themed Little Puppy emerged out of nowhere within a minute of Musk tweeting “l love you puppies”; its contract address ends in 6eb2, and it is listed on more than a dozen exchanges. Communities are actively building in over 50 countries. Worth accumulating at low levels
$IDOL This rally looks like luck, but it was really an opportunity that had been lying in wait for a long time. The name is clever, and the price action delivered too, hitting 0.048 with pinpoint accuracy, like a tailor-made starting point. It surged +50.13%, leaving little time for anyone to hesitate.
$IDOL The contract tag is still there; the story has only just begun.
Risk warning: The above reflects personal views only and does not constitute investment advice. The crypto market is highly volatile, so please be sure to manage risk.
post-image
IDOL-6.71%
The European Central Bank (ECB) is taking a significant step toward integrating blockchain technology into the traditional financial system. Under its "Appia" initiative, the ECB is seeking banks and financial institutions to partner on experiments involving tokenized deposits and securities. The deadline for applications is December 11.

This move by the ECB is part of a broader vision to transition existing financial infrastructure toward a blockchain-based framework, rather than creating an entirely new currency. The institution requests that interested parties apply as part of consortia—gr
post-image
  • 3
  • 2
The FBI’s own criminal database may have been hacked—talk about irony!
The NCIC, used by law enforcement agencies across the U.S., has also reportedly been breached. It contains fugitives, missing persons, criminal records, and stolen property—if that data leaked, who would take responsibility?
Both AP and NBC got word from people familiar with the matter that the FBI is investigating, but on Saturday the FBI flat-out declined to comment, not even bothering to give the public a “we’re investigating”
Axios said the scope remains unclear and there’s no proof the attackers took the entire databas
post-image
Market Prediction
live-cover
LIVE2,566
BTC-0.67%
Short $PROM ‼️ Rejected at the major FVG—the area looks strong, and price is expected to pull back to support. Entry: 4.97 - current price. Take profit: 4.520 Stop loss: 5.300 Trade here $PROM 👇
post-image
PROM+0.45%
Short-term view on $BTC and U.S. stocks: Bitcoin’s realized price is at $53,000, and the long-term holder cost basis is $48,000. This crash took it from $87,000 to $55,000, a drop of $32,000 already. Even if it falls another $10,000, averaging down means you still wouldn’t be at a loss if it rebounds to $60,000. Bitcoin’s 3-day and 5-day moving averages and weekly KDJ are all already negative, so a rebound could happen at any moment. Wait for a Fibonacci retracement bounce before considering shorting. Given the current market, BTC is only one wave away from completing its seven-wave pattern o
post-image
BTC-0.67%
NAS100-0.07%
$XRP The current 1-hour and 4-hour trends are showing a clear divergence. The 1-hour timeframe is bullish, with the RSI as high as 74.12, while the 4-hour timeframe is bearish, with the RSI at just 39.37. Short-term traders may see a strong uptrend, while investors focused on longer timeframes may think the market remains under downward pressure. This divergence makes the current trend difficult to assess, especially with the price already nearing the 1-hour resistance level of 0.9389.
I would choose to wait at this level, as chasing a long position carries significant risk. The current price
post-image
XRP-1.15%
BEAR CARNIVAL ROUND 2?
$BTC
post-image
BTC-0.67%
market update and trading signal with sheen crypto
live-cover
LIVE2,090
BTC-0.67%
ETH-1.26%
SOL-0.77%
Nov 22 morning session: ETH resumed moving sideways after a rebound. Watch the 1674–1692 range first.

There is support at 1674–1676, where you can wait for a brief long opportunity after the price stabilizes. If it fails to break through 1689–1692, watch for a pullback. If it later holds above 1692 on increased volume, look next at 1697–1705; if it breaks below 1672, watch 1663 and 1653.

My approach is to stay mostly inactive in the middle and wait for confirmation at key levels. Don’t let a sharp rally or sell-off throw off your rhythm. The key now is which of these two levels gives a direc
post-image
ETH-1.23%
  • 2
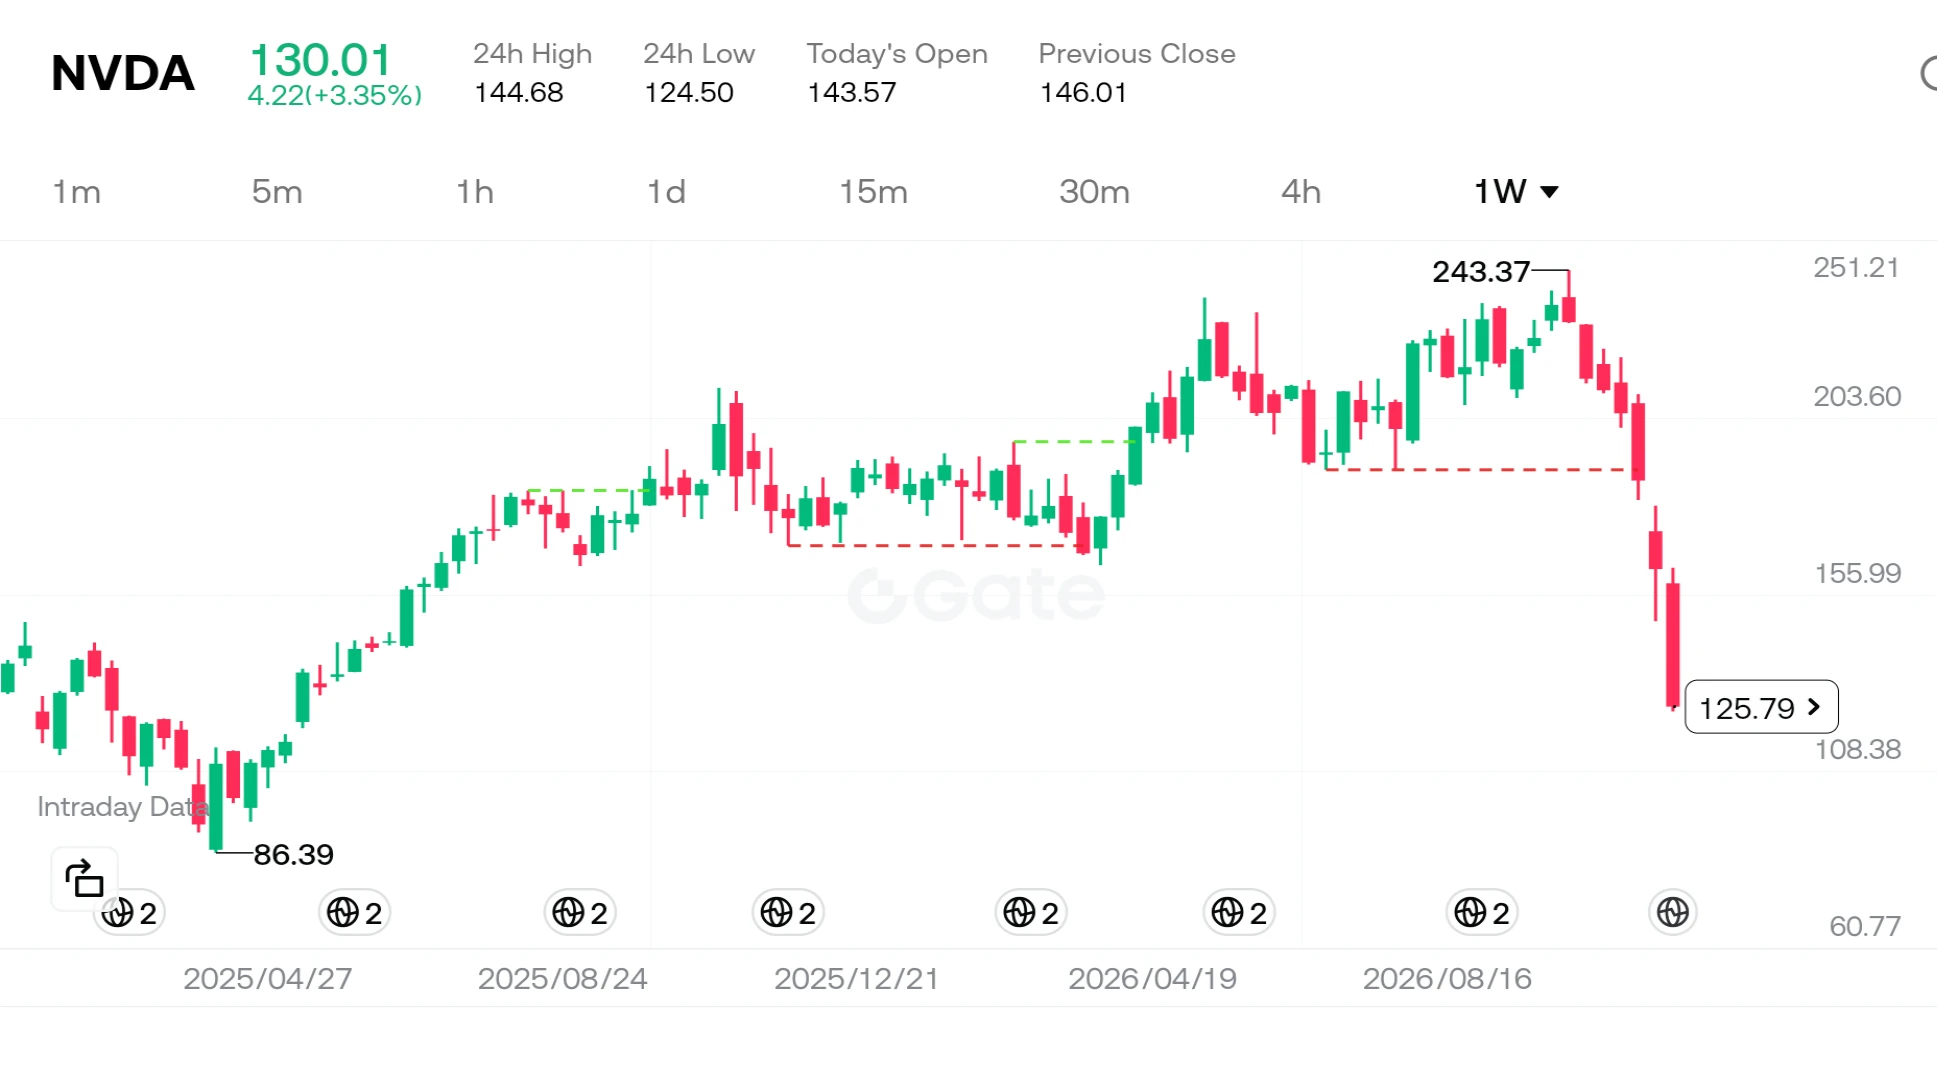
Nvidia shares failed to bring any cheer to investors, slipping to the $130 level in weekend trading. The sharp decline from the stock's peak of $243 can no longer be dismissed as a mere "market correction." The formal investigation launched by the U.S. Securities and Exchange Commission (SEC) into the company’s accounting practices has served as the primary catalyst for this downturn.

So, what does this investigation signify, and why has it shaken the stock price so profoundly?

Looking first at the company itself: as the driving force behind the artificial intelligence revolution, Nvidia has
post-image
User_any
$NVDA ‌
Nvidia has been losing ground for seven consecutive weeks—a trend not seen since 2008. The stock plummeted 14% last Friday alone, bringing its total decline over this seven-week period to approximately 46%. As clearly illustrated on the chart, the price has retreated from a peak of $243 to the $125 range. So, what is the story behind how this once-most-valuable company reached this point?
In reality, this is not merely a stock market correction; it is the result of three major, intersecting storms hitting the same vessel.
First, let’s look at the company’s internal dynamics. Uncertainty within management following a CEO transition, combined with the SEC’s decision to investigate the company’s accounting practices, has severely shaken market confidence. But that is not the whole story. The massive scale of spending on artificial intelligence has led investors to ask: "So much money is being spent—but when will we see a return?"
Meanwhile, macroeconomic headwinds have also shifted. Minutes from the Federal Reserve’s meetings indicate that nearly all officials expect interest rate hikes to continue. A high-interest-rate environment exerts significant pressure on growth stocks, which are valued based on their projected future cash flows. This situation has impacted not only Nvidia but the S&P 500 as well; the index fell 8.6%, marking its worst week since April 2025 and pushing it into correction territory.
Even the major Anthropic IPO that took place last week was not enough to halt this wave of selling. For many analysts, this situation serves as proof that the market is no longer focused on "new narratives," but rather exclusively on "cash flow and profitability." The fact that gold and silver have fallen to their lowest levels in over a year, combined with oil’s decline for the third consecutive week, highlights just how fragile risk appetite has become. Investors have effectively "retreated to their corners."
The most important lesson for individual investors here is that, regardless of how strong a company’s operational performance may be, macroeconomic headwinds and management uncertainties can fundamentally shake its valuation. Nvidia’s core business model remains robust, yet the market is currently pricing in risks rather than the company’s growth story. In times like these, the wisest approach is to avoid leverage and—instead of attempting to call the "bottom"—wait for prices to stabilize.
Do you believe this decline in Nvidia presents a long-term investment opportunity, or are we witnessing the deflation of an artificial intelligence bubble?
#Nvidia #Macro #TechStocks
#ShareWeekly #WCTCS9
Not investment advice.
repost-content-media
NVDA-13.84%
  • 2
  • 2
VVV | Long 🟢 | Bullish | 15-minute, 24-hour: +19.37% | Volume: 78.6M USDT. Long rationale: Price is above EMA200; EMA20/50/200 are in bullish alignment; RSI14 is 71.8; MACD histogram is positive; ADX14 is 39.2; volume is 0.97 times the 20-candle average; trend pullback/continuation. Entry: 24.822 Stop-loss: 23.734 Take-profit 1: 26.1819 | Take-profit 2: 26.9979 | Take-profit 3: 28.0859. Entry levels are for reference only; do not chase prices. The strategy is invalidated if the stop-loss level is hit. This is a technical analysis strategy only and does not constitute financial advice. $VVV
post-image
VVV+0.37%
  • 1
im ready for monday
BRING IT ON
post-image
healthier than the xpl chart
post-image
XPL-0.60%
ELSA | Long 🟢 | Bullish | 15 minutes 24 hours: +0.59% | Volume: 36.4M USDT Long rationale: Price above EMA200; EMA20/50/200 are in bullish alignment; RSI14 is 51.3; MACD histogram is positive; ADX14 is 23.4; volume is 2.87 times the 20-candle average; trend pullback/continuation. Entry: 0.06789 Stop loss: 0.0667006 First target: 0.0693768 | Second target: 0.0702688 | Third target: 0.0714582 For reference only; do not chase the price. Hitting the stop loss invalidates this strategy. Technical analysis strategy only, not investment advice. $ELSA
post-image
ELSA+5.80%
Load More

Join 40 M users in our growing community

⚡️ Join 40 M users in the crypto craze discussion

💬 Engage with your favorite top creators

👍 See what interests you

Trending Topics

BTCBreaksBelow60K

2.1M Views30.1K Discussing

BTC fell below $60,000 on November 20 for the first time since July, alongside a tech stock selloff and broader pressure on risk assets. Will $60K become resistance, or can BTC quickly reclaim it? What price or volume signals would convince you that selling pressure is easing?

GateDirectIPOPhase3ANTAllocates92100Shares

799.8K Views4.9K Discussing

NvidiaDropsNearly14Percent

335K Views7.6K Discussing

View More