

Square
Following
Hot
News
Notifications
Profile
Share your thoughts
placeholder
Article
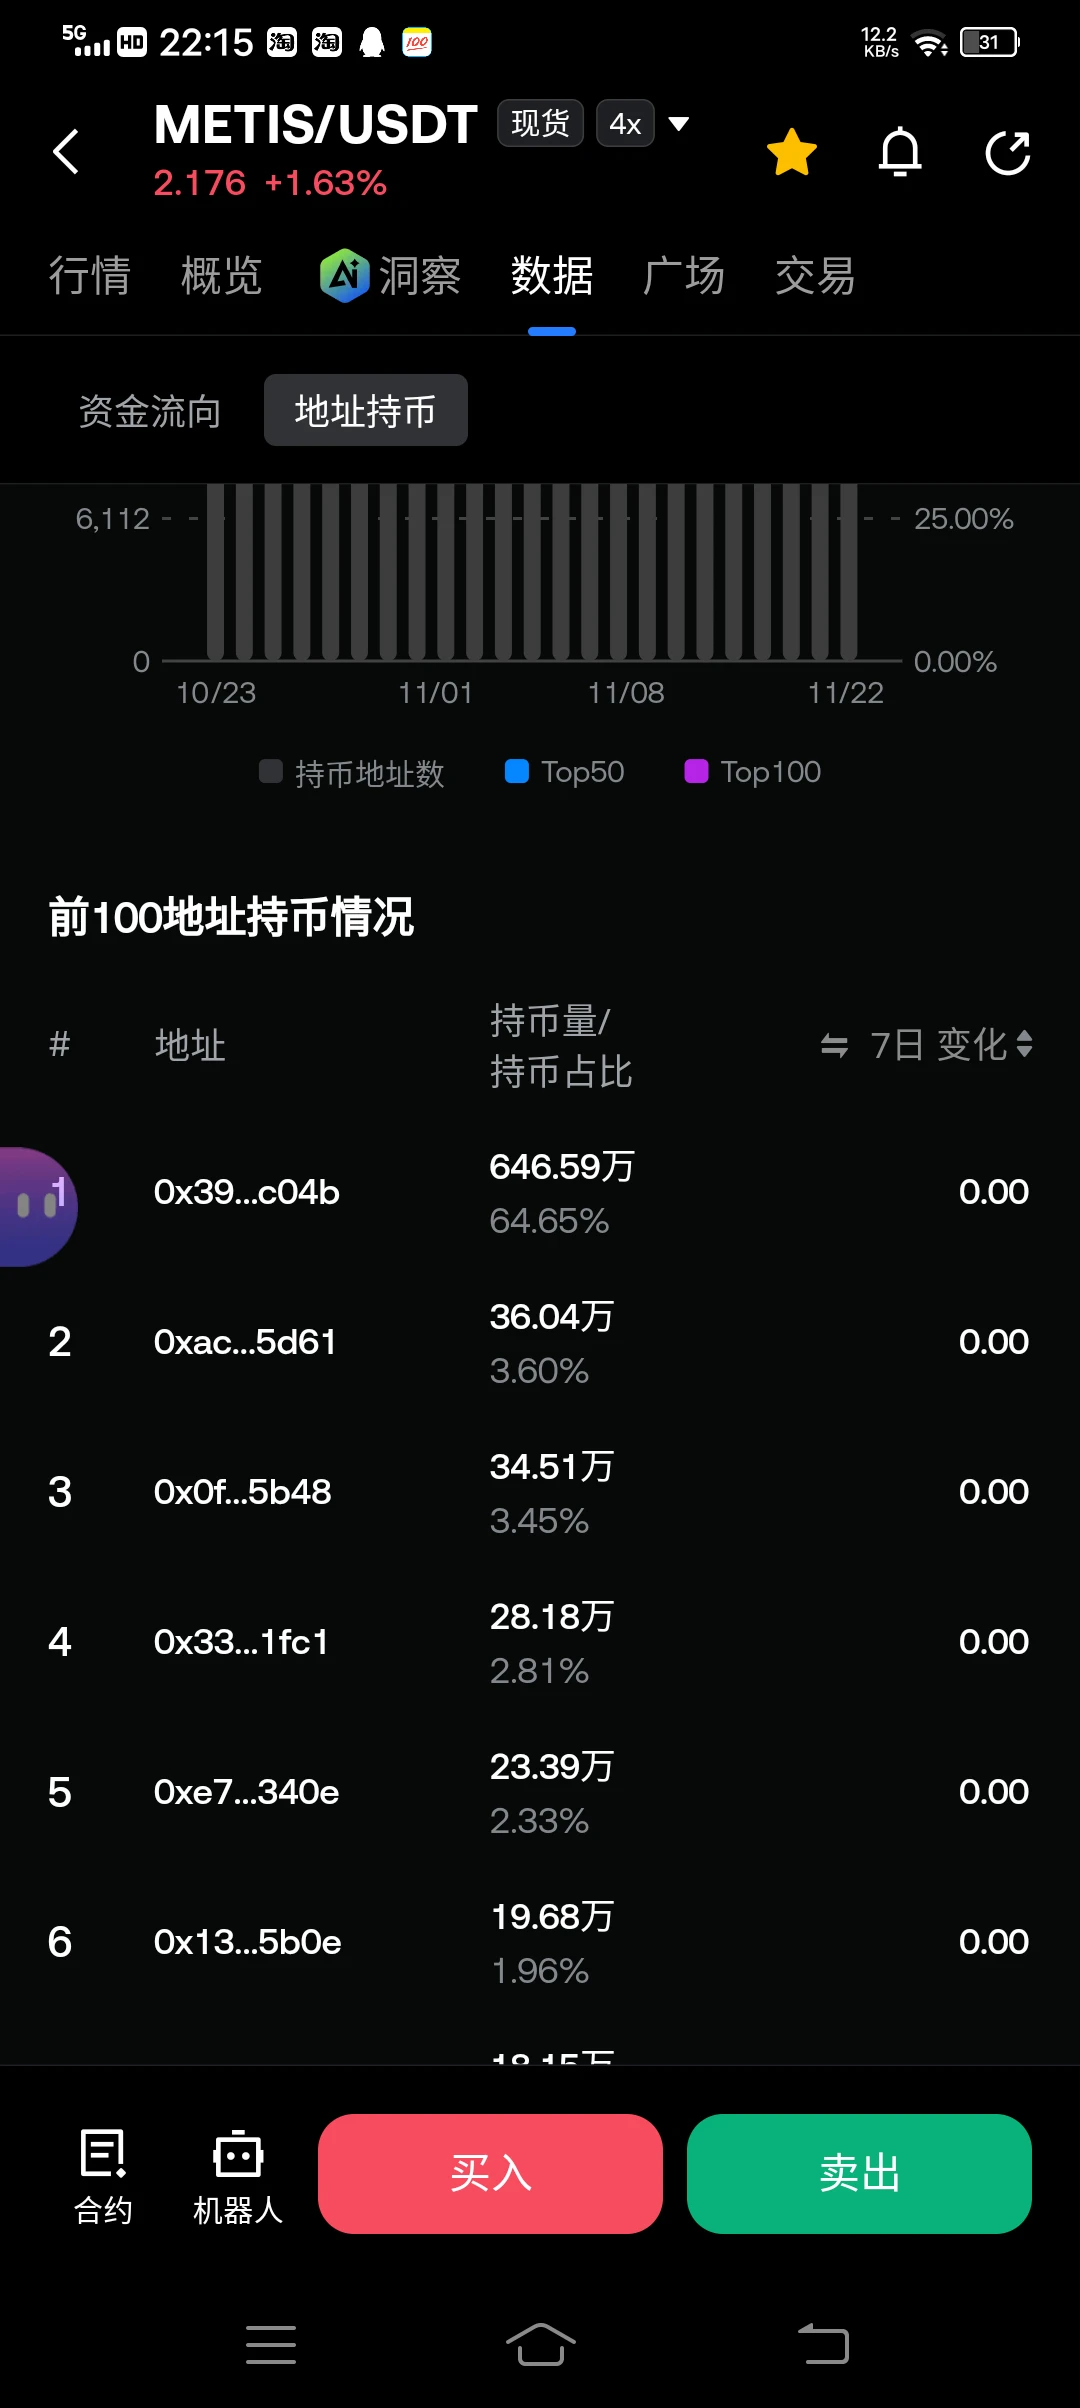
$METIS Are these holder addresses fake?
post-image
METIS-2.89%
Boom!! 💰$EVAA has risen to 3.1700. Keep a close eye on it and lock in your profits. Congratulations to you 🎉🤑💰👇 If it falls below 3.00, it will drop sharply to 2.400. Congratulations to everyone who entered with us 🎉🤑💰
post-image
EVAA-0.49%
Trenches
PIEVERSE
P
bade
b
PIEVERSE
0x0e...25a9
Market Cap
$.
Change
.
24h Vol
$.
Holders
.
IDOL
I
bade
b
IDOL
0x3b...ab07
Market Cap
$.
Change
.
24h Vol
$.
Holders
.
JAGENT
J
bade
b
JAGENT
0x8e...ae15
Market Cap
$.
Change
.
24h Vol
$.
Holders
.
Singularity
S
bade
b
Singularity
7R4M...pump
Market Cap
$.
Change
.
24h Vol
$.
Holders
.
mihao
m
bade
b
mihao
4Cxj...pump
Market Cap
$.
Change
.
24h Vol
$.
Holders
.
evening updates about btc with skyvera
live-cover
LIVE2,291
BTC-0.67%
ETH-1.26%
SOL-0.77%
11/22 BTC:

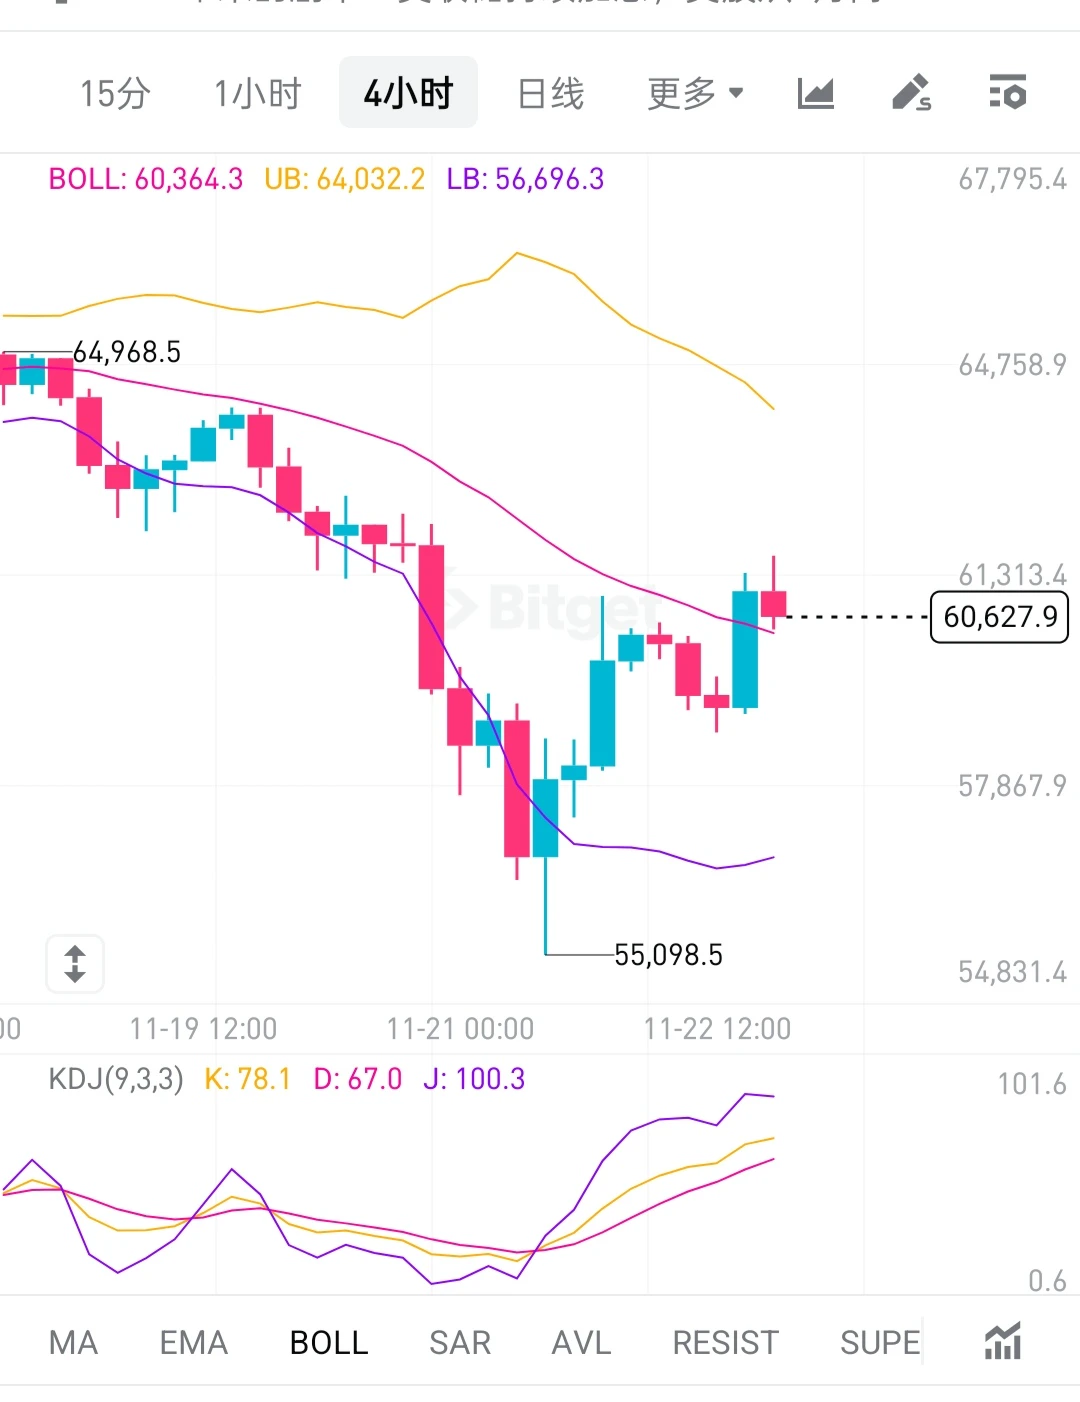
On the 4-hour chart, the current price is near the middle band, with the low touching around 55100. This is a rebound recovery after a sharp drop. The upper band resistance is around 64000, and the lower band support is around 56700. The overall larger structure remains bearish, with the area near the middle band serving as the short-term bull-bear dividing line.
​
KDJ indicator: K is 78.1, D is 67.0, and J is 100.3. It is nearing overbought territory. Short-term rebound momentum is strong, but the price could face resistance and pull back, so chasing the rally is not recommended.
post-image
BTC-0.67%
I specifically target coins that have pumped ridiculously hard to short them · Direction: bearish $PIEVERSE This really broke me—the stop-loss got swept right at the highest wick. The market maker's tactics are simply inhuman. Partially reduced my PIEVERSEUSDT perpetual short position, P&L: -9,613.07 USDT PIEVERSE +17.42% Risk warning: The above is only a record of my personal trades and does not constitute any investment advice. Contract trading carries extremely high risks; please participate with caution.
post-image
PIEVERSE+0.58%
$VVV chart numbers is leaning like the tower of pisa
post-image
VVV-1.61%
#PCEAndGDPDataNextWeek #ShareWeekly

Financial markets are approaching another important macroeconomic event as the United States prepares to release a fresh batch of inflation and economic growth figures on November 25. This time, investors will receive several important indicators together, including October's Personal Consumption Expenditures (PCE) Price Index, the revised third-quarter GDP estimate, personal spending, and durable goods orders.

In my view, this combination deserves particular attention because inflation and economic growth can tell two very different stories about the US
  • 1
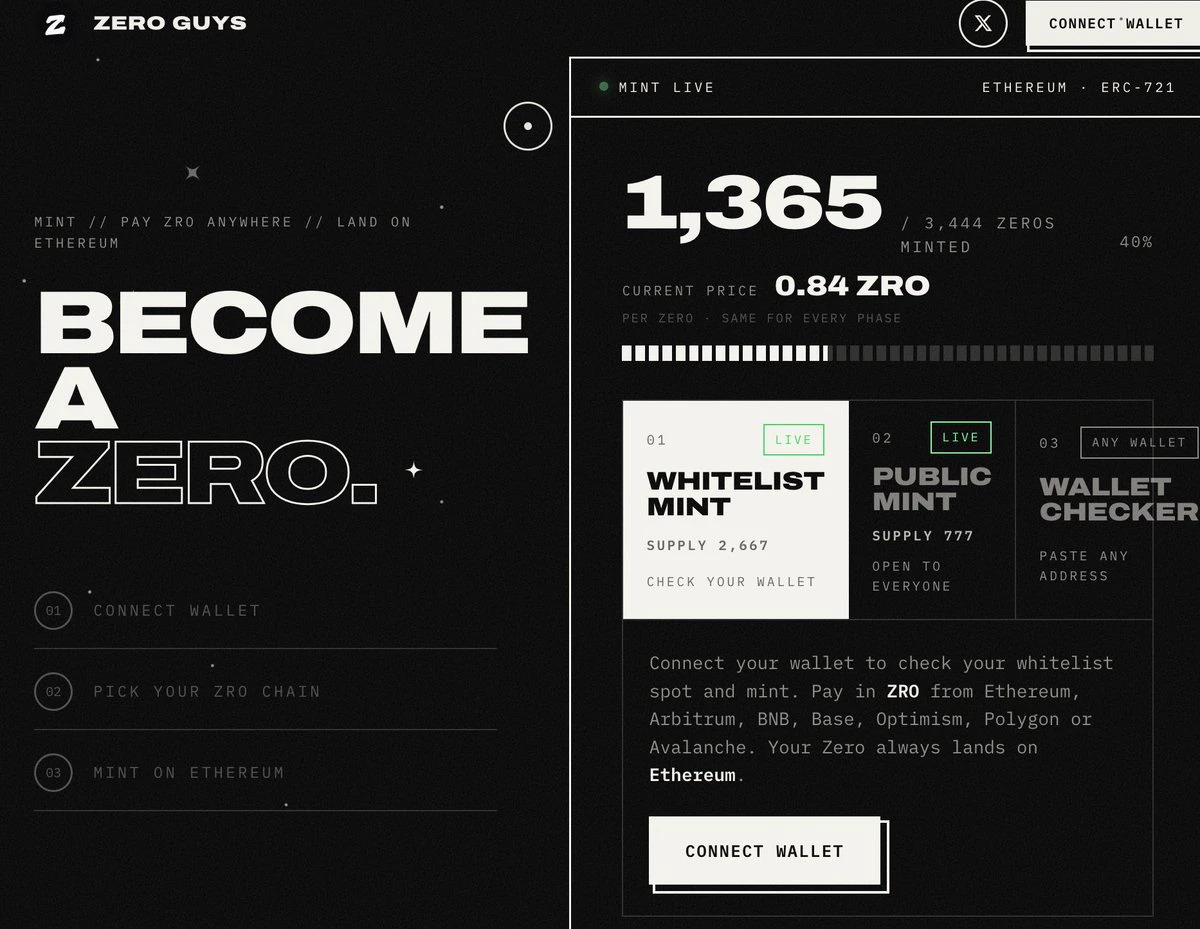
I remember saying before that this shit project looked like zadder🤣
The project team even replied to me afterward. I remember it was supposed to be free, wasn’t it
Why does it now require something worth around $1 $ZRO , and it’s on mainnet too
So it means the snapshot will later be on Zero chain, refer
to the previous kind where you farm first and then get airdropped on the corresponding chain; in the end, it should all be gg
post-image
ZRO-2.59%
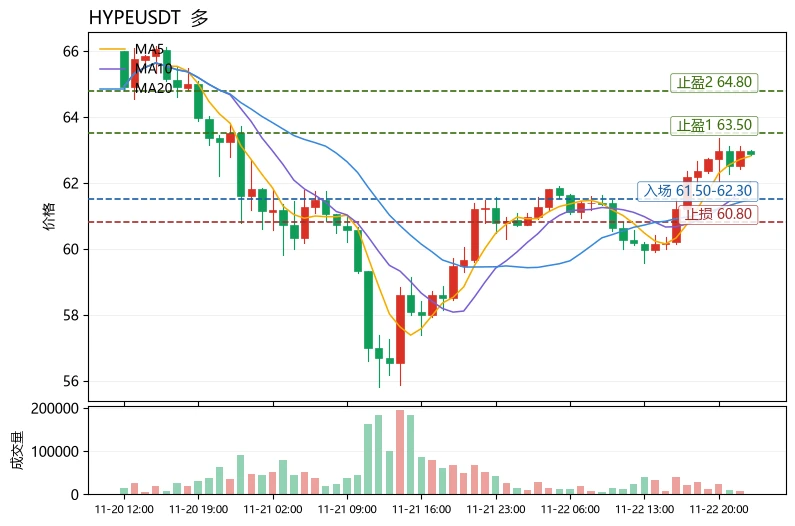
$HYPE Current price: 62.88. The upper Bollinger Band at 63.52 is the first resistance, while MA20 at 61.50 is the short-term bullish defense. A break below 61.50 would invalidate this bullish structure, with the next support at the lower Bollinger Band at 59.48.
Bullish case: MA5 has crossed above MA20, and the MACD histogram at +0.2432 remains bullish. However, RSI at 63.3 is nearing overbought territory, and the price is hugging the upper band, making the risk of chasing higher significant. Volatility-wise, the 30-candle range is about 8.3%, moderately high; no single position should exceed
post-image
HYPE+0.24%
MMT-2.35%
NEAR+1.17%
#ETH
Two possibilities on a weekly basis
Friends, let's discuss both possibilities for Ethereum $ETH .
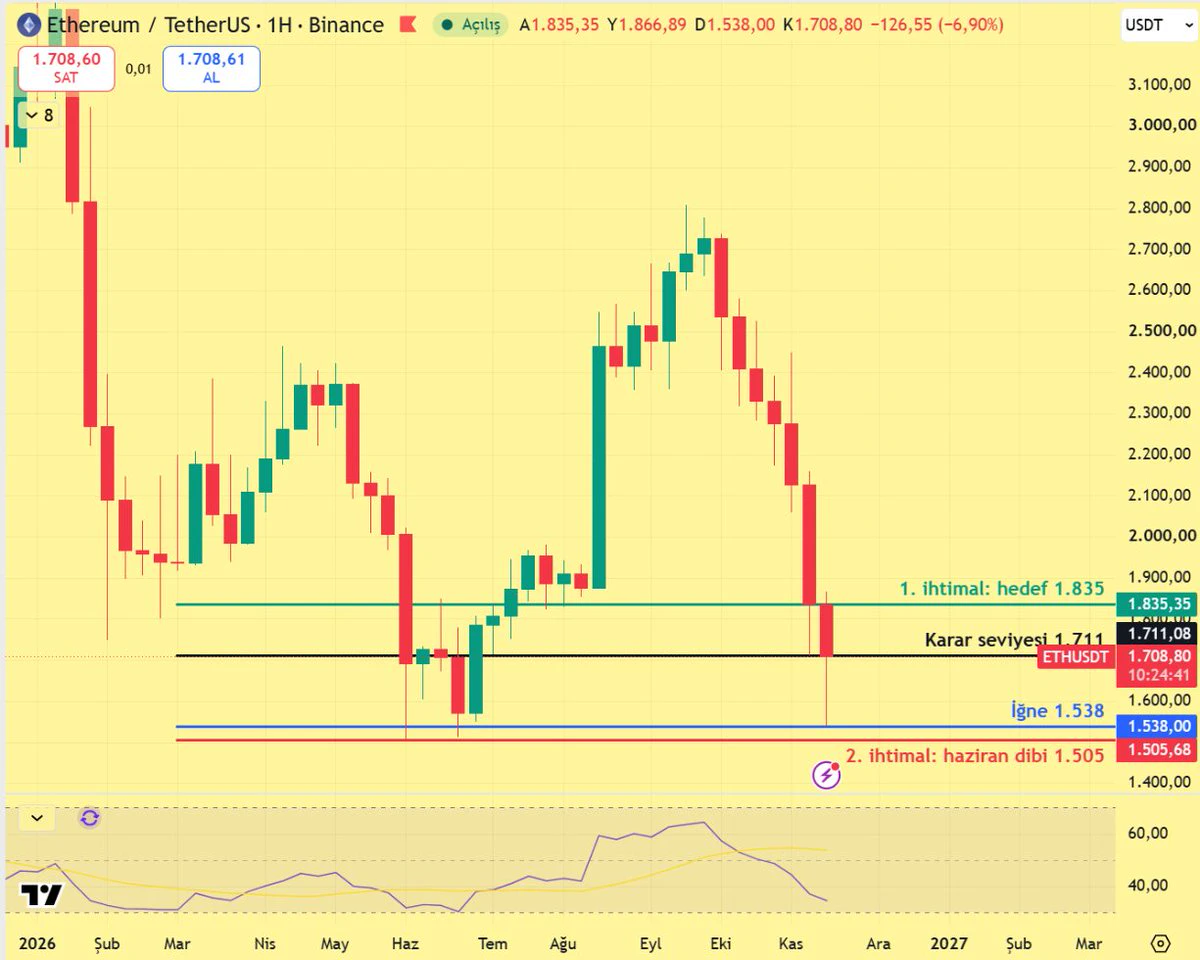
The week opened at 1,835. The price fell to 1,538 on Saturday and recovered to 1,732 today. It rose above last week's low of 1,711 but failed to hold above it, and is currently right around this level.
First possibility: 1,538 remains the low. Since the June low of 1,505 has not been broken, the structure is stronger than Bitcoin's. If the weekly close is above 1,711, the 1,835 level I marked on the chart will be the target. For the Libra reading, the threshold is a weekly close above 1,800.
post-image
ETH-1.26%
  • 1
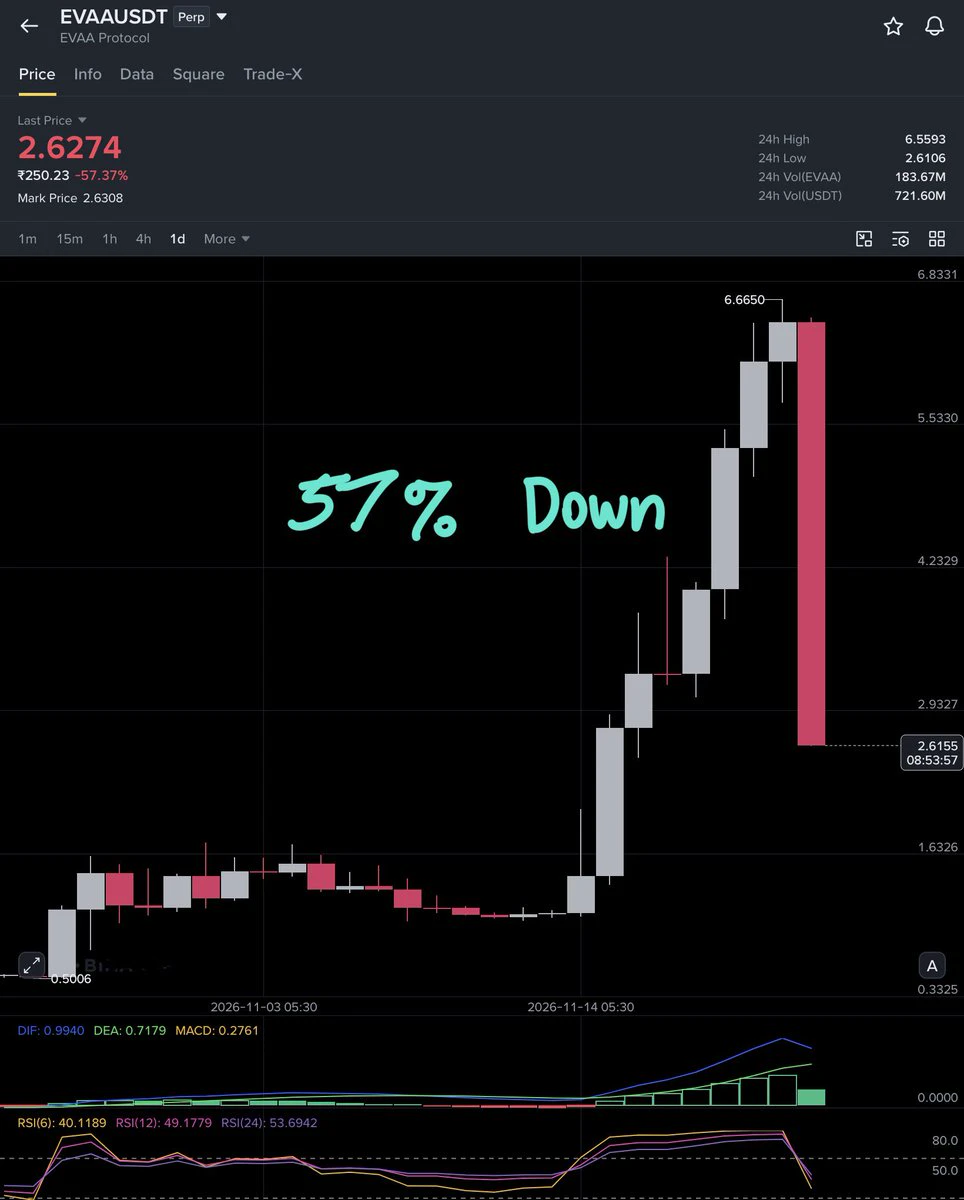
$EVAA bloodbath started 🩸
57% collapsed in 15 hours; we may see the price below $2 soon 😬
post-image
EVAA-0.49%
  • 2
The current ETH/USDT market presents a complex picture when combining on-chain metrics with technical price action.

According to Coinglass data, the order books show a stark asymmetry. There is a large bid concentration near 1650 dollars acting as local support, but significant sell orders are stacked at 1700, 1800, and 1900 dollars. This creates a major barrier for upward movement. Liquidation maps indicate that a move above 1841 dollars could trigger short liquidations, while a drop below 1668 dollars threatens long positions. The funding rate is negative, pointing to bearish sentiment, yet
ETH-1.23%
🚨 The Flare Weekly #2 Newsletter is OUT! ☀️
Can't keep up with everything happening around Flare?
I've summed up this week's biggest news, Flare numbers, and what's next.. all simply explained!
FREE on Substack, every Sunday.
Read it here! 👇
post-image
#USNOVJoblessClaimsBeatExpectations

U.S. November jobless claims have come in better than market expectations, delivering another important signal for traders watching the strength of the American labor market.

A lower-than-expected number of unemployment claims generally suggests that fewer workers are filing for unemployment benefits, which can point toward continued resilience in the labor market. For financial markets, this matters because employment data remains a key factor in shaping expectations around Federal Reserve policy.

A stronger labor market could give policymakers more flex
post-image
BTC-0.67%
#BTC反弹后再争6万美元关口 #黄金逼近3500美元关口 Gold falls below 3600, Bitcoin below 56000—as “safe-haven assets” fail together

Spot gold broke through five round-number thresholds—4000, 3900, 3800, 3700 and 3600—in eight trading days. It has fallen nearly 9% this week and is down about 36% from its record high at the start of the year. On the same day, Bitcoin broke through four thresholds—61000, 60000, 59000 and 58000—with more than 350,000 liquidations across the market in 24 hours. The two “safe-haven assets” were steamrolled at the same time by hawkish signals from the Federal Reserve.

Gold’s fall began
post-image
BTC-0.67%
XAU+0.38%
XAG+0.47%
NDAQ-0.95%
X renowned trader mk4 closed out BTC short positions, capturing nearly $7,000 drop
live-cover
LIVE1,746
BTC-0.67%
$61,668.4, the highest point BTC touched today, was $331.6 short of $62,000—the promise of “getting back above $62,000” hasn’t been fulfilled tonight. Tomorrow is when we’ll find out. #比特币重返62000美元,超跌反弹还是趋势反转

?
The most important thing tomorrow is whether BTC can actually break above $62,000. First, let’s check yesterday’s score: yesterday’s 21:30 post asked, “Can it get back above $60,000?” The answer was yes—it closed at 60,218.5 on the November 21 daily candle, up 2.15%. Today, it briefly fell to 58,767 before climbing back above $60,000 in the evening, with the 20:00 hourly candle peakin
post-image
How do you think BTC is more likely to move tomorrow?
Above 62,000, oversold rebound confirmed
Tapped 62,000 and dropped back again, continuing to grind
Fell back below 60,000; rebound attempt failed
2 Participants
Ends In 22 Hour
BTC-0.67%
NAS100-4.60%
I'm trading on Gate, a top-tier exchange with a 13-year track record. Come join me and dive into the hottest events right now! https://www.gate.com/campaigns/6502?ref_type=132
post-image
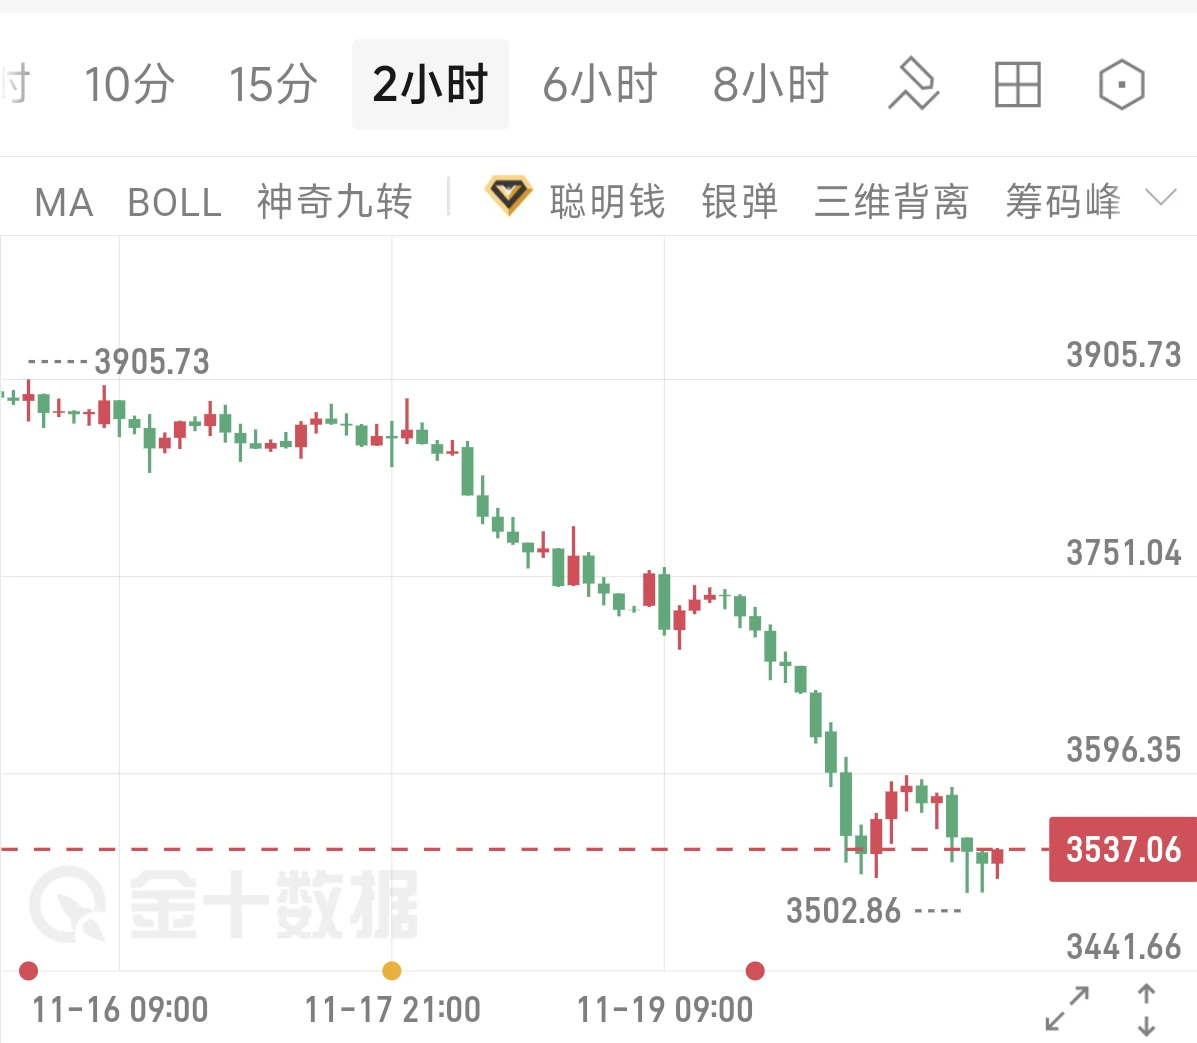
11.22 Gold Strategy: Gold Market Forecast for Next Week: Gold Plunges More Than 400 Points in a Single Week! Can Bears Keep Up the Momentum Next Week?

Gold began a one-way decline this week, facing persistent pressure after falling from a high of 3905. Bears successively broke through multiple key support levels, with the price hitting a new swing low of 3502. It held in a narrow range near the lows at the end of the week, and is currently quoted at 3537. Bears dominated the trend throughout the week, while rebounds by bulls lacked momentum. Bearish sentiment was released in full, and the rec
post-image
XAUT+0.30%
Load More

Join 40 M users in our growing community

⚡️ Join 40 M users in the crypto craze discussion

💬 Engage with your favorite top creators

👍 See what interests you

Trending Topics

BTCReboundFaces60KTest

2.1M Views30.1K Discussing

BTC rebounded from around $55,300 on November 21, briefly reclaiming $60,000 before pulling back to around $59,300. The $60K level is back in focus as traders assess whether the recovery can last. Is this rebound a sign of stabilization or a short-lived recovery? Would reclaiming and holding $60K be enough, or do you need confirmation from trading volume and fund flows?

PCEAndGDPDataNextWeek

259.8K Views2.6K Discussing

GateDirectIPOPhase3ANTAllocates92100Shares

842.8K Views5.1K Discussing
View More