Share your thoughts
placeholder
Article
$dash $ZEN $sui $newr
#privacy matters
#Ukraine
DASH+34.93%
ZEN0.00%
SUI+2.45%
ETH MARKET UPDATES
live-cover
LIVE1,591
$SHENHUA /USDT Perp – "Flatline Chop – Watch"**
**Trading Plan Long $SHENHUA
Entry: 7.055
SL: 7.000
TP1: 7.096
TP2: 7.150
SHENHUA is flatlined on the Bollinger Bands (7.055) with no volume. Enter only if it breaks the 7.055 high, with a stop below the 7.021 support.
post-image
SHENHUA-0.10%
  • 4
Everyone’s chasing the 15m RSI bounce—but the 4h chart just whispered a secret about $LAB /USDT.

$LAB /USDT - SHORT

Trade Plan:
Entry: 0.07577 – 0.07641
SL: 0.08005
TP1: 0.07312
TP2: 0.07114
TP3: 0.06817

Why this setup?
- RSI on 15m is overheated at 68.35—that’s fuel for the next leg down, not up.
- 1D trend is bearish, and price is stalling at 0.07609—right at the 4h supply zone.
- My model’s 80.33 confidence says SHORT. Targets: TP1 0.07312, TP2 0.07114. Stop is tight at 0.08005.
- Why now? The bounce is losing steam exactly where shorts want to reload.

Debate:
Are you fading t
LAB+7.40%
🚀 #Gate60MillionUsers — A Major Milestone for Gate!
The crypto industry is constantly evolving, and strong user growth is one of the clearest signs that a platform is building long-term relevance. Gate has officially surpassed 60 million registered users worldwide, marking another major milestone in its global expansion.
Reaching 60 million users is more than just a number. It reflects the growing demand for a broader financial ecosystem where users can access crypto, Web3, payments, and traditional financial products through one platform.
🌍 Why This Milestone Matters
Gate has continued exp
post-image
RWA-1.00%
NVDA-0.13%
TSLA-4.33%
AAPL-1.61%
AMZN-0.10%
  • 4
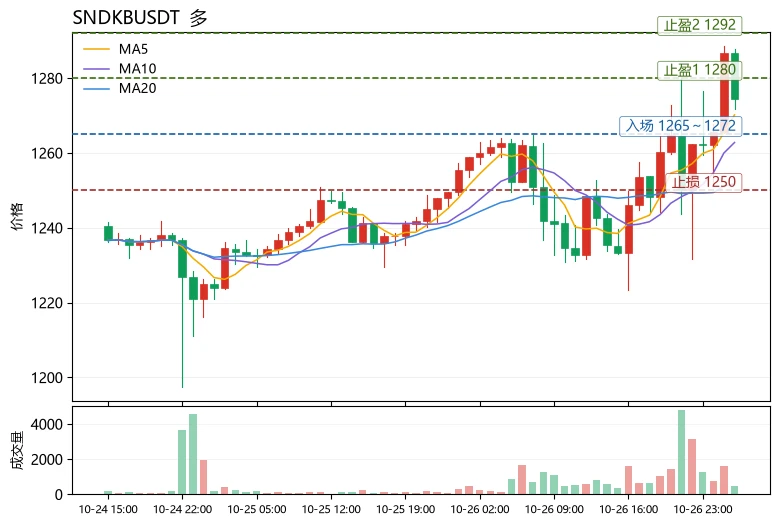
I only meant to test the waters with a small position, but it ended up being a bit underwhelming? No, it delivered a big one! As it repeatedly oscillated intraday, I watched the order book for ages. Every dip held above support, and the volume-price action was actually getting healthier and healthier. My instincts told me this move had potential. I bought the dip during the daytime pullback at 0.00793, and when I opened the app again after lunch, it had already reached 0.00855, sending the return to +191.86%. My account was dancing on its own—I was worried it might fall.

Made the profit fair
post-image
SNDK+11.17%
ADA-3.48%
$ETH Signal】Bearish momentum persists, with key support on the verge of breaking
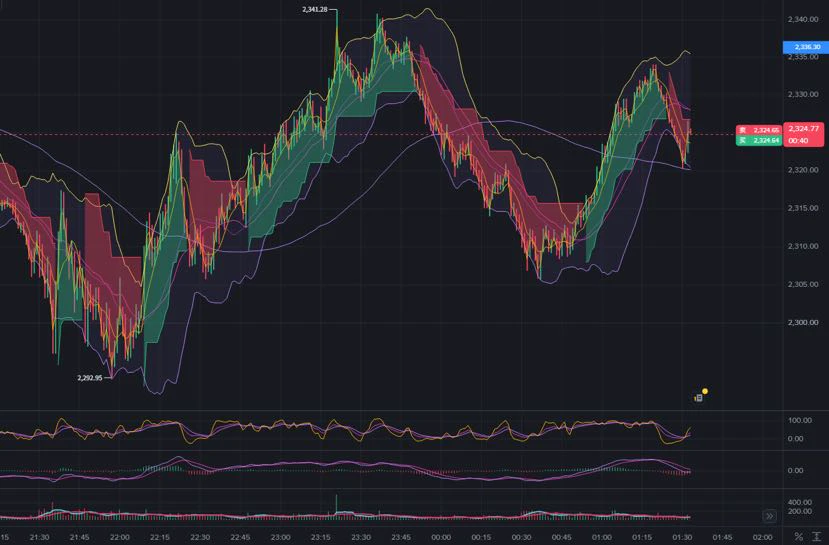
$ETH 1H MACD bearish crossover on declining volume, 4H bearish crossover confirmed, RSI 1H fell to 43.5. The price is clinging just below EMA50, with dense orders around 2451 and limited resistance from buyers. Depth imbalance shows buyers at 55.28%, but the price has failed to hold above the moving average, and the rebound is weak.
🎯Direction: short
⚡Entry/Orders: 2443.6570 - 2451.0100
🛑Stop loss: 2475.5201
🚀Target 1: 2414.2449
🚀Target 2: 2395.8623
🛡️Trade management: - Execution strategy: Reduce the positi
post-image
ETH-1.95%
BTC-1.23%
SOL-1.34%
All I can say is that flomo has really gone downhill.
Even if they couldn't display it properly, they shouldn't have displayed these characters...
If it wants to make money, it has to keep adding all sorts of messy features to attract attention, so it can no longer remain small and elegant.
For example, the AI feature—I’ve already cut it from the note-taking app I made myself.
Because you can have an Agent like Codex do the analysis, which is much more useful than using this app for analysis.
Putting an Agent inside the app is truly the stupidest approach.
post-image
🔷️ K-Line & Structure Analysis of $CYS
​Current Trend: Short-term bearish impulse followed by horizontal range consolidation on the 15-minute timeframe.
​Candle Pattern: Sharp sell-off from 0.2492 down to 0.2368, followed by small-bodied candles (spinning tops/dojis) indicating lower selling pressure and base formation near local support.
​Moving Averages: Price is attempting to reclaim MA5 (0.2391) and MA10 (0.2390). MA30 (0.2422) acts as dynamic overhead resistance.
​Key Support Levels: 0.2368 (Local Support) | 0.2345 (24h Low)
​Key Resistance Levels: 0.2422 (MA30) | 0.2492 (Recent Swing
post-image
CYS-14.32%
Overnight, the world lost its sense of security
At Friday’s close, global markets “suddenly lost their sense of security”:
- U.S. stocks fell across the board, with the Dow Jones Industrial Average down 0.51%, the S&P 500 down 0.38%, and the Nasdaq down 0.29%;
- Gold fell, plunging as low as $4,365 intraday before recovering $4,400;
- U.S. Treasuries fell, with the 10-year Treasury yield closing at 4.78% and the 30-year yield at 5.24%;
- Oil prices edged lower, with U.S. crude briefly falling below $90 intraday before reclaiming that level by the close.
First, Wall Street’s assessment of the n
post-image
Crypto
What price will Bitcoin hit in September?
↑ 80,000
97%1.03x
↓ 77,500
77%1.30x
$488.03K 24H+21 more
SPYX-0.39%
GLDX-1.08%
PAXG-1.09%
$UAI lost the 0.46 support, and the price hit the mentioned support at 0.41–0.42. It is now bouncing back toward the 0.46 resistance.
It is moving like a mountain downhill road. Let’s see if it breaks the current resistance and returns to 0.5, or drops back to the 0.41 support.
post-image
CryptoSat
$UAI is 37% up in the past 24 hours and is being stuck at 51 resistance. If the price climbs it, we could see a 55 to 60 expansion again and a Double Top on the charts 😅
In case the price loses the 46 zone support, it will likely hit 42-41 as the next support. Losing this may trigger the next major support at 33-35.
repost-content-media
UAI+34.93%
  • 1
$TAO The long position has reached the target price of 231, and profits were taken as planned. Patiently wait for the next high-quality entry signal.#美国8月非农超预期 #Gate用户突破6000万
post-image
TAO+2.23%
#USELESSSurgesAnother67%
$USELESS
MOMENTUM IS STILL RUNNING
USELESS has once again become one of the most aggressive momentum stories in the market. After its explosive multi-day rally, the token is now trading around $0.22, following a powerful move that previously pushed price toward the $0.25–$0.28 region. The latest market data shows just how extreme the move has become: USELESS has gained roughly 250%+ over seven days, while 24-hour trading volume has expanded above $200M.
THE BIGGER PICTURE
What makes this setup interesting is that USELESS is not simply experiencing a one-candle pump
Falcon_Official
#USELESSSurgesAnother67%
USELESS is once again proving that small-cap momentum can move extremely fast. Around $0.24, the token has delivered another explosive move of roughly 67%, while the latest market data shows price pushing close to the $0.25 area. The move is especially notable because it follows an already powerful multi-day rally rather than coming after a long period of weakness. Current data also shows roughly $140M+ in 24-hour trading volume, meaning this is not simply a low-liquidity price spike.
From a technical perspective, the chart is extremely bullish but also extremely stretched. The RSI(14) is around 77 on one major technical snapshot, while another calculation has pushed RSI above 90. Either way, the message is similar: momentum is powerful, but buyers are operating in an overbought zone. MACD remains positive and moving averages are aligned bullishly, with the short-term averages sitting well below the current price. This combination confirms that the trend is strong, but it also increases the probability of sharp pullbacks after such a vertical move.
The most important level right now is the $0.25 psychological zone. Price reaching approximately $0.25 means buyers are testing a clean round-number resistance after the huge acceleration. A convincing breakout above $0.25, supported by sustained volume rather than only a quick wick, could open the way toward $0.258 and then the $0.30–$0.31 area. The latter becomes particularly interesting because technical resistance data places a major resistance zone around $0.312.
But there is another side to this chart. After a 67% surge, chasing the candle becomes much riskier than entering during the earlier breakout. The current price is significantly above its short-term averages: the latest technical data places the 5-day SMA near $0.20, the 10-day SMA around $0.19, the 20-day SMA around $0.176, and the 50-day SMA around $0.141. That distance tells us just how aggressively momentum has expanded. Strong trends can remain irrational for longer than expected, but eventually the market often returns to test previous breakout zones.
For me, the key battle is therefore not simply “can USELESS go higher?” but whether $0.20–$0.21 can become a new support zone. If price pulls back and buyers defend this region, it would show that the latest breakout is being accepted rather than completely rejected. Below that, the next meaningful technical area is around $0.176–$0.18, close to the 20-day average. A deeper correction toward the $0.15 area would still leave the broader recent rally intact, but losing that region with heavy selling would weaken the immediate momentum structure. Technical pivot data also identifies approximately $0.1498 as a support level.
The volume picture is equally important. USELESS has recently experienced a dramatic expansion in trading activity alongside its price appreciation. That is generally healthier than a huge move occurring on disappearing liquidity, but high volume can work both ways. If volume continues expanding while price holds above $0.20, it would support the continuation thesis. If volume becomes dominated by sellers around $0.25–$0.26 and price starts producing long upper wicks, that would be an early warning that momentum is becoming exhausted.
So the current setup is bullish trend + extreme momentum + elevated correction risk. The chart does not currently look like a normal slow accumulation; it looks like a momentum phase where candles can move several percentage points very quickly. RSI and ADX are warning that the market is overheated, while MACD and moving averages continue to confirm the underlying bullish trend.
At around $0.24–$0.25, I would watch three zones very closely: $0.25 for breakout confirmation, $0.20–$0.21 for immediate support, and $0.176–$0.18 for deeper trend protection. Above $0.25 with strong volume, $0.258 and then $0.30–$0.31 become the next technical areas to monitor. If $0.20 fails decisively, however, the market could need a cooling-off period before another serious attempt higher.
My technical view: USELESS remains strongly bullish, but after another ~67% surge, the risk/reward is no longer the same as it was at the beginning of the move. The next confirmation matters more than the size of the last candle. **A clean $0.25 breakout could extend the momentum toward $0.30+, while rejection followed by a loss of $0.20 would make a deeper correction increasingly likely.**
@Gate_Square
$USELESS ‌ ‌
repost-content-media
USELESS-5.63%
  • 5
Plunging straight down, gold has nosedived 100 points in a single day—the second wave of the decline!
The fairest thing about the market is that every judgment will ultimately be validated, whether it was the first wave down to 4470 or the positioning ahead of the nonfarm payrolls report. The market has validated them all. (All posts were made public in advance and can be reviewed.)
Those who understand are already counting their money. I’m really not bragging here—there’s simply no need to. Every idea, trade, direction, and target was provided in advance and made public. I can’t bring myself
XAUT-1.02%
In the early period, the bullish and bearish curves alternately took the lead, with intense tug-of-war; after September 4, expectations of a rise to 2600 briefly gained a significant lead before quickly retreating; currently, the probabilities of 2600 and 2300 are very close, while upside expectations for 2700 remain weak.
post-image
$CIG /USDT Perp – "Flatline Chop – Watch"**
**Trading Plan Long $CIG
Entry: 28.15
SL: 28.05
TP1: 28.25
TP2: 28.35
CIG is flatlined on the EMAs (28.14-28.15) with extremely low volume. Enter only if it breaks the 28.15 high, with a tight stop below the 27.74 support.
post-image
CIG+0.97%
  • 9
  • 2
This $LTC long trade has been quite comfortable, but what really gives me peace of mind isn’t the unrealized profit—it’s the act of locking in the gains. After entering around 50.48, the market moved upward amid volatility. There were a few pullbacks along the way, but I judged that as long as it didn’t break below the cost area, the structure remained intact.

When it rose to the first target, I closed 70% as planned and moved the stop-loss on the remaining 20% directly above the entry price. The benefit of this approach is that my mindset completely changes—the remaining position can fluctu
post-image
LTC+4.94%
LAB+7.40%
DOGE-1.76%
Everyone’s staring at $CL /USDT’s 91.05—but the real money is hiding beneath the range’s floor.

$CL /USDT - SHORT

Trade Plan:
Entry: 90.94 – 91.16
SL: 92.09
TP1: 90.27
TP2: 89.75
TP3: 88.97

Why this setup?
Why short now? The 4h signal says SHORT (55% confidence), and we’re stuck in a 1D range—that’s a compression zone. RSI on 15m is 52.68, not overbought, but ATR (0.43) shows volatility is thinning. When ranges tighten, breakouts fake out. Entry sits at 91.05 with TP1 at 90.27—a quick scalp. TP2 at 89.75 is where the range’s lower lip gives way. If 90.94 breaks, momentum shifts fast.

D
CL+0.47%
All winners wallets added. Ty. Mint next
post-image
Market Prediction And Live Trading Signal
live-cover
LIVE1,998
Load More

Join 40 M users in our growing community

⚡️ Join 40 M users in the crypto craze discussion

💬 Engage with your favorite top creators

👍 See what interests you

View More