Square
Following
Hot
News
Notifications
Profile
Share your thoughts
placeholder
Article
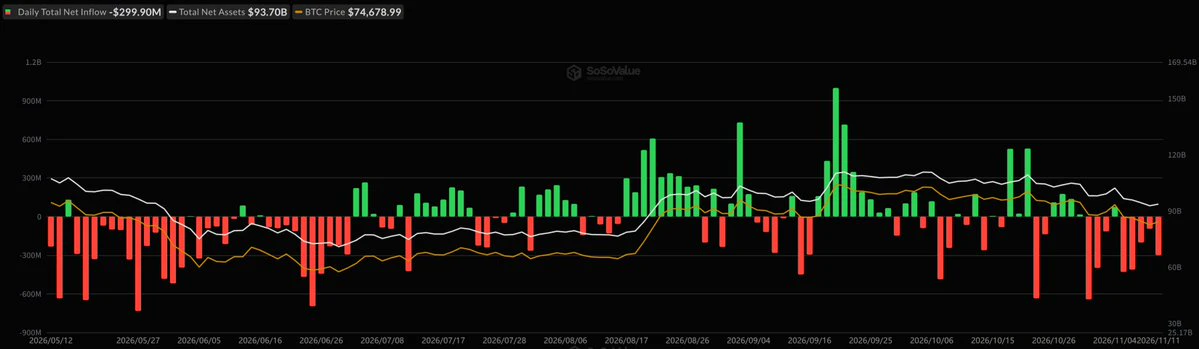
According to SoSoValue data, on November 11 Eastern Time, Bitcoin spot ETFs saw total net outflows of $300 million. The Bitcoin spot ETF with the largest single-day net inflow yesterday was Morgan Stanley ETF MSBT, with a net inflow of $8.9637 million. Ethereum spot ETFs saw total net outflows of $145 million. The Ethereum spot ETF with the largest single-day net outflow yesterday was Blackrock ETF ETHA, with a net outflow of $130 million.
post-image
BTC+1.22%
ETH+1.07%
BTC | ETH | Gold | Crude Oil
live-cover
LIVE6,168
Trenches
Max
M
bade
b
Max
5qaP...pump
Market Cap
$.
Change
.
24h Vol
$.
Holders
.
mihao
m
bade
b
mihao
4Cxj...pump
Market Cap
$.
Change
.
24h Vol
$.
Holders
.
AGT
A
bade
b
AGT
0x5d...e274
Market Cap
$.
Change
.
24h Vol
$.
Holders
.
DacityCoin
D
bade
b
DacityCoin
DKYc...pump
Market Cap
$.
Change
.
24h Vol
$.
Holders
.
Max
M
bade
b
Max
HPSp...h53z
Market Cap
$.
Change
.
24h Vol
$.
Holders
.
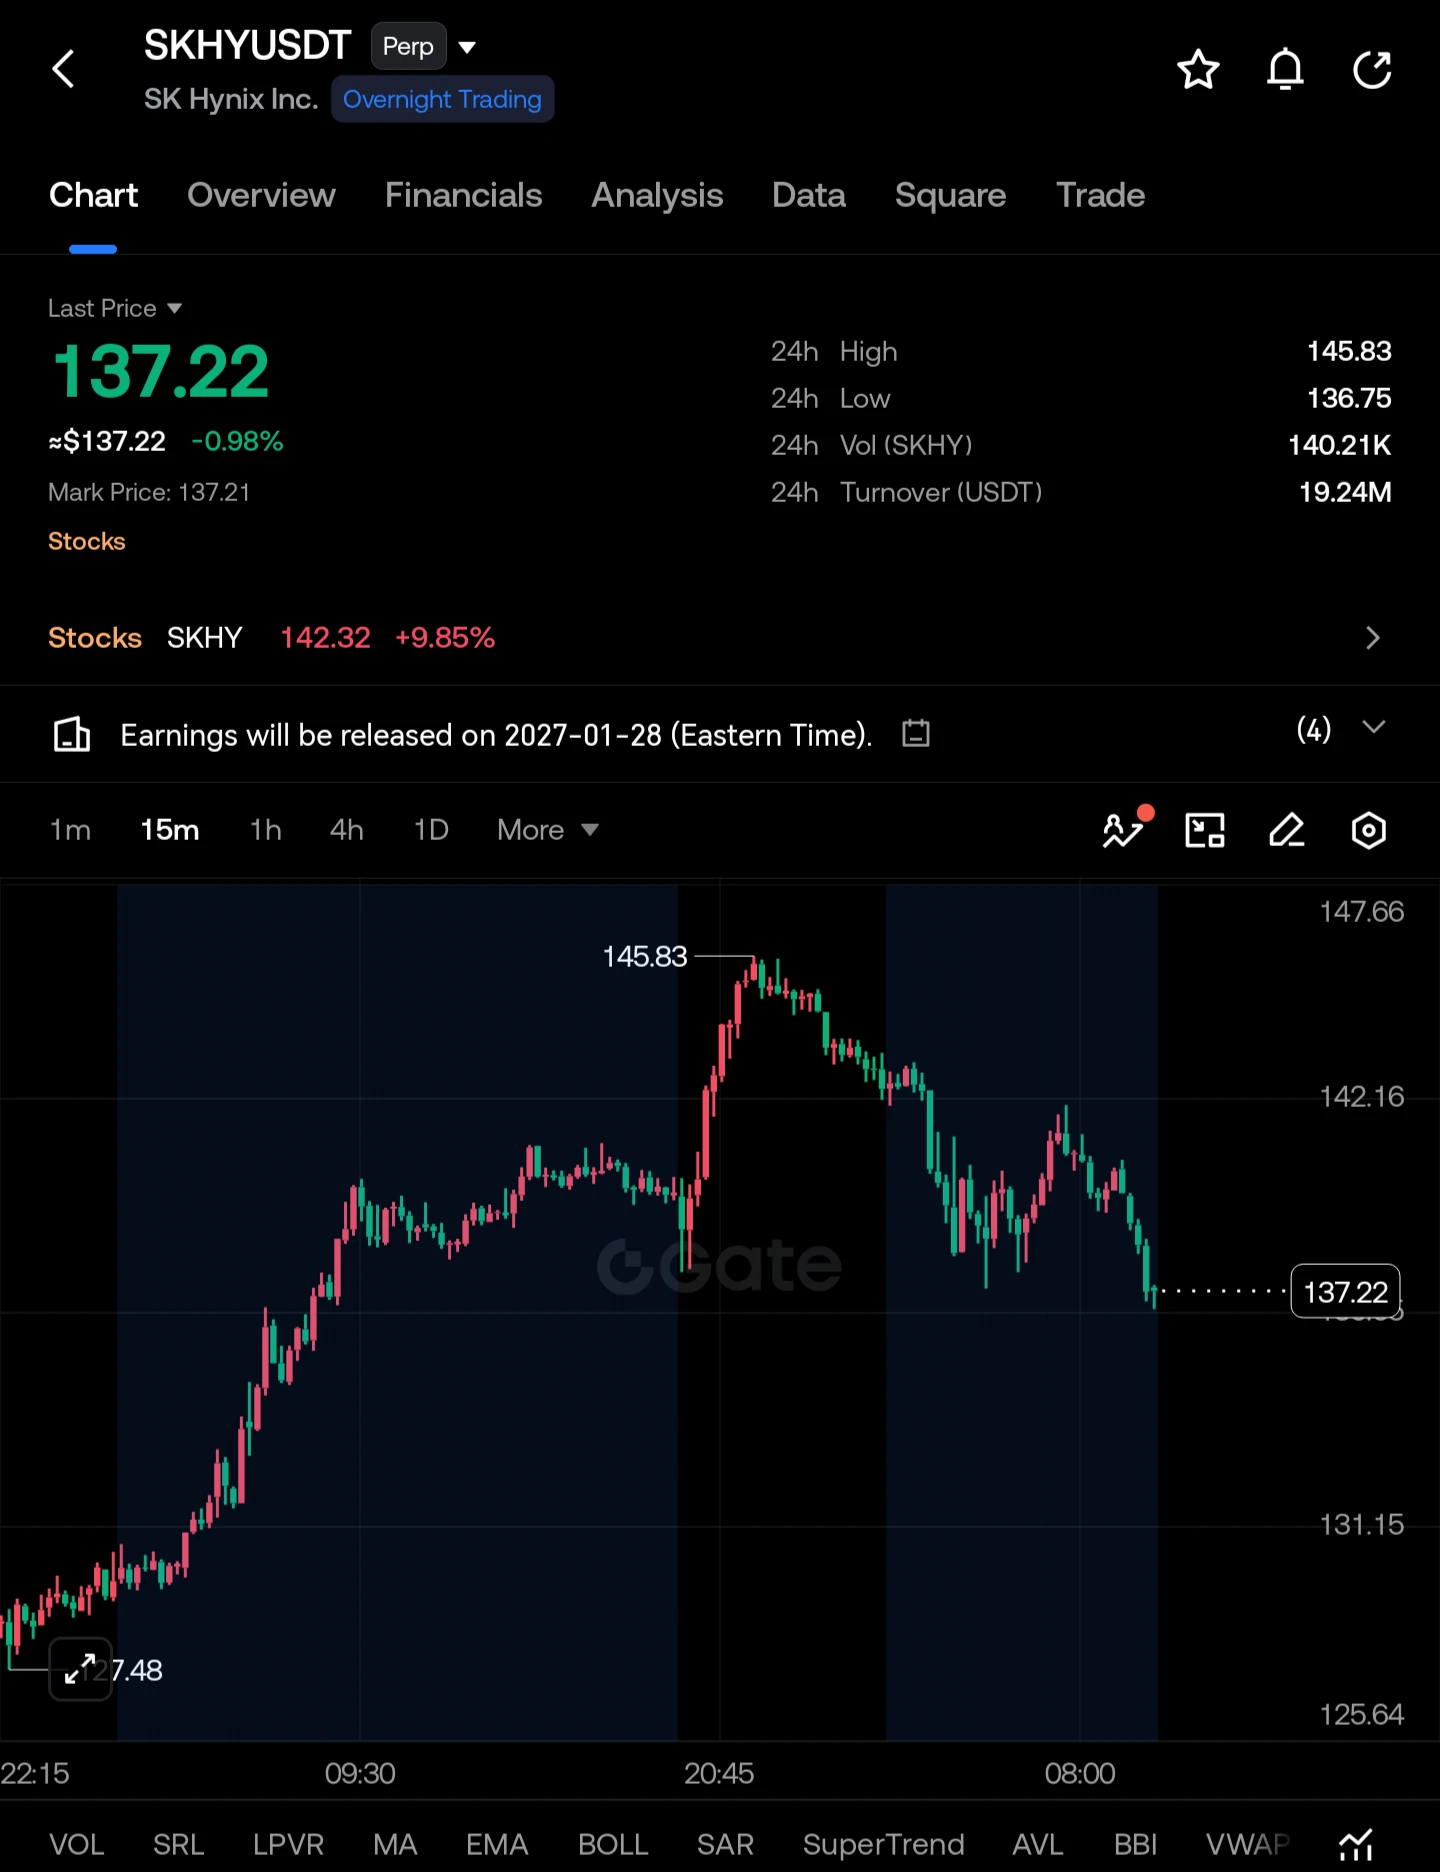
🚨 $SKHY USDT – Sellers Are Taking Control!

I'm watching SKHYUSDT closely because the 15-minute chart is showing a noticeable shift in momentum. After an impressive rally toward $145.83, buyers failed to maintain control, and price has started forming lower highs with increasing selling pressure.

Currently trading around $137.22, SKHY is testing an important support area near $136.75. If sellers break this level convincingly, we could see another downside leg. I'm keeping a SHORT setup on watch, but confirmation is key.

🔴 SHORT TRADE SETUP

Entry Level: $137.20 – $138.20

TP1: $136.00

TP2
post-image
SKHY+0.86%
  • 1
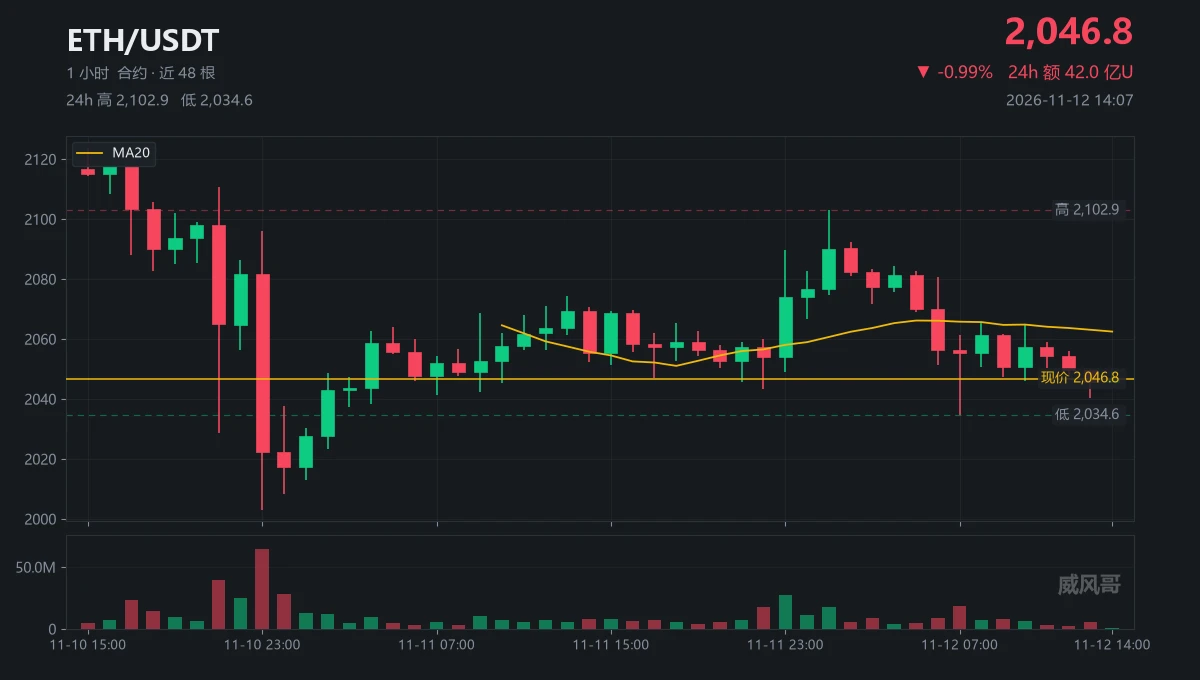
$4.197 billion in 24 hours.
$ETH yielded a range of just 3.25%, or $68.30.

Every $1 move was backed by $61.4 million in trading volume.
The first time I calculated this, I thought I’d misplaced the decimal point.

The 7 o’clock candle had 18.35 million contracts, twice the average volume, and a low of 2034.59.
It closed at 2055.21, with a $20.60 lower wick; the next seven candles never retested that low.
But the highs kept stepping down: 2065.45, 2064.56, 2059.15.
Then lower still: 2056.0, 2049.38, down $16 over six hours.

The top is 2065.45, the bottom is 2034.59, with $30.86 in between.
T
post-image
ETH-1.23%
  • 5
  • 1
#Analysis

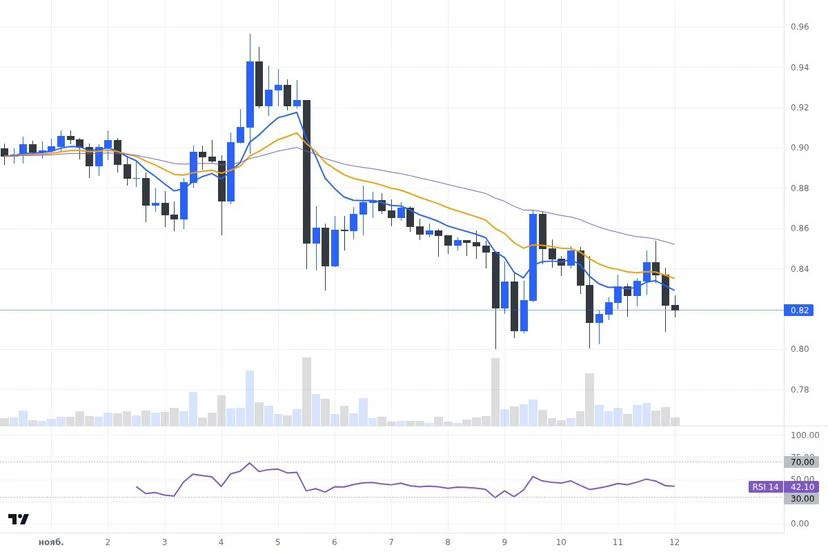
#SUI Price below moving averages, trading quieter than usual

The current outlook for SUI is negative: the price of $0.8195 is below the EMA 20 ($0.83505) and EMA 50 ($0.85285) on the four-hour chart. The short-term average is also below the long-term average, while the RSI 14 on the same chart is 36.6. This combination points to price weakness, not readiness for a reversal.

At the same time, the volume of the latest closed four-hour candle is below the average volume of the previous twenty candles. This is an important detail: the weak price position is not accompanied by increase
post-image
SUI-1.05%
  • 1
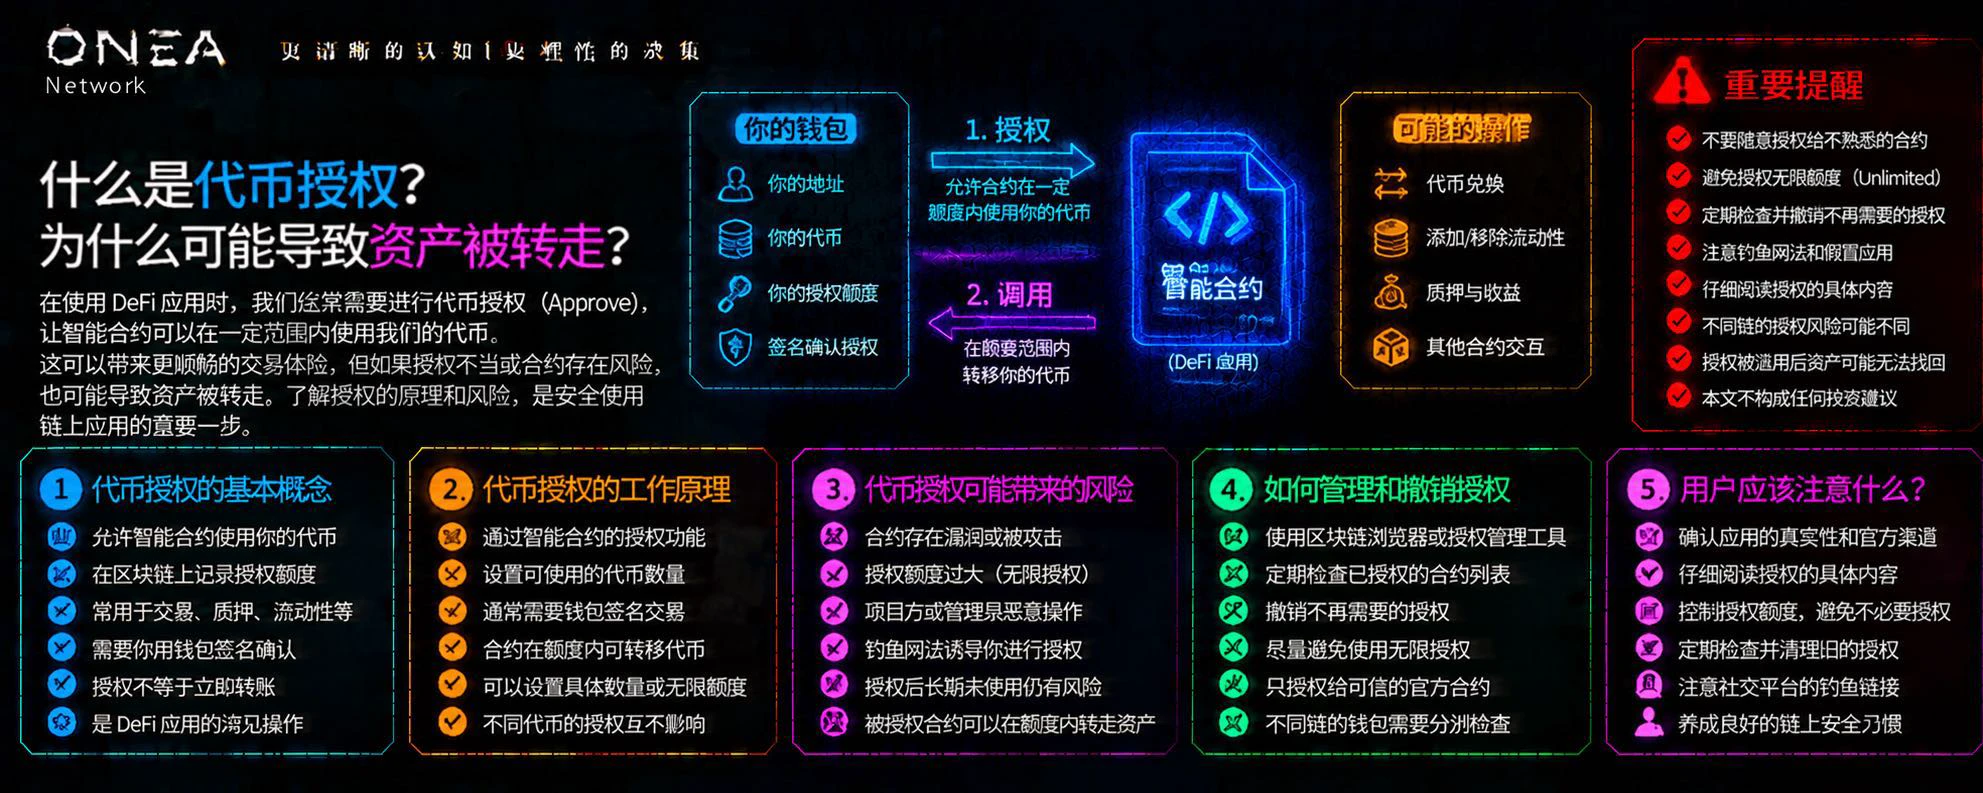
What Is Token Approval? Why Can a Single Signature Put Your Assets at Long-Term Risk?

In the DeFi world, you may just want to swap tokens once, provide liquidity once, or use a new decentralized application.

During the process, your wallet may ask you to confirm an approval transaction.

Many people see a familiar token name and what looks like a normal operation, and click confirm right away. But the questions that really matter are: Who are you authorizing? How many tokens can they use? Will this permission remain in effect after the transaction is complete?

Understanding these three ques
post-image
TOKEN-0.16%
Cracks in the US Labor Market? Jobless Claims Data Due Tonight—Will Recession Alarms Sound?

One of the most important pillars of the US economy is the labor market.
As long as employment remains stable and people have income, they can keep spending, giving businesses more incentive to invest and hire. But if unemployment continues to rise, consumer confidence could take a hit, and economic growth could come under pressure.
The US weekly initial jobless claims report is due tonight, and the market will use it to assess whether the labor market is showing new signs of change.
If initial claims
NAS100-0.82%
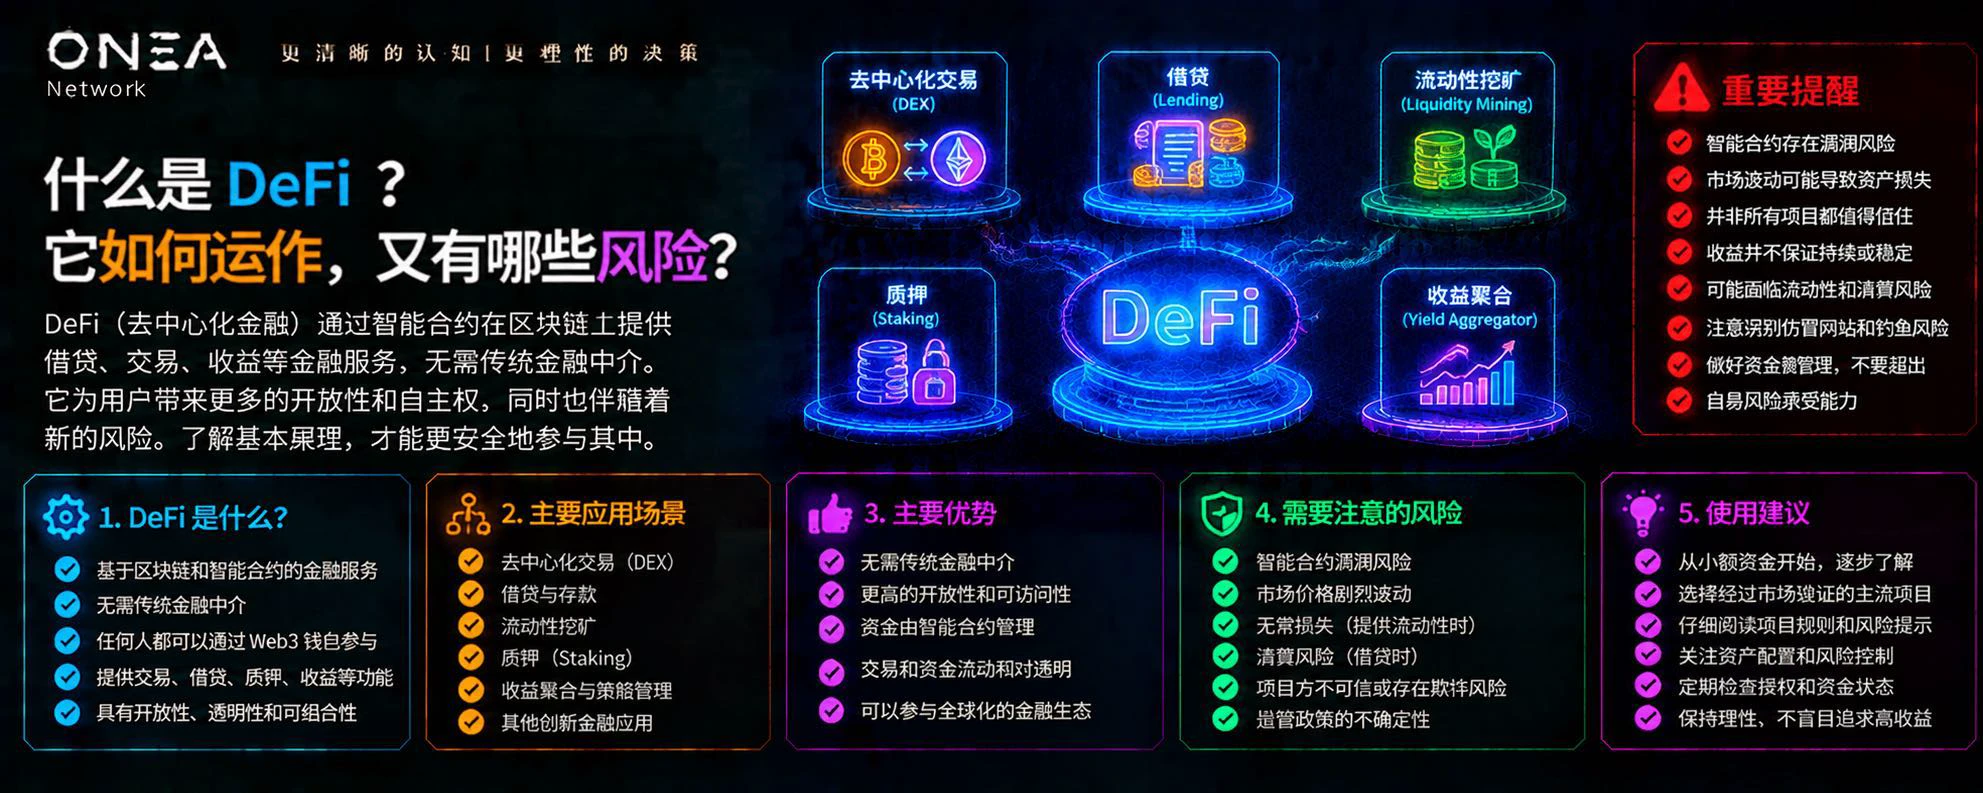
💰 Where do DeFi yields actually come from?

Liquidity mining, crypto lending, and staking all appear to generate yields, but the mechanisms behind them are completely different.

🔹 Liquidity mining: Yields may come from trading fees and protocol rewards.

🔹 Lending: Yields are usually tied to borrowing demand and interest rate mechanisms.

🔹 Staking: Rewards are usually tied to a blockchain’s validation and consensus mechanisms.

⚠️ A high annualized yield does not mean high returns, much less low risk. Smart contract vulnerabilities, falling token prices, and insufficient liquidity can al
post-image
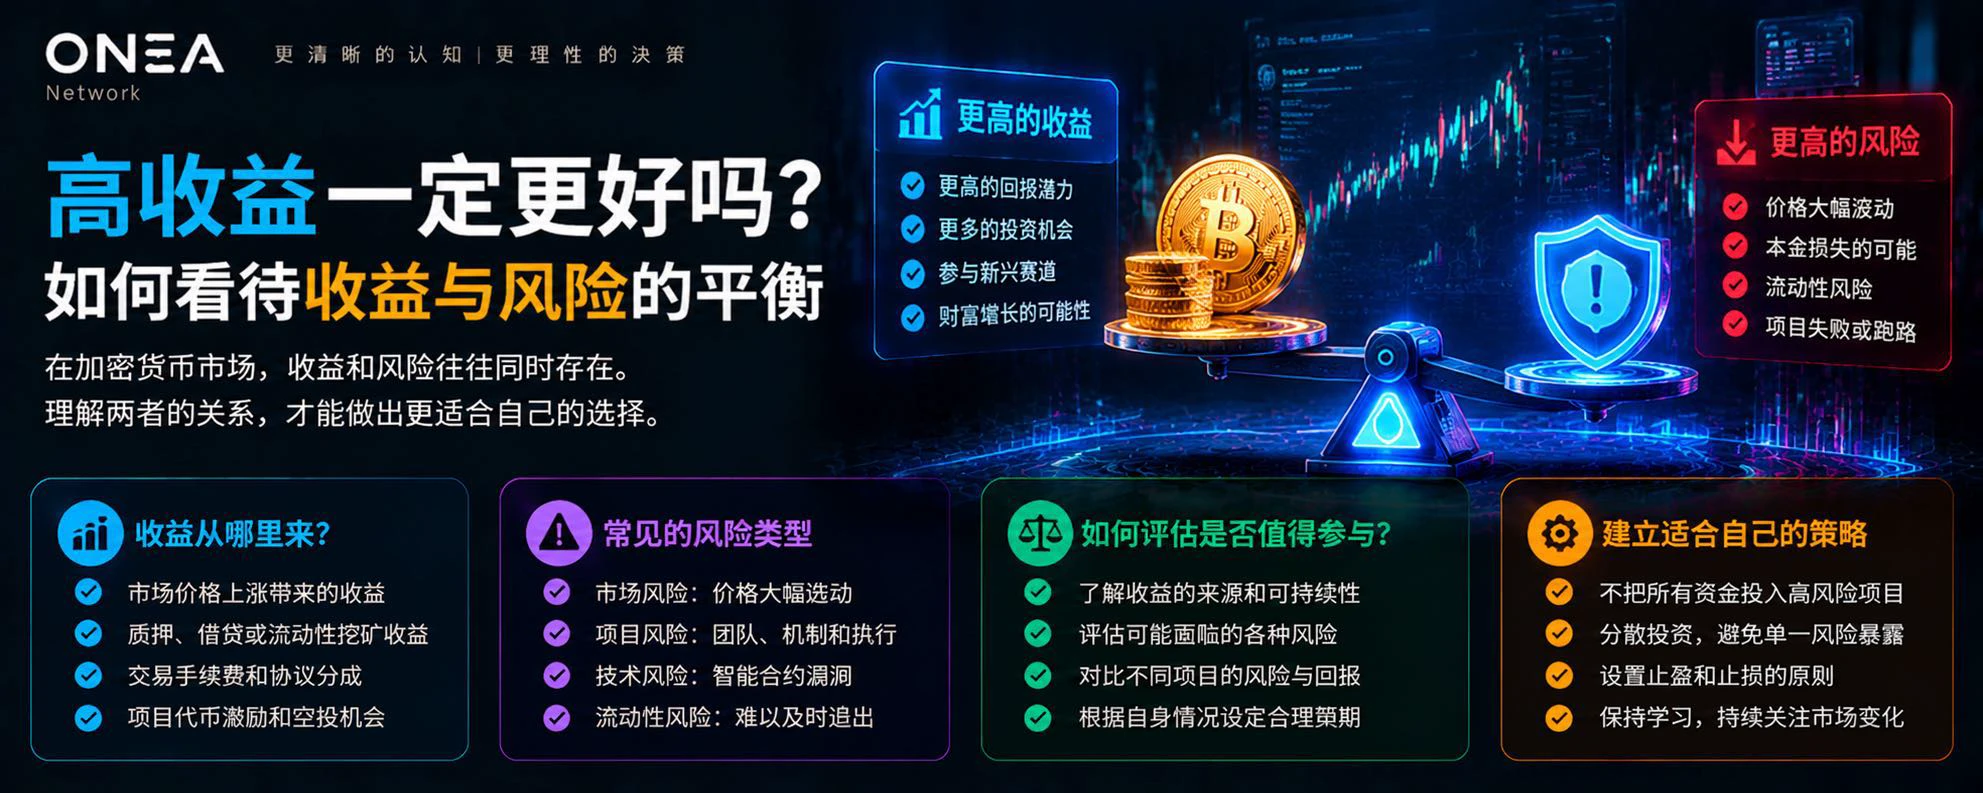
Are Higher Returns Always Better? How to Think About the Balance Between Returns and Risk

In the cryptocurrency market, we often come across all kinds of tempting opportunities: high annualized returns, staking rewards, liquidity mining, and new projects that seem to have enormous growth potential.

But there is a question worth considering carefully:

If two investment opportunities have different expected returns, how should we decide which one deserves more attention?

The answer is not simply to choose the one with the higher returns. Returns are only one part of an investment decision. R
post-image
🔹Rising Inflation Sends Treasury Yields Surging! The 2-Year Treasury Yield Posts Its Biggest Single
live-cover
LIVE2,162
BTC’s daily chart has broken down into a one-way decline, with the price falling below the lower Bollinger Band and strong bearish pressure. KDJ is extremely oversold, but in a one-way market, oversold does not mean a bottom; a sustained slow decline is possible. MACD bearish momentum is still being released. After bottoming, the 4-hour chart saw a slight rebound, then retreated under resistance at the middle band. Rebound momentum is weak, forming a continuation pattern with insufficient rebound strength. The overall market environment remains weak.
🉑 Short near 74300 on a rebound, add at 74
post-image
BTC-0.65%
ETH-1.23%
The AI arms race among tech giants is escalating! After pouring in 100 billion, is it finally time to make money?

Tech giants’ investments in AI are no longer small-scale efforts, but a long-term race spanning chips, data centers, cloud computing, and software ecosystems.
Building data centers takes money, buying chips takes money, and training models takes money too. So the question is: with so much invested, when will they recoup the costs?
That is exactly what the market cares most about as AI commercialization enters the payoff phase.
Tech companies are trying to turn their technological
SPCX-2.32%
The Higher Inflation Gets, the Further Away Rate Cuts Become? U.S. PPI Is Released Tonight, and Crypto Bulls and Bears Are Ready for Battle!

On November 13, the U.S. October PPI is set to be released, and crypto bulls and bears may be in for another psychological showdown.
What are bulls hoping to see? Of course, cooling producer-price inflation, giving the market reason to expect the Fed to adopt a more accommodative policy in the future.
What are bears hoping to see? Naturally, PPI coming in above expectations again, making the market worry anew that high interest rates could last longer.
T
SPCX-2.32%
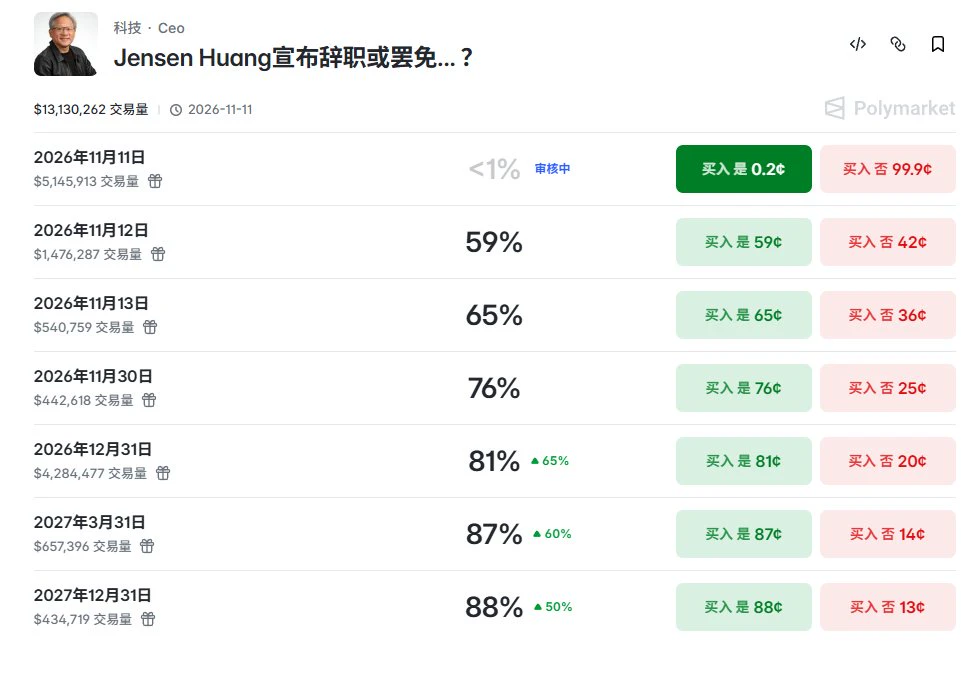
The on-chain odds of Jensen Huang being ousted before the end of the year are over 80%. Smart money must have information ordinary people can’t access. Would you dare to buy the dip?
#JensenHuangAffair
post-image
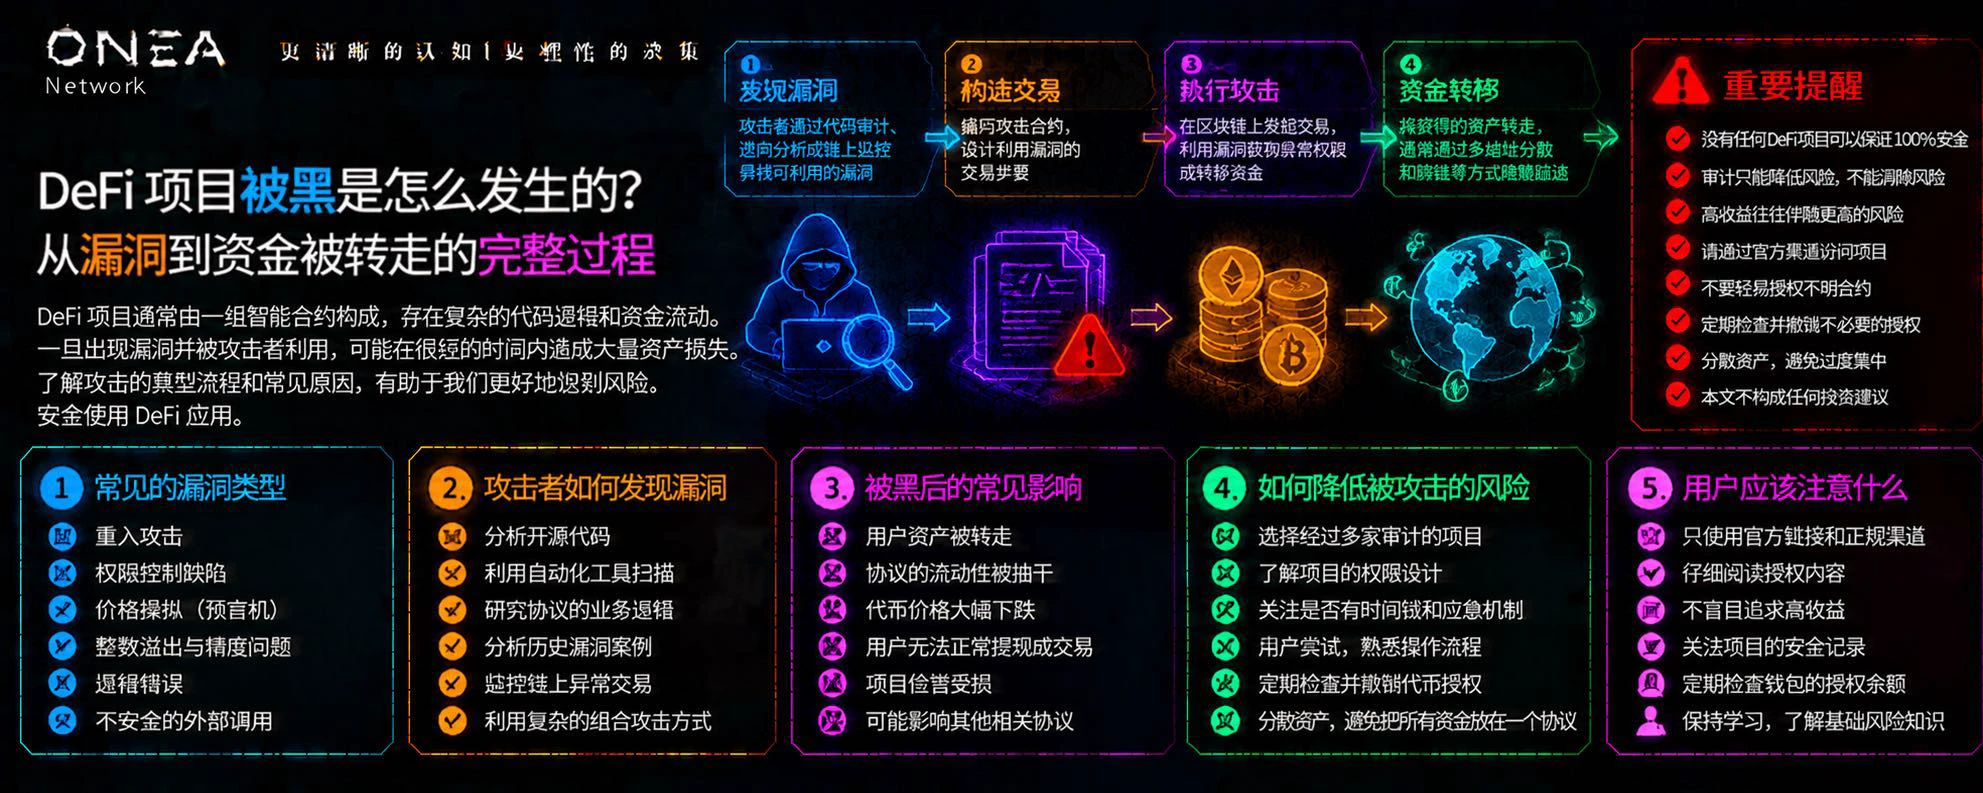
Why Do DeFi Projects Get Hacked? What Happens Between a Vulnerability and Funds Being Drained?

A DeFi project may have publicly available smart contracts, a polished interface, an active community, and even a security audit.

But none of these things mean it is completely safe.

In the Web3 world, security incidents are often caused by more than one issue. Code flaws, permission design, price data, external dependencies, and human actions can all become points of entry for risk.

More importantly, when a localized vulnerability combines with mechanisms for moving funds, what seems like a mino
post-image
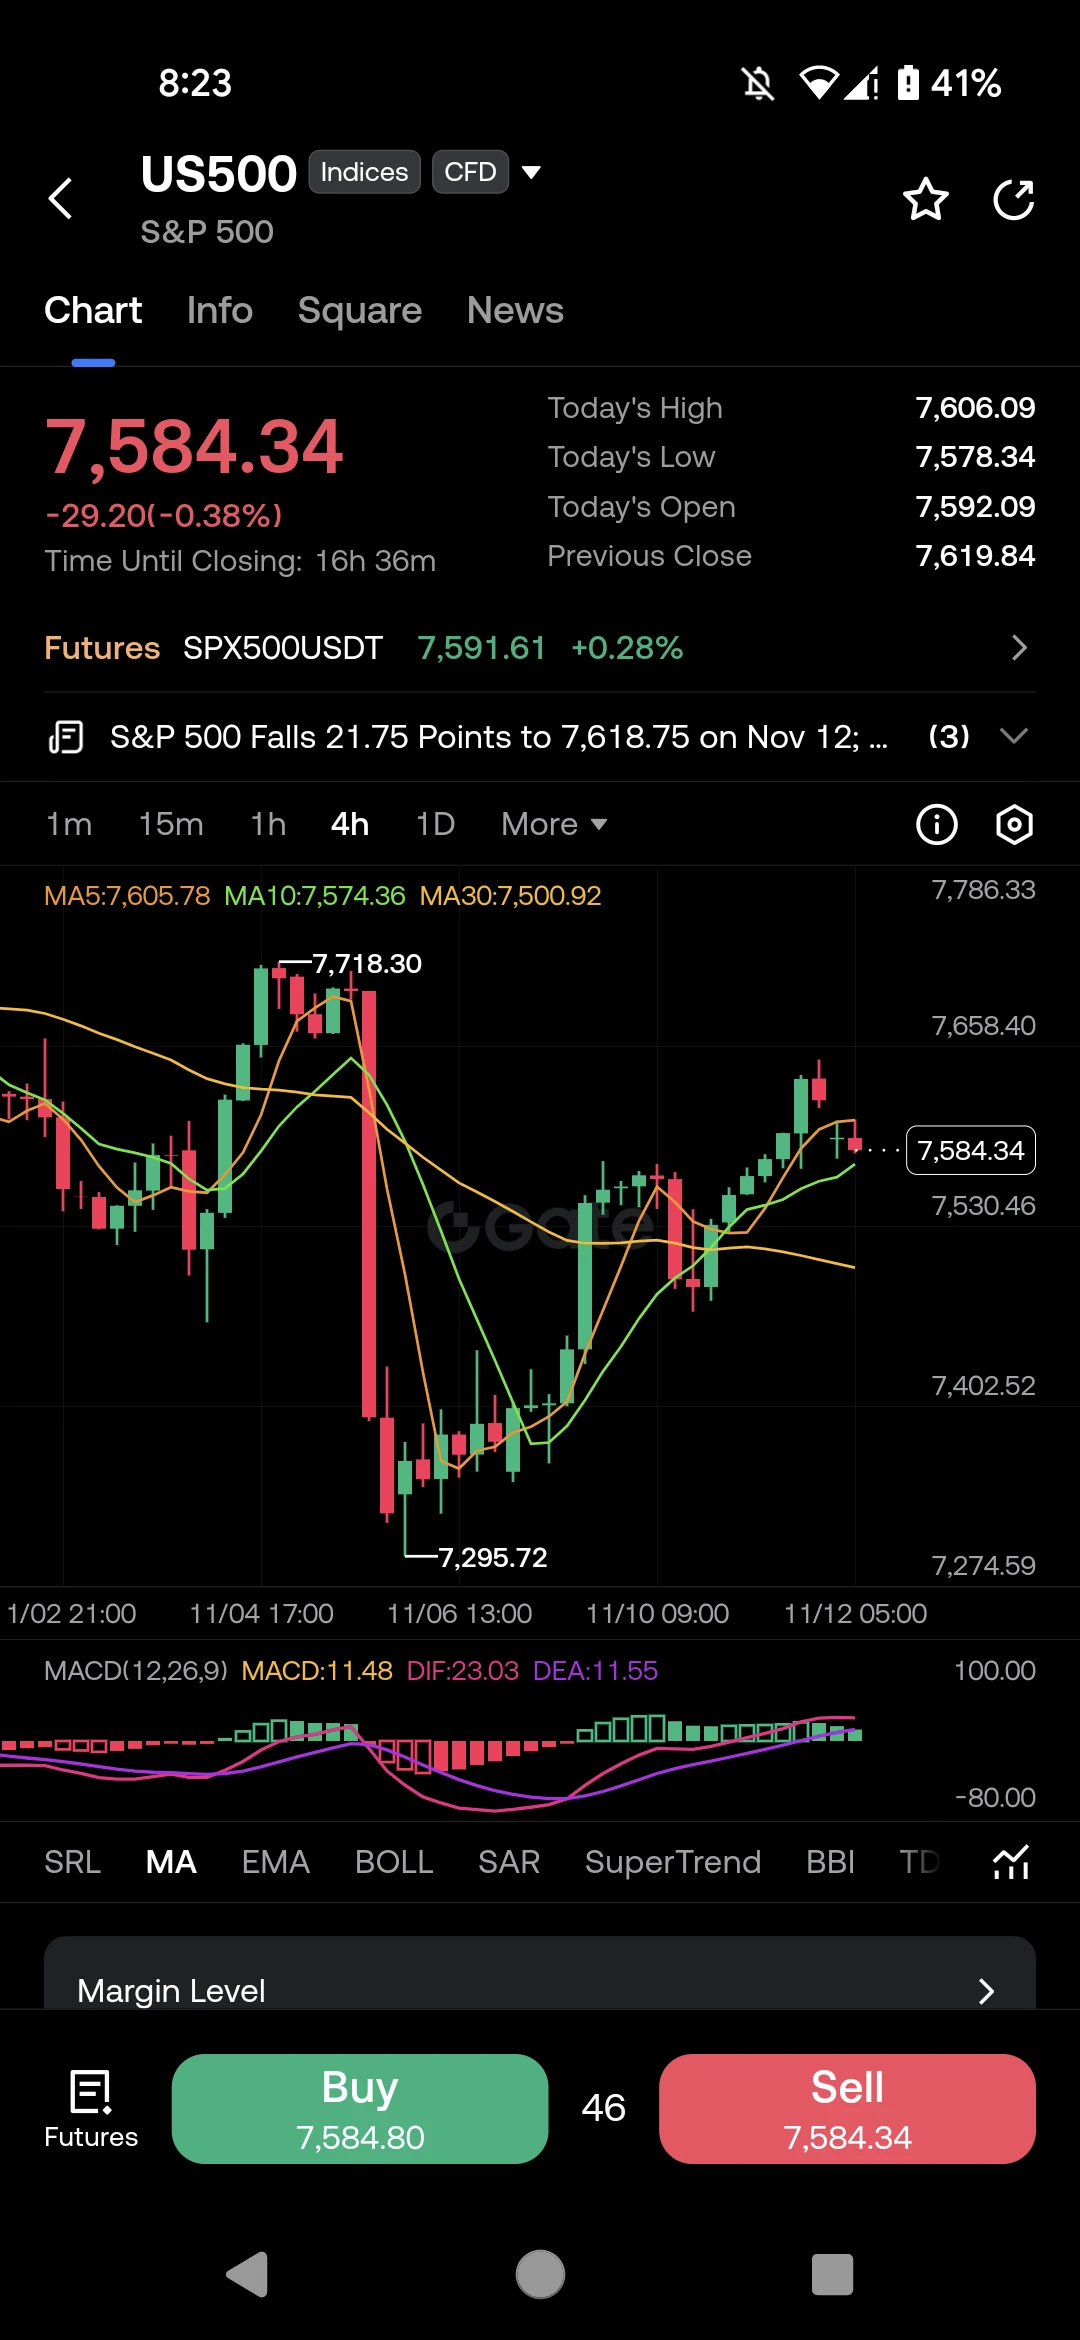
$US500 ‌Pullback: Testing the MA10 Support Zone"

The S&P 500 is facing some selling pressure today. US500 is currently trading at 7,584.34, down -0.38% as the market digests recent gains.

Let us look at the technicals on the 4H chart:

· The Trend: After a massive recovery from the 7,295 low, the index hit a local peak near 7,718 and is now pulling back.
· Moving Averages: The price is currently testing the MA10 (7,574), which is acting as immediate support. It has slipped below the MA5 (7,605), but the MA30 (7,500) remains a strong floor below.
· MACD: The indicator is positive at 11.48, b
post-image
US500-0.44%
The League of Legends S16 final is coming up on November 15!
To celebrate BLG making it to the final, Longkui is cooking something up...🫣
Just opened a new event group
Come grab your spot early!
post-image
  • 5
  • 2
Sola's forecast for today also played out. $SOL
After the spike, bullish momentum couldn't keep up, and the highs gradually declined. The rebound was only a brief recovery, followed by a weakening in tandem with the broader market. After reaching the resistance zone, it came under pressure and pulled back, successfully reaching the target range.
#AI商业化进入兑现期
SOL-0.77%
Why Do Spot and Futures Prices Trade at a Premium or Discount?

When you open a cryptocurrency trading platform, you may notice that the spot and futures prices for the same asset, such as BTC, are not exactly the same.

Why does this difference occur? Does it mean there is an arbitrage opportunity?

To understand this, we first need to understand how spot and futures markets work.

I. What Are Premiums and Discounts?

When the futures price is higher than the spot price, it is generally called a futures premium; when the futures price is lower than the spot price, it is generally called a fut
BTC-0.65%
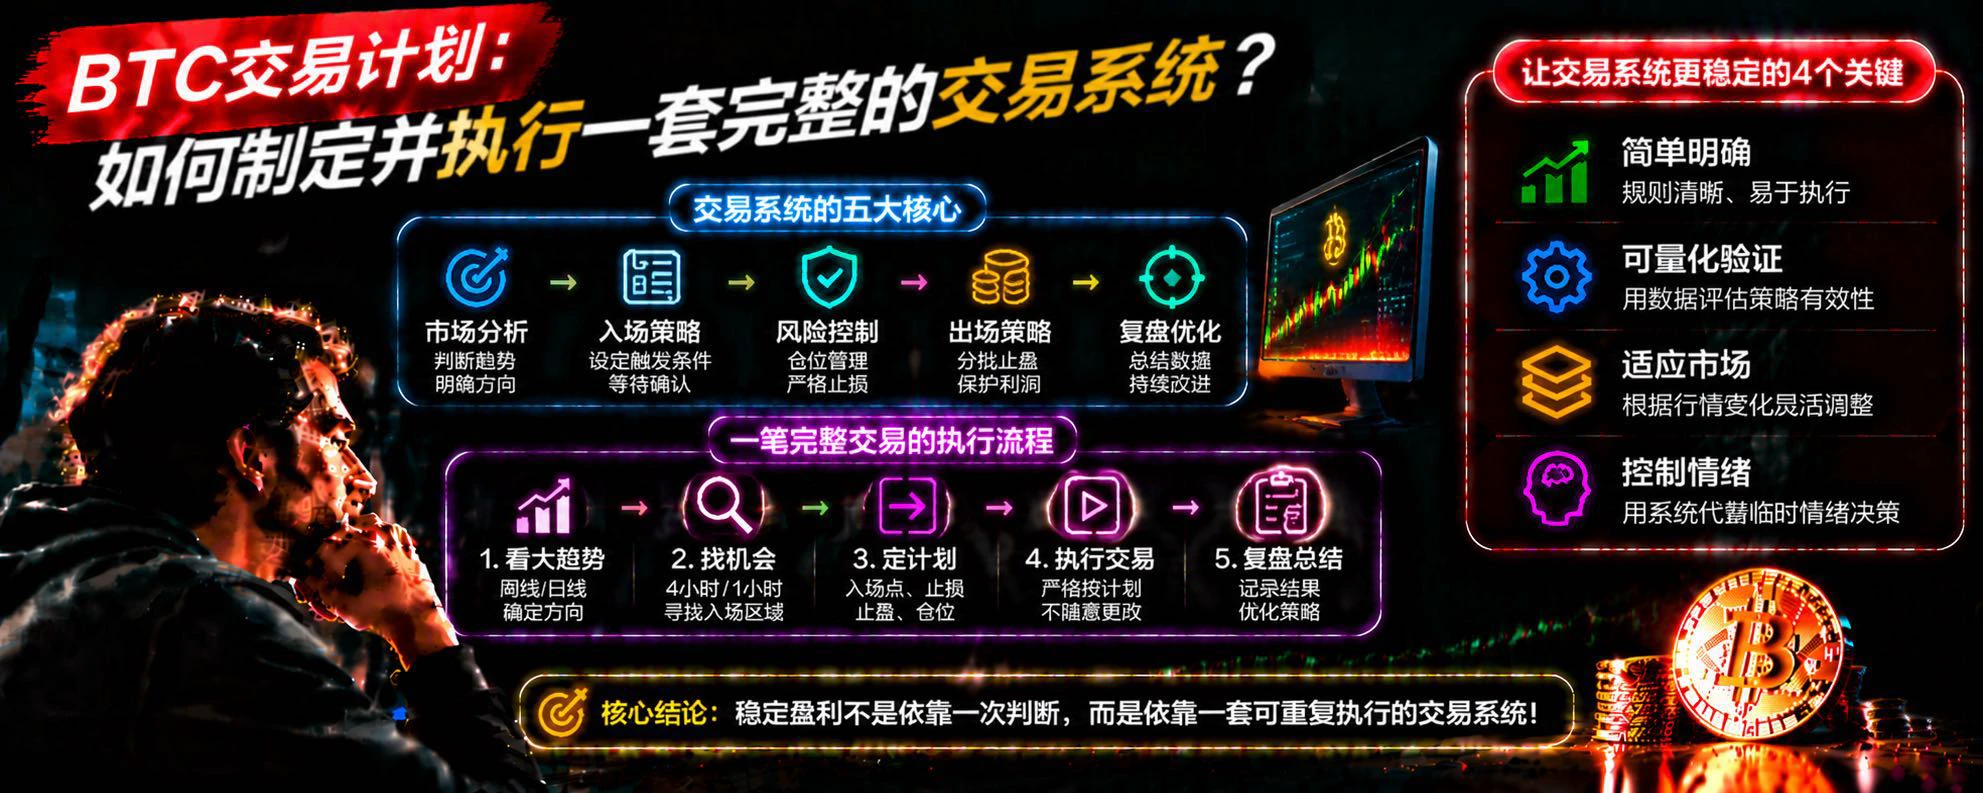
How Can You Build a Complete Trading System for BTC? 5 Key Steps from Analysis to Execution!

In BTC trading, many people study the market every day, learn various technical indicators, and constantly look for new trading strategies. But why can’t their accounts remain stable even after learning so much? One important reason is a lack of a complete, repeatable trading system.

Truly effective trading should not depend on snap judgments; it should follow clear rules.

First, build a market analysis framework. Before each trade, observe BTC’s higher-timeframe trend and use the daily, 4-hour, and
post-image
BTC-0.67%
Load More

Join 40 M users in our growing community

⚡️ Join 40 M users in the crypto craze discussion

💬 Engage with your favorite top creators

👍 See what interests you

Trending Topics

GateIPOAccessAnthropic

249.8K Views2.3K Discussing

Gate IPO Access Phase 3 features Anthropic (ANT), with USDT subscription interest starting from 100 USDT. Successful allocations will be delivered as real shares to Gate Stock Accounts. Indicative price: $70–$78/share Subscription: Nov 12–17 (UTC+8) Allocation is not guaranteed. Please manage risk accordingly.

USJoblessClaimsTonight

166.6K Views32.8K Discussing

JensenHuangCouldFaceRemoval

221.4K Views2.4K Discussing

View More