Share crypto content and earn up to 60% commissions through content mining.
placeholder
gatefun
On August 10, 2026, NVIDIA (NVDA) confirmed on its official website a piece of news that sent shockwaves through Wall Street: The company signed memorandums of understanding with six financial institutions, including Apollo Global Management, Blackstone, BlackRock Global Infrastructure Partners, Brookfield Asset Management, Goldman Sachs Group, and KKR, to jointly establish an AI infrastructure financing platform aimed at mobilizing more than $500 billion in third-party capital for AI chip procurement, data center construction, and power infrastructure development.
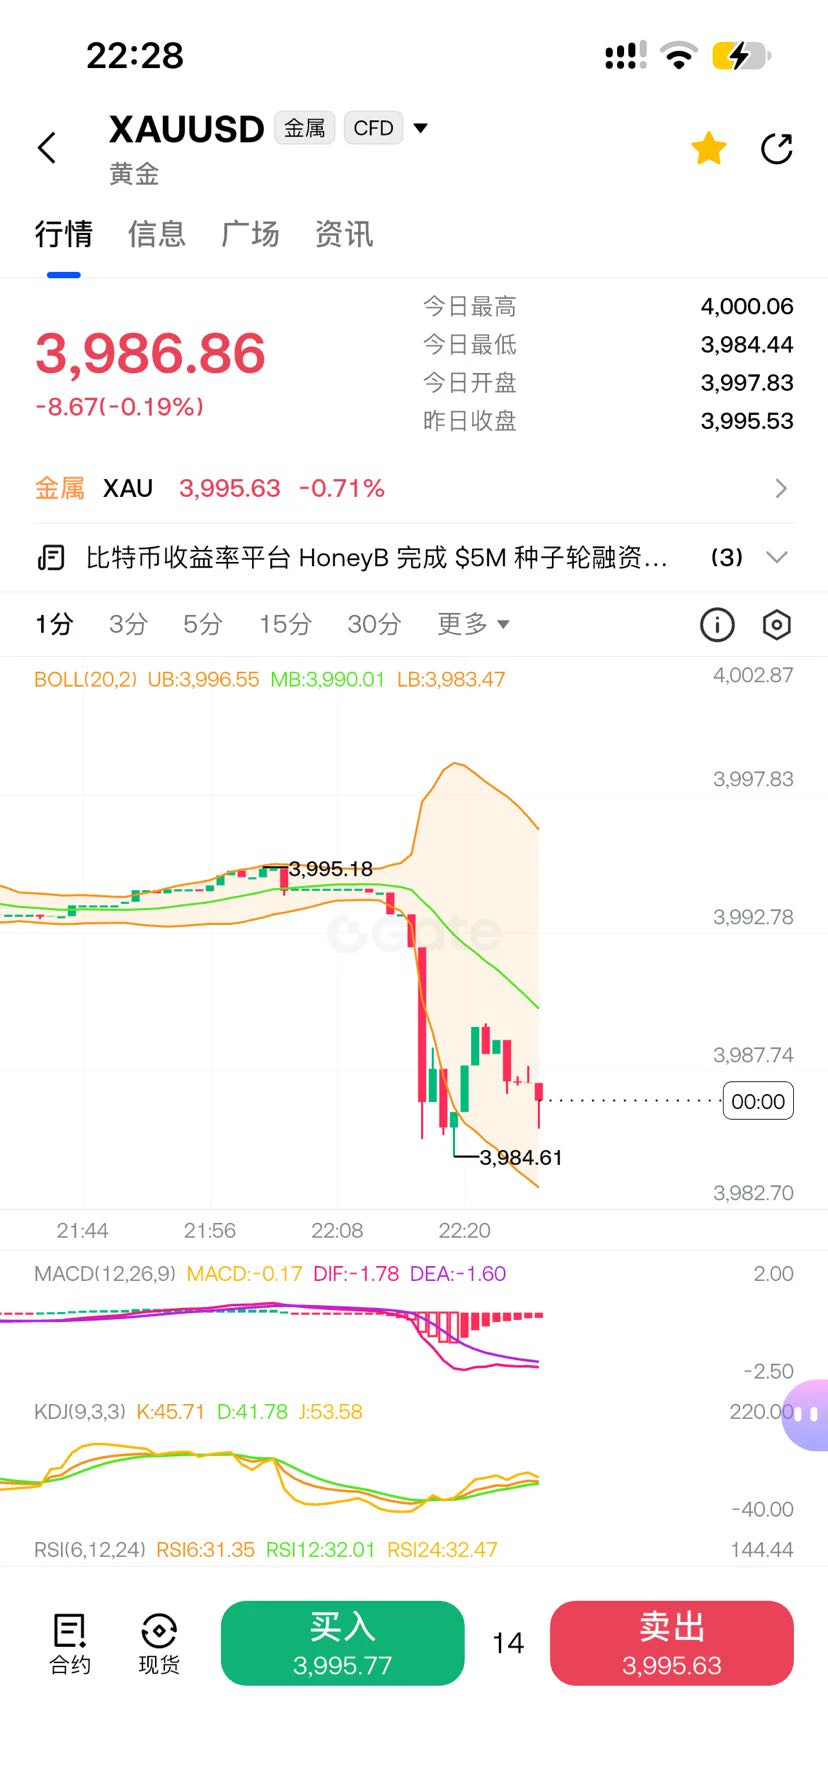
#现货黄金突破4400美元 $NVDA $XAUUSD
NVDA-2.83%
APO3.60%
BLK-0.52%
GS-0.54%
KKR1.20%
post-image
  • Reward
  • Comment
  • Repost
  • Share
#ETHFocusesOnQuantumPrivacyAI
Ethereum’s roadmap is starting to look less like a race for more TPS and more like a blueprint for what the network needs to survive the next decade.
Vitalik Buterin has highlighted three areas that could become increasingly important for Ethereum’s future: quantum safety, native privacy, and AI-assisted formal verification.
The quantum-safety push is about future-proofing Ethereum’s cryptographic foundation. As computing technology advances, blockchain networks cannot simply assume that the security mechanisms protecting accounts and transactions today will rema
FLOCK0.33%
LUNAI0.00%
post-image
post-image
  • Reward
  • Comment
  • Repost
  • Share
$SOL Signal】Shorts continue to attack + 1H MACD expansion
$SOL 1H MACD histogram -0.0272, RSI 39.81, and price at 75.73 is near the lower Bollinger Band. 4H MACD momentum is contracting, with histogram -0.171, while the middle Bollinger Band at 76.18 is acting as resistance. Order book depth imbalance is 17.86%, with selling pressure concentrated. OI is stable, and the funding rate is 0.0022%; longs have not exited but buying support is weak. The bearish direction is clear.
🎯Direction: short
⚡Entry/limit order: 75.5028 - 75.7300
🛑Stop loss: 76.4873
🚀Target 1: 74.5941
🚀Target 2: 74.0261
🛡
SOL-1.70%
DOS79.02%
View Original
post-image
  • Reward
  • Comment
  • Repost
  • Share
$BTC Long Setup Active! 🚀
• Entry Price: $63,859.8
• Mark Price: $63,945.0
• Leverage: 10x (Cross)
• ROI: +1.26%
Bitcoin is holding solid momentum above entry—eyes on the next resistance level! 📈
#BTC #Crypto #Trading
BTC-1.79%
post-image
  • Reward
  • 1
  • Repost
  • Share
CryptocurrencyAuthor:
good entry
YUNUS KARBA(Best of all time,first last child,boy,man),OnEPİECE,ChRİSTCHİLD,ChildJesus,NEWBORN GANG,Messiah,Mohammed,Mehdi,JeWEL,transerkomotor it...idiot,AdamEveLilith,fakeleaf,ru(a)bbishemaleisrael,templeprostitute,Assassins,peopleofLot,O... Children,beachofuniverse.31
View Original
  • Reward
  • Comment
  • Repost
  • Share
NICE PUMP
🚀🚀🚀🚀
post-image
  • Reward
  • Comment
  • Repost
  • Share
The Bitcoin spot ETF with the largest net inflows last week was BlackRock’s ETF IBIT, with weekly net inflows of $694 million; IBIT’s cumulative historical net inflows have now reached $61.17 billion. It was followed by Fidelity’s ETF FBTC, with weekly net inflows of $116 million; FBTC’s cumulative historical net inflows have now reached $10.04 billion.
BTC-1.79%
BLK-0.52%
View Original
post-image
  • Reward
  • Comment
  • Repost
  • Share
🔴 $XLM SHORT
🎯 Entry: 0.16063 – 0.16073
🛑 Stop Loss: 0.16389
🎯 TP: 0.15747 - 0.15426 - 0.15105
XLM-2.55%
  • Reward
  • 1
  • Repost
  • Share
mizanurrahman:
To The Moon 🌕
$NQ
Anyone who can understand the pain I am going through right now?
post-image
  • Reward
  • Comment
  • Repost
  • Share
$GUA ‌Why is there such a big difference between spot and futures? ‌
GUA60.79%
View Original
post-image
post-image
  • Reward
  • Comment
  • Repost
  • Share
#股票交易分享挑战 UBS maintains a “Buy” rating and $1,625 price target for Micron; HBM prices to rise 79% in 2027
According to BlockBeats, citing UBS, the firm maintained its “Buy” rating on Micron on August 11, with a price target of $1,625, implying 85% upside from its August 7 closing price of $877.57. UBS said that amid continued supply constraints, HBM consumption could accelerate as Nvidia adjusts its VR300 configuration, with total HBM consumption expected to rise from 58.7 billion Gb to 61.5 billion Gb in 2027.
The bank expects the average HBM selling price to rise approximately 79% year-on-ye
MU-1.81%
View Original
post-image
post-image
  • Reward
  • 6
  • Repost
  • Share
FatYa888:
Buy the dip and enter 😎
View More
Grayscale pulled three altcoin ETFs from the SEC
> $ADA
> $HBAR
> $DOT
Look at the actual timeline and it reads differently. NYSE Arca dropped the Cardano exchange listing back in September 2025.
Nasdaq dropped Hedera and Polkadot in November.
Without an active listing process, none of these S-1s could ever go effective. The August 7 filing wasn't Grayscale killing three products.
It was Grayscale closing the paperwork on three products that had been dead for the better part of a year.
Meanwhile Grayscale already runs eight altcoin ETFs that are live and trading, and the spread between them te
ADA-4.60%
HBAR-1.89%
DOT-0.64%
post-image
  • Reward
  • Comment
  • Repost
  • Share
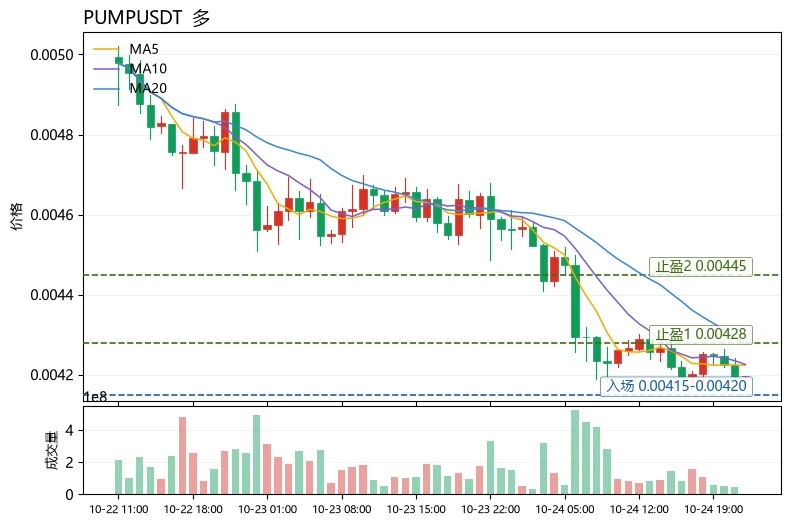
$TUT The first take-profit level has been reached
TUT-40.33%
View Original
post-image
post-image
  • Reward
  • Comment
  • Repost
  • Share
The Strait of Hormuz, the world’s most important energy transportation chokepoint, has once again become the center of a storm in global financial markets. On Monday, U.S.-Iran negotiations over reopening the strait reached an impasse after the Trump administration demanded compensation from Iran. International oil prices then skyrocketed, with WTI 原油 rising 4.16% to $81.71 per barrel, according to Gate market data, while 布伦特原油 broke above $86.80 per barrel, marking four consecutive gains. {curr
CL6.87%
BZ6.27%
post-image
GateInstantTrends
Hormuz Strait Talks Deadlocked: How Will Surging Oil Prices Impact U.S. Stocks and Bitcoin’s “Digital Gold” Narrative?
The Strait of Hormuz, the world’s most important energy transportation chokepoint, has once again become the center of a storm in global financial markets. On Monday, U.S.-Iran negotiations over reopening the strait reached an impasse after the Trump administration demanded compensation from Iran. International oil prices then skyrocketed, with WTI 原油 rising 4.16% to $81.71 per barrel, according to Gate market data, while 布伦特原油 broke above $86.80 per barrel, marking four consecutive gains. {curr
repost-content-media
  • Reward
  • 7
  • Repost
  • Share
LiquidityFisher:
The negotiating deadlock is merely the surface; deeper down, old wounds in global supply chains have been reopened.
View More
[New Streamer] Jensen Huang responds to AI funding doubts
gate liveLIVE
1,274
live-coin
  • Reward
  • Comment
  • Repost
  • Share
Remember, the money you lost was merely saved up—once you quit, that’s when you truly lose it!
View Original
post-image
  • Reward
  • Comment
  • Repost
  • Share
GM Saiyans ! 🙌
“No matter how much noise surrounds you. Stay focused on what you came to accomplish.”
---
$BTC : 63.855 $
$ETH : 1.870 $
#BTC Fear & Greed index: 29
#Bitcoin Dominance: 59%
BTC-1.79%
ETH-2.49%
View Original
post-image
  • Reward
  • Comment
  • Repost
  • Share
#股票交易分享挑战 Gold and silver surge collectively in this round: Four core reasons—how long can the rally last?
The first week of August saw a rare explosive rally in precious metals: International gold surged more than 7% in a single week, at one point breaking through $4,400/ounce; silver rose even more sharply, soaring more than 10% in a single week and hitting a new stage high. Many readers are wondering: Why did gold and silver suddenly take off together? Is this rally a short-term rebound, or the beginning of a new bull market?
I. The four core drivers behind this round of gold and silver g
XAUUSD-0.61%
XAGUSD-1.71%
USIDX0.08%
View Original
post-image
ThisIsTranslateContent:
#股票交易分享挑战 Gold and Silver Surge Together This Round: Four Core Reasons—How Long Can the Rally Last?
In the first week of August, precious metals saw a rare explosive rally: international gold surged more than 7% in a single week, briefly breaking above $4,400/oz; silver rose even more sharply, soaring over 10% for the week and hitting a new recent high. Many readers are wondering: Why did gold and silver suddenly take off together? Is this rally a short-term rebound, or the start of a new bull market?
I. The Four Core Drivers Behind This Gold and Silver Surge
1. The trigger: U.S. nonfarm payrolls come in far below expectations, directly fueling rate-cut expectations (the most direct catalyst) U.S. nonfarm payrolls increased by only 57k in July, far below market expectations, while the unemployment rate rose back to 4.5%, showing a clear weakening in the labor market.
The market immediately revised its expectations for Federal Reserve policy: the probability of another rate hike in September fell sharply, real U.S. Treasury yields declined rapidly, and the dollar index weakened.
Gold and silver are non-yielding assets. The lower the interest rate, the lower the returns from holding bonds and deposits, prompting funds to flow into precious metals for safe-haven protection and value preservation. This was the most direct macro trigger for the current rebound.
2. The long-term foundation: Global central banks are aggressively hoarding gold, firmly supporting the price floor
World Gold Council data: Global central banks made net gold purchases of 289 tons in Q2 2026, up 62% year on year; China’s central bank has increased its gold reserves for 21 consecutive months and made another substantial purchase in July.
Driven by the need to diversify foreign exchange reserves and hedge against risks in dollar assets, central banks are buying more as prices fall. Sustained physical demand has capped the downside for gold prices, and once macroeconomic tailwinds emerge, a rebound can easily begin.
Although silver is not held in large reserves by central banks, it has strengthened along with gold on improving macro sentiment, while also benefiting from funds following the trend into the market.
3. Fund flows: Short sellers rush to cover, amplifying the gains
Precious metals had been undergoing a sustained correction for some time, leaving the futures market with substantial short positions. After prices broke through key resistance levels, short sellers were forced to close positions and stop losses, creating a “short squeeze.”
Silver positions were particularly thin, so even a small amount of capital could trigger large price swings. This is why silver’s gains far exceeded gold’s, reflecting the additional impact of capital-market positioning.
4. Silver’s unique additional buff: Industrial demand continues to provide support Gold is primarily a financial safe-haven asset, while half of silver demand comes from industry: photovoltaic silver paste, new-energy batteries, and semiconductor consumables all consume large amounts of silver.
Global photovoltaic installations continue to expand, while stable industrial demand provides a solid floor. Silver is therefore driven not only by macro trends but also by demand from the real economy, giving it much greater elasticity than gold.
II. How Long Can the Rally Actually Last?
A rational assessment across three time frames (the mainstream institutional view)
✅ Short term (1–4 weeks): Consolidation and digestion; a straight-line surge is unlikely
1. Technicals: RSI and KDJ indicators for both gold and silver have entered severely overbought territory, creating a short-term need for a pullback and consolidation to absorb profit-taking;
2. Key data to watch: Upcoming U.S. CPI and inflation data will be decisive. If inflation rebounds again, hawkish statements from the Federal Reserve return, and the dollar strengthens again, this rebound will come to a temporary end;
3. Most likely trend: Volatility at high levels rather than a straight-line surge. Funds that missed the rally will gradually buy on dips, while a pullback and shakeout are likely after a rapid rise.
✅ Medium term (3–6 months, the second half of the year through early 2027): The core bullish logic remains intact, with a volatile upward trend as the main theme Several leading institutions have issued consistent baseline forecasts:
CITIC Securities: Around $4,000 is already the bottom range for gold prices in this cycle, and pullbacks are opportunities to build positions;
UBS and Citigroup: If the Federal Reserve confirms a shift toward easing and rate cuts in Q4, gold could challenge $5,000/oz in the first half of 2027;
Silver will continue to outperform gold in terms of elasticity, benefiting from photovoltaic demand and a recovery in the gold-silver ratio.
Three unchanged factors supporting the medium-term trend: continued central-bank gold purchases, a gradual weakening of the U.S. economy, and long-term pressure on the dollar’s credibility.
✅ Long term (more than 1 year): The foundation for a structural bull market remains, but prices will not rise nonstop
The de-dollarization wave, high global debt, and geopolitical uncertainty form the long-term backdrop, while gold’s value as a supranational hard asset remains relevant for long-term allocation.
But remember: no asset rises forever. Even during major bull markets, intermediate corrections of 20%–30% can occur, so do not chase the market or go all-in.
III. Three Major Reversal Risks to Watch Closely (The market will cool rapidly if any emerge)
1. U.S. inflation data unexpectedly rebounds, Federal Reserve officials collectively make hawkish statements, and rate-cut expectations fail to materialize;
2. Renewed escalation of geopolitical conflict in the Middle East drives up oil prices, causing inflation to resurface and forcing the Federal Reserve to maintain high interest rates;
3. U.S. stocks strengthen sharply, prompting funds to withdraw from safe-haven assets and flow back into equities, resulting in outflows from precious metals.
This article is only an educational analysis of macro market dynamics and does not constitute any investment$XAUUSD
repost-content-media
  • Reward
  • 3
  • Repost
  • Share
FatYa888:
Strongly HODL💎
View More
#股票交易分享挑战 Poor Performance of U.S. Chip Stocks: Intel Falls 4% as Apple Receives a Downgrade
The semiconductor sector faced significant selling pressure in overnight trading, with Intel's share price falling 4% while Apple was also downgraded. These two seemingly independent developments appeared within the same time window and were not simply market noise; rather, they reflected synchronized marginal changes taking place across the global technology industry chain on the demand side, supply side, and in capital-market pricing. Their transmission mechanism warrants a detailed breakdown.
First,
INTC-4.03%
View Original
post-image
post-image
DOGE/USDT
Buy
Limit
Order Amount
1,000
Order Price
0.05
Turnover
0
  • Reward
  • 6
  • Repost
  • Share
FatYa888:
Stay firm and HODL💎
View More
Load More

Join 40 M users in our growing community

⚡️ Join 40 M users in the crypto craze discussion
💬 Engage with your favorite top creators
👍 See what interests you
  • Pinned