
Square
Following
Hot
News
Notifications
Profile
Share your thoughts
placeholder
Article
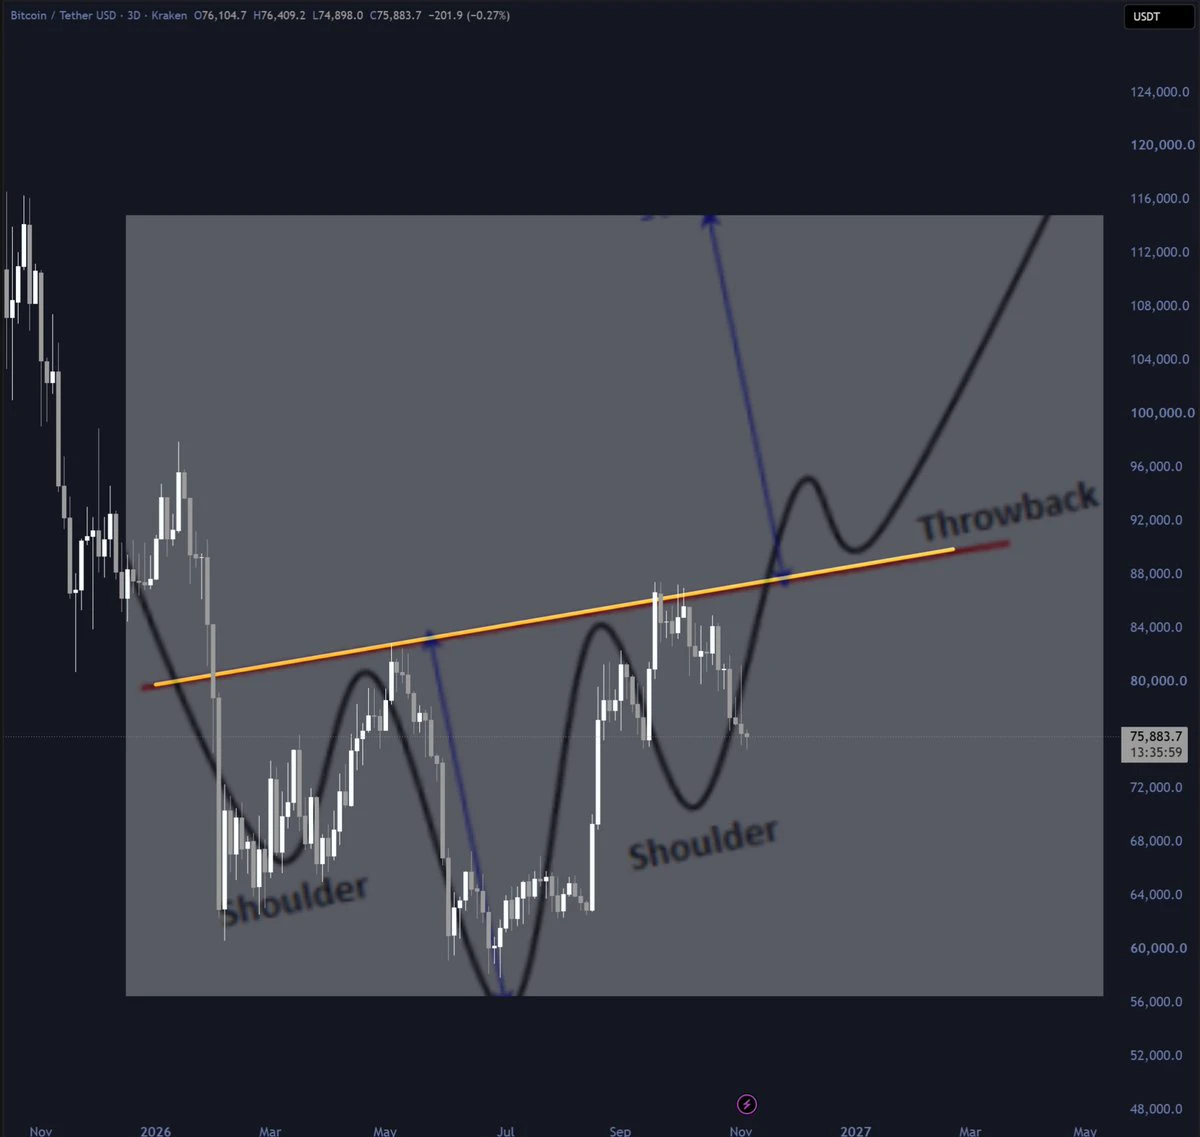
$BTC is forming a bullish inverse head and shoulder pattern
As I said yesterday, the worst case scenario is a drop to $72K followed by a pump above $90K
post-image
BTC-0.67%
A Top-Tier Revenge Thirty Years in the Making
post-image
Trenches
ZIG
Z
bade
b
ZIG
0x8c...1145
Market Cap
$.
Change
.
24h Vol
$.
Holders
.
STONK
S
bade
b
STONK
6GmA...UNgx
Market Cap
$.
Change
.
24h Vol
$.
Holders
.
IDOL
I
bade
b
IDOL
0x3b...ab07
Market Cap
$.
Change
.
24h Vol
$.
Holders
.
CLAUDIA
C
bade
b
CLAUDIA
2j5S...W2ZM
Market Cap
$.
Change
.
24h Vol
$.
Holders
.
FLOAT
F
bade
b
FLOAT
Bv1a...BMmr
Market Cap
$.
Change
.
24h Vol
$.
Holders
.
Shatter the illusion of perfection
Take off the filter and see life as it really is
Inner harmony is the ultimate destination
post-image
USDT market updates
live-cover
LIVE1,878
$HMSTR BOOM🤑🤑 has been building up for so long, finally ready to run, guys🙈🙈💸💸congabeo$KOMA $ICNT
post-image
HMSTR-1.98%
KOMA-3.91%
ICNT-10.32%
The booths at the African countries’ exhibits are indeed a bit more rudimentary.
crypto market update
live-cover
LIVE1,861
Don't measure your crypto journey against someone else's timeline.
People enter the market with different knowledge, strategies, goals, and financial situations.
Learn at your own pace. Ask questions. Make informed decisions. Understand the risks.
Progress starts with understanding, not comparison.
#CryptoJourney #CryptoCommunity #DYOR #Web3
post-image
#ARB

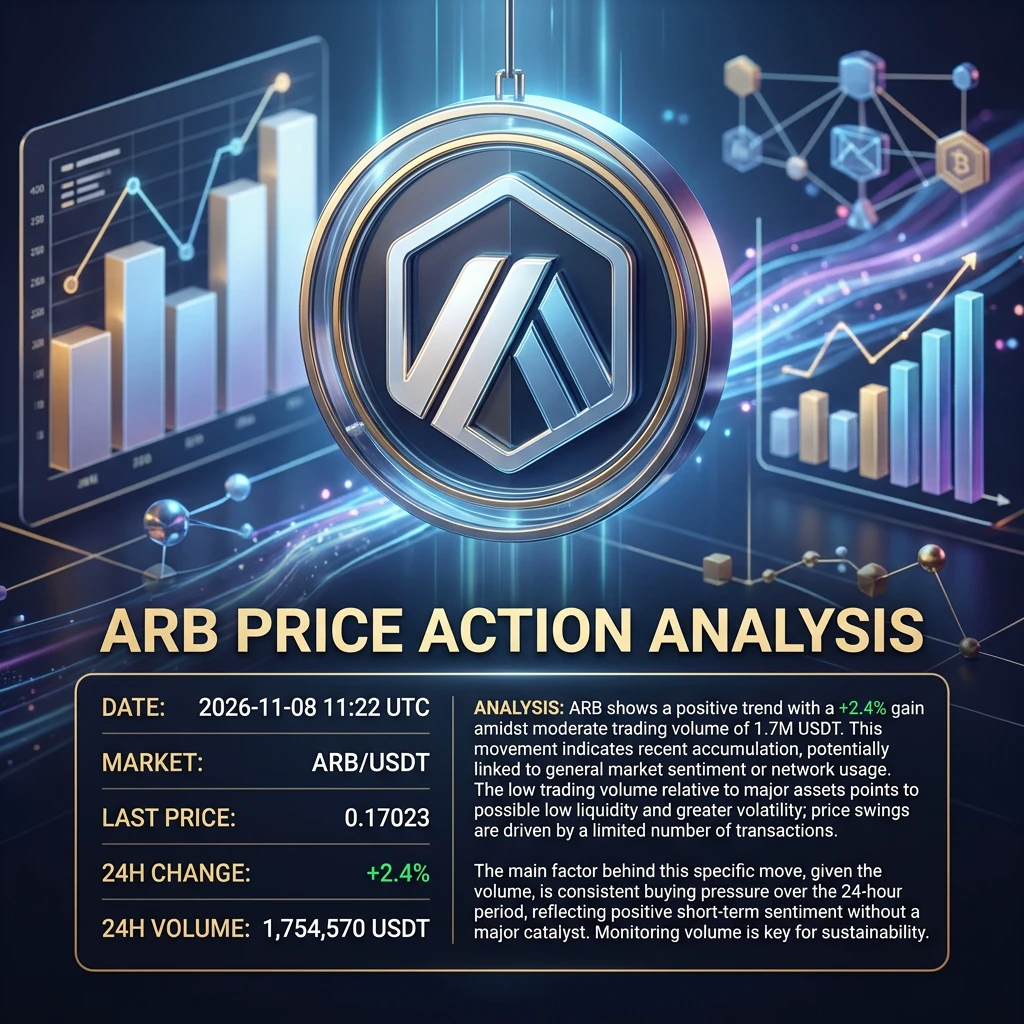
ARB Gains 2.4%: A Positive Move Does Not Always Mean a Stronger Market

A Common Market Myth

A green candle means buyers are taking control, and a rising price means a cryptocurrency is becoming stronger. This is one of the most common misunderstandings in crypto markets.

ARB provides a useful example of why investors should look beyond the colour of a chart. On November 8, 2026, ARB/USDT was trading at 0.17023 USDT, showing a 2.4% increase over 24 hours. Its reported 24-hour trading volume was approximately 1,754,570 USDT.

The move is positive, but the bigger question is whether it
post-image
ARB+1.17%
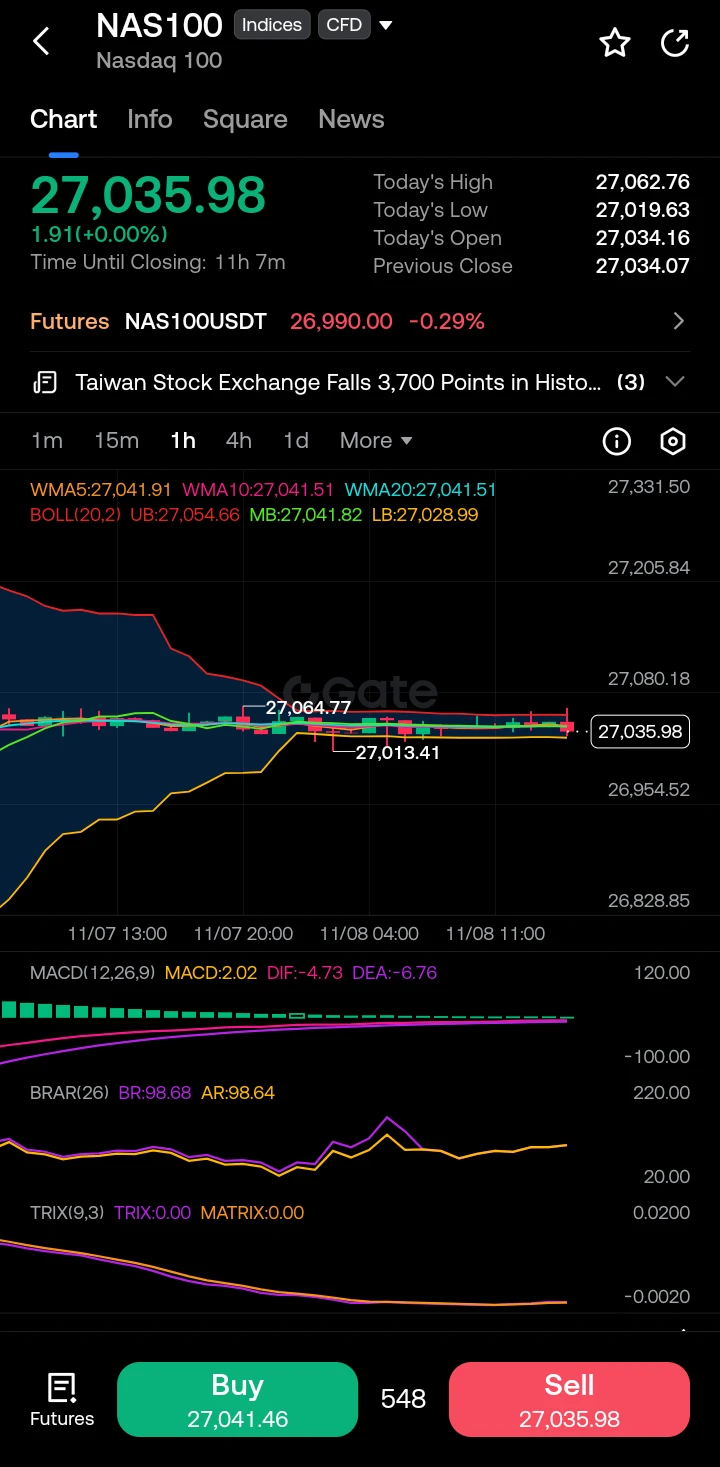
$NAS100 ‌
Looking at the 1-hour timeframe, the index is currently in a phase of extreme consolidation following a prior downtrend. The price has flattened out significantly, hugging the middle Bollinger Band (MB: 27,041.82) and the short-term WMA averages (WMA5/10/20 all clustered around 27,041). The candles have very small real bodies with wicks on both sides, indicating a battle between buyers and sellers with neither side gaining control. Crucially, the MACD lines (DIF -4.73, DEA -6.76) are deep in negative territory but are beginning to converge, suggesting bearish momentum is waning, whi
post-image
NAS100+1.90%
  • 2
This week, we precisely timed gold’s bullish and bearish moves, and our morning, midday, and evening analysis all played out as expected, with multiple market orders reaching their target ranges smoothly. Our sell-high and buy-low setups took turns generating profits, and we stayed in step with every market move. Markets can change in an instant, so our strategy must remain flexible. Next week, we’ll stay patient, strictly manage position sizes, and wait for new opportunities. $XAU #Ahr999跌入抄底区间 #黄金
XAU+0.38%
aster-2:native is holding well in the red market.
Breakout will send it to $10.
post-image
ASTER-0.07%
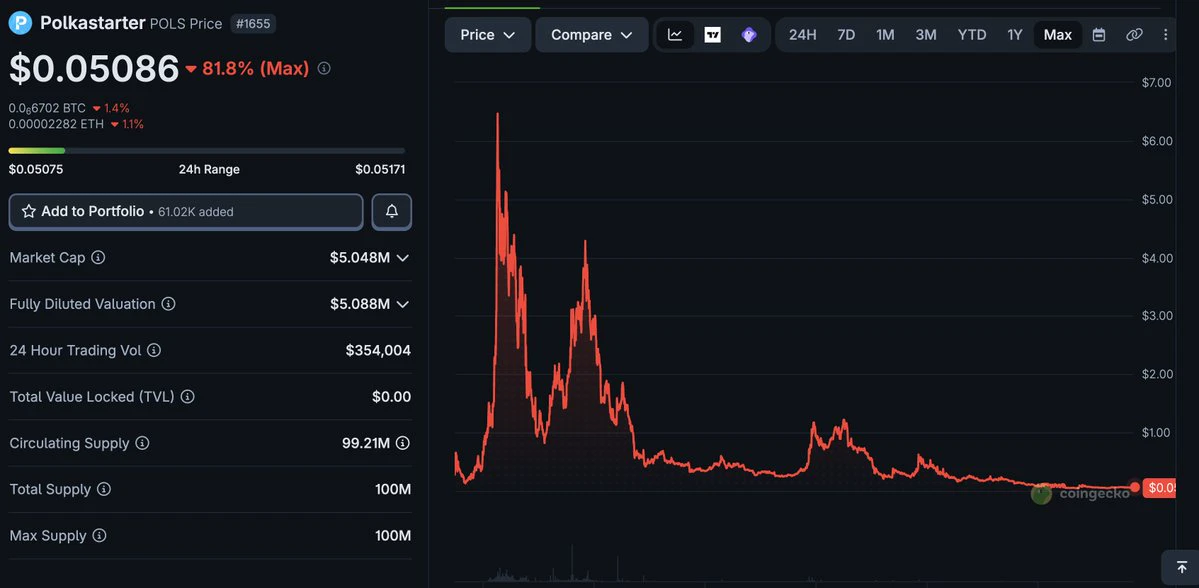
$PONS & $STONK are down bad and you'd be tempted to buy the dip.
Yet launchpads are always short-lived, cyclical products that come and go.
Remember daos fun, Polkastarter, Avalaunch and many more.
Would't be surprised to see $PONS chart as $POLS here.
Most never come back.
Still, pump fun and MetaDAO are two that managed to do well.
If you still believe in Pons & Stonk, better to follow their fees/revenue and even if you miss the bottom, buy on returning adoption.
post-image
PONS+4.32%
STONK+11.55%
FUN-0.44%
POLS-0.51%
XAVA-2.42%
Circle's Q3 earnings showed revenue of approximately $865 million, while on-chain USDC transaction volume grew nearly 49% year over year. The stablecoin sector is indeed heating up, and dollar-denominated liquidity in the market does not appear tight on the surface. However, BTC was still hovering around 75980 over the weekend, with a 24-hour range of roughly 74890 to 76380. Funding rates were near zero, and trading momentum was clearly weak.
What is really worth watching is the flow of funds: on November 6, U.S. spot BTC ETFs saw net outflows of about $412 million, including roughly $403 mill
post-image
ETH-1.26%
ZEC+1.16%
If I've fallen in love with this kind of life
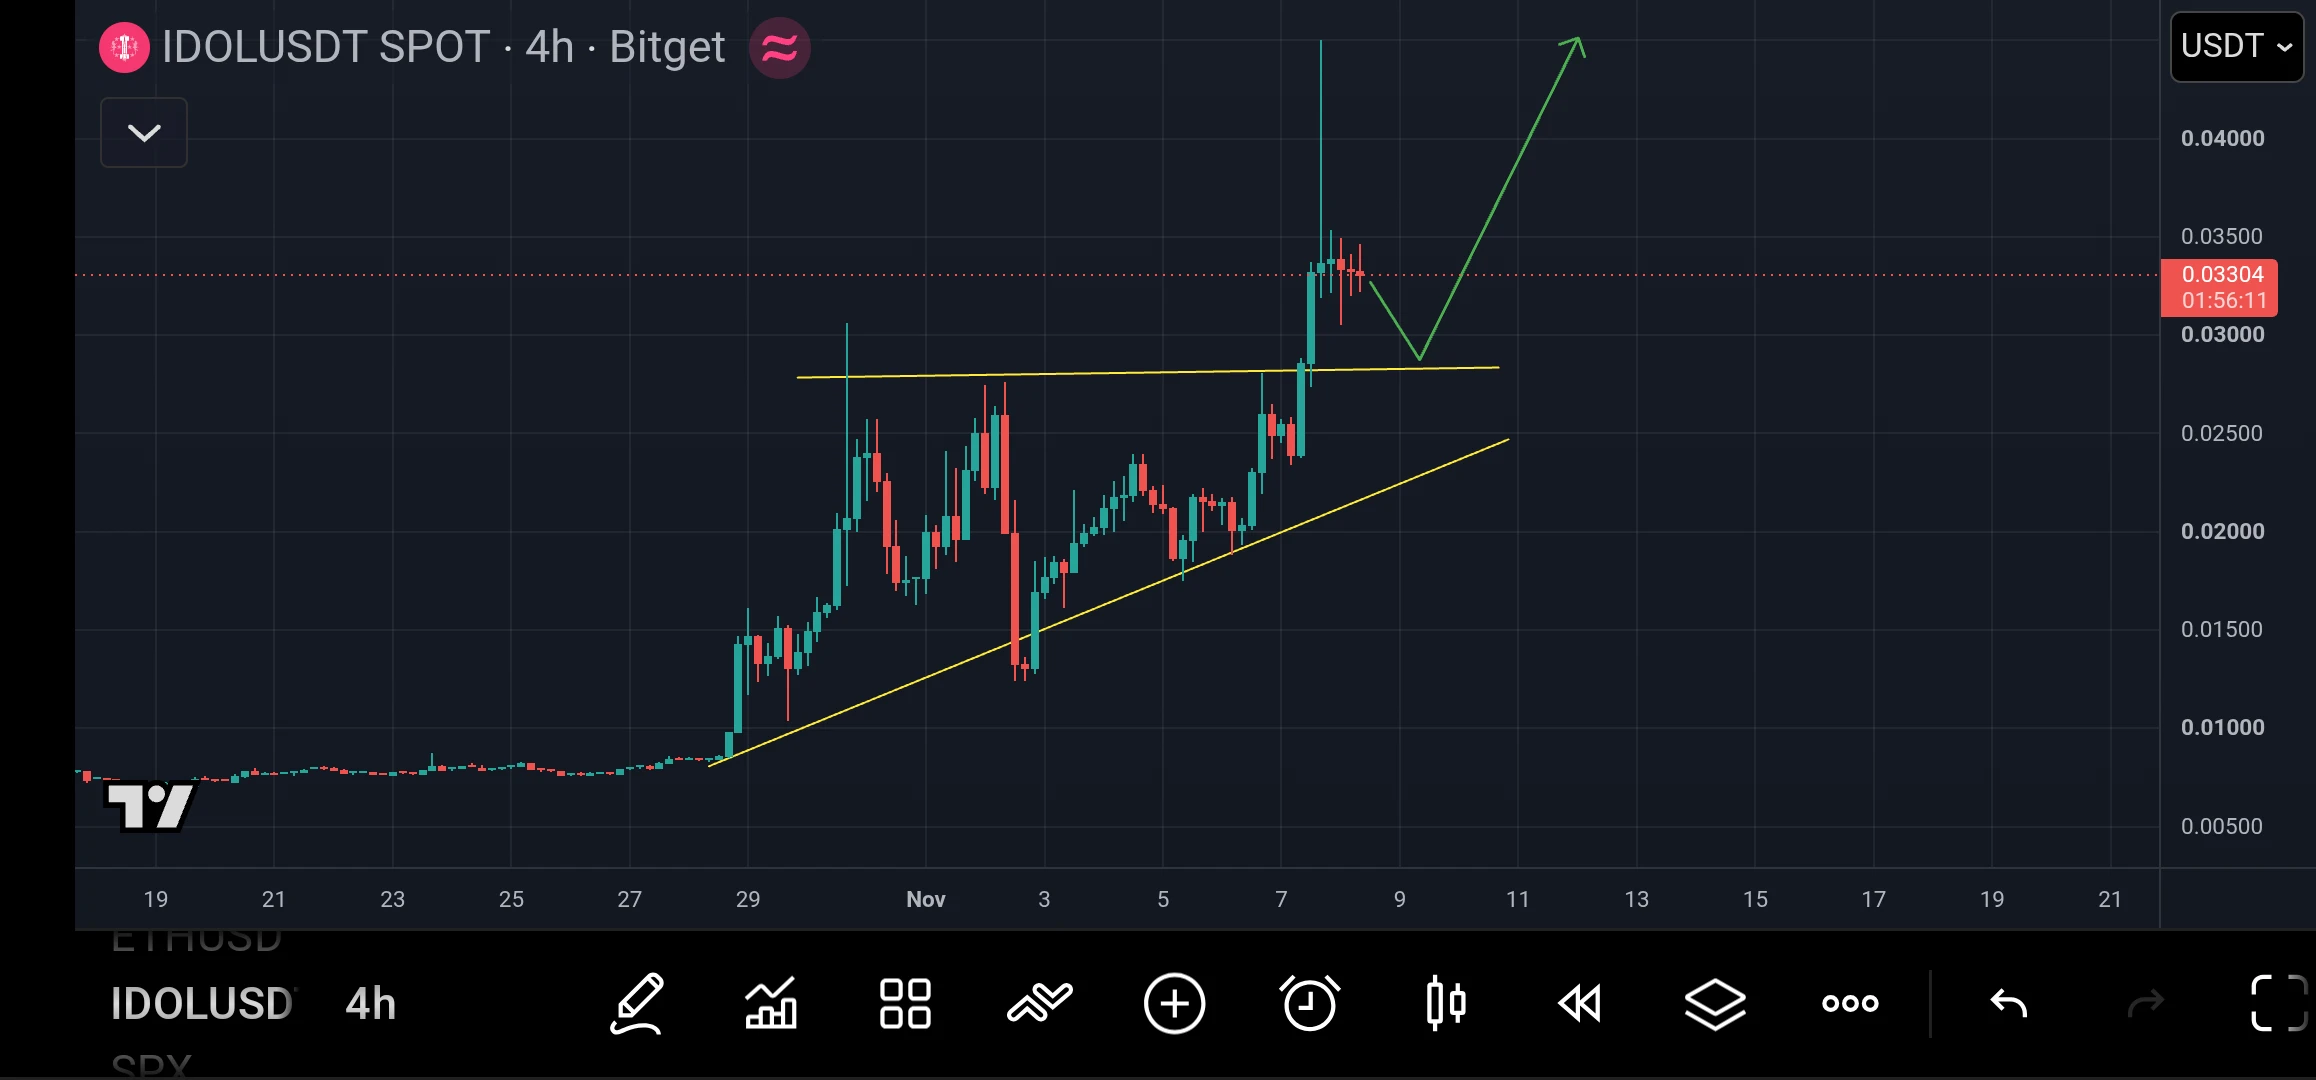
$IDOL has broken above the $0.028 resistance and is trading near $0.033 on this 4H chart.

I’m watching for a retest of $0.028–$0.029. Holding this area could support another move toward $0.035, then $0.040.

My view: the breakout looks promising, but I’d wait for support to hold before getting too bullish. Falling below $0.028 would weaken the setup.
post-image
IDOL-6.71%
This Bai Xiaochun user manual had me laughing so hard I almost puked.
post-image
$BMT 's data looks off. Up 17% in 24h, price surged to 0.0266, just shy of the 0.0268 high, but trading volume hit 42.1M—enough for three days of trading under normal conditions. Even stranger, the low was 0.0224; it was still sitting there in the morning, then shot straight up in the afternoon with almost no pullbacks.
Three possibilities: someone got wind of news early and was accumulating—the volume is too orderly to look like scattered retail buying; someone got squeezed on the futures side, pulling spot up with it; or it's purely sentiment-driven, but 42M in volume doesn't look like a joke
BMT+5.93%
$SOL The liquidation map for the past 7 days shows:
If SOL rises to $91.7, cumulative short liquidation intensity across major exchanges is $138 million.
If SOL rises to $94.2, cumulative short liquidation intensity across major exchanges is $295 million.
If SOL falls to $87.9, cumulative long liquidation intensity across major exchanges is $97.22 million.

Trading strategy:
Place a long order at $87.9, with a take-profit range of $91.7–$300. $SOL ‌
SOL-0.74%
Load More

Join 40 M users in our growing community

⚡️ Join 40 M users in the crypto craze discussion

💬 Engage with your favorite top creators

👍 See what interests you

Trending Topics

USCPIDataIncoming

6.81k Views1.56k Discussing

The U.S. October CPI report will be released on November 10 at 8:30 a.m. ET. September CPI came in at 3.7% year over year, and markets will be watching closely for signs that inflation is cooling, especially in core CPI. A softer-than-expected reading could strengthen rate-cut expectations, while hotter inflation may pressure risk assets through higher Treasury yields and a stronger dollar. How do you think this CPI print will move $BTC, U.S. stocks and gold?

USAIStocksHitHard

26.34k Views3.72k Discussing

USNonfarmPayrolls

48.5k Views4.45k Discussing

View More