Share your thoughts
placeholder
Article
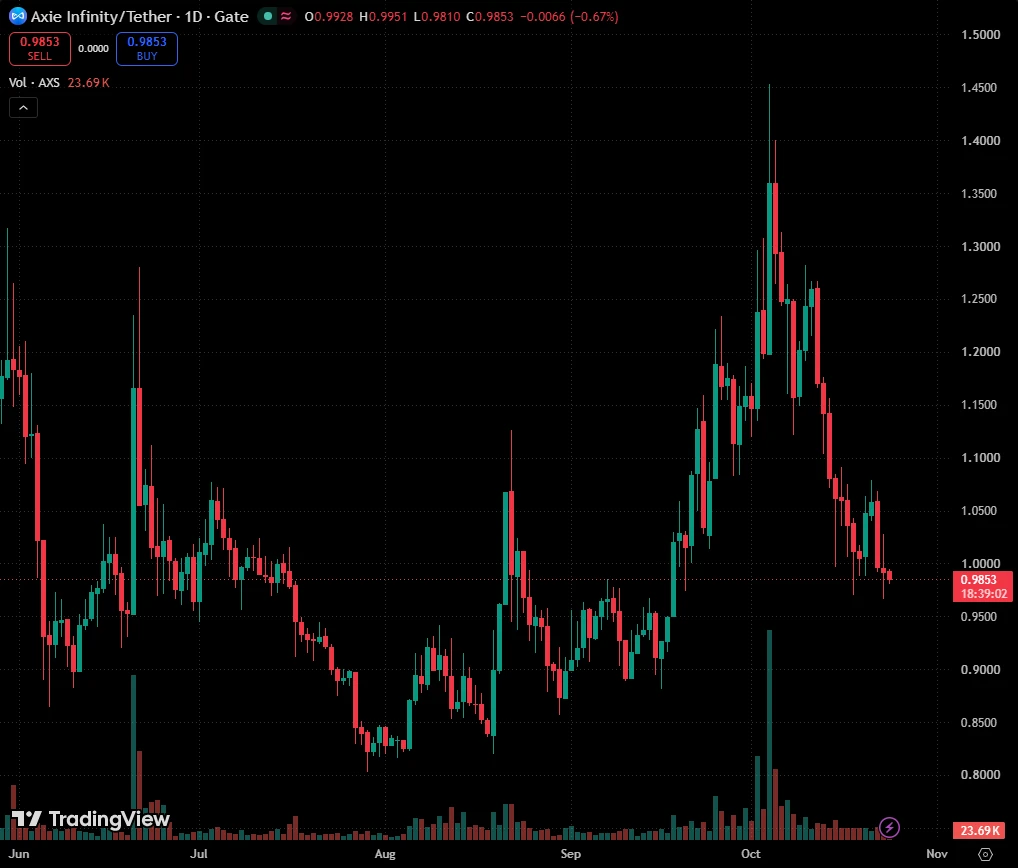
Insiders are quietly loading SYMBOL while the 1h RSI stays oversold.

$AKE /USDT - LONG

Trade Plan:
Entry: 0.015567 – 0.016205
SL: 0.012824
TP1: 0.018183
TP2: 0.019714
TP3: 0.022011

Why this setup?
Why now? The daily trend is firmly bullish, the 1h ATR is just 0.001276, and the 15m RSI sits at 39.48, showing room for a squeeze higher. The entry zone of 0.015886 aligns with the current 1h price, giving a clean reference for a long. The first target of 0.018183 and the second target of 0.019714 offer a favorable risk-to-reward profile against the invalidation level of 0.013118. This invalid
AKE-1.81%
loool first time posting on Facebook in months
get instabanned for posting a meme in a comment to a friend
jfc @finkd what has your website become? you should take back Justin Timberlake as an advisor 😂😂😂
post-image
Market prediction
live-cover
LIVE26
$MOO Performing brilliantly in Gate Futures’ Robinhood section!
🐮 A chip-sector pun, a bull in the Meme sector!
🔹 48-hour gain: 43.44%
🔹 Hot take: Micron’s MU homophone × cow Meme, $MOO bringing the memory chip narrative to Robinhood Chain!
🔥 Gate Futures follows the market closely, rapidly listing popular Memes!
Trade $MOO: https://www.gate.com/zh/futures/USDT/MOO_USDT
MOO-1.75%
  • 1
One memecoin you can’t build a portfolio without __________ 🤔
$DOGE
$SHIB
$PEPE
$FLOKI
$PENGU
post-image
MEME-0.01%
DOGE-0.56%
SHIB-0.14%
PEPE+1.77%
FLOKI+0.19%
Nobody is talking about $HYPE /USDT breaking above 86.805 tonight.

$HYPE /USDT - LONG

Trade Plan:
Entry: 84.304 – 84.688
SL: 82.649
TP1: 85.881
TP2: 86.805
TP3: 88.190

Why this setup?
Why now? The 4h setup and the daily trend both confirm a bullish bias with 95 percent confidence, making this a high-conviction LONG. The 1h ATR of 0.769507 shows the market is moving fast enough to hit targets quickly once momentum starts. The 15m RSI at 54.18 means price is neither overbought nor oversold, leaving room to run before exhaustion. The entry zone between 84.304 and 84.688 offers a tight risk
HYPE-0.32%
#晒出我的持仓收益
Get up in the morning and soak up some sun.
post-image
Looking at the charts
Need to hit a runner
1 SOL and a dream
We’re all retiring this 2026
Manifesting this for all my friends
post-image
SOL-0.29%
The screen awash in green looks like panic to many people, but to me it’s just an after-show for my short positions. When the early-session sell-off first began, $HNT ’s intraday rebounds kept getting weaker, and both consecutive pushes higher lacked volume. With the key level above clearly visible, I shorted it directly at 0.6474. Now 0.5545 is no longer the opening price, and +412.16% in unrealized profit is sitting in the account. It feels great.

The inability to rise is the biggest bearish signal. When the bait to go long isn’t strong, I can’t even be bothered to act.

First lock in +41
post-image
HNT+3.94%
ETH+0.05%
BNB+1.92%
Nobody is talking about this quiet move in $SOXL /USDT right now.

$SOXL /USDT - SHORT

Trade Plan:
Entry: 122.98 – 123.98
SL: 128.25
TP1: 119.90
TP2: 117.52
TP3: 113.94

Why this setup?
Why now? The 1h price is sitting at 123.48 inside a tight range on the daily chart, and the 15m RSI reading of 43.43 shows momentum is turning bearish, not bullish. The 1h ATR of 1.986514 tells us volatility is compressed enough for a sharp leg down once selling starts. The entry zone between 122.98 and 123.98 lines up perfectly with this exhaustion, giving us a clean setup to target 119.90 first and then 1
SOXL-0.69%
I had just switched the software to the background when it suddenly plunged. Is it playing hide-and-seek with me? 😏

While everyone else was running, I took another look instead. $PRL formed shorter and shorter candles above 0.18850, and every push upward fell just short. The selling pressure above was too obvious—if you don't short this kind of rebound, you'd really be ignoring the signal from the chart.

I didn't keep watching after opening the short. When I switched back, it had already reached 0.12583. The move down from 0.18850 delivered a +654.41% return, making me say out loud that
post-image
PRL-4.65%
ZEC+4.51%
BTC-0.63%
This isn’t a rebound—it’s a tube inserted into an account that was about to snap. After $SKHYNIX dumped hard in the early session, I actually perked up as buy-side bids strengthened.
It didn’t follow the drop, and the support was strong enough—the opportunity was unmistakable. I entered the long at 1171.00, and with the price now at 1358.76, I’ve captured a +1139.42% return. It feels great when you get the timing right.
I took 80% off the table first, and raised the stop-loss on the remaining 20% to the entry price. Only realized profits count as money; no matter how large the unrealized gains
post-image
SKHYNIX+2.63%
BTC-0.63%
ZEC+4.51%
I'm literally shaking...
bitcoin:native golden cross
post-image
BTC-0.70%
$SPCX /USDT is about to break a range that has held for weeks.

$SPCX /USDT - SHORT

Trade Plan:
Entry: 152.60 – 153.24
SL: 156.02
TP1: 150.59
TP2: 149.04
TP3: 146.71

Why this setup?
Why now? The 1h price sits at 152.92, the exact entry_ref, while the 1d trend remains range-bound and the 15m RSI reads 55.27, showing neither overbought nor oversold exhaustion. The 1h ATR of 1.293659 signals enough volatility to push the trade from the entry zone between 152.60 and 153.24 toward TP1 at 150.59 and then TP2 at 149.04. With confidence at 55.4%, the setup is a measured short, not a moonshot, and
SPCX+1.92%
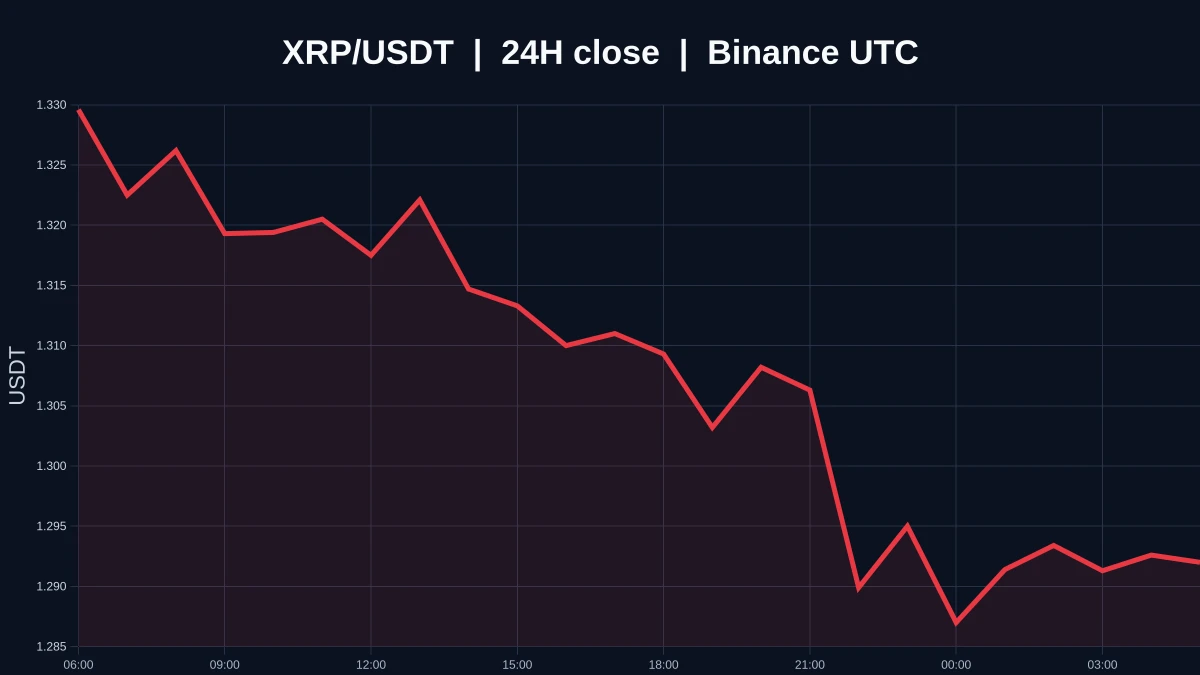
I switched to the background to reply to a message, and when I came back, it had already done the job. During the repeated intraday volatility, I watched for a long time and found that nobody was buying each rebound—the selling pressure was overwhelming, and the capital had no intention of pushing it higher. Right after lunch, while checking the chart, I gave a short-trade idea: entered at 1.3889, and it has now moved down to 0.1768, delivering +1718.34%. Feels good, brothers—this is how you hold a short. For the trade, take 70% off first and set a protective level for the remaining 20%. Don’t
post-image
XRP+1.83%
LAB-1.47%
$ABT (per request)
This is a good example of a dead chart. Could it come back from the dead? Sure. But it's been dead for a long time so rather than hold a dead chart or waste time watching a dead chart I'll look for better opportunities elsewhere until this shows volume or structure change.
post-image
ABT-2.52%
While I was away using the restroom, the candlestick chart had already wiped out my losses for me. A few days ago before bed, I looked at $BEAT : the rebound had no volume, and every push upward fell just short. This wasn’t a breakout—it was a bull trap. The level I gave was around 0.4692, and this was exactly the drop I was waiting for.

The current price has already fallen to 0.1299, sending my unrealized profit straight to +1423.44%. I’ve taken 80% of the profits off the table, and moved the stop-loss on the remaining 20% to breakeven. I’ll keep holding if it continues to drop, and even if
post-image
BEAT-1.74%
ZEC+4.51%
SOL-0.22%
JUST IN: New York town weighs a new moratorium extending to crypto mining and AI data centers. If approved, this could slow local mining activity and signal heightened regulatory scrutiny in the sector. $BTC ? (skip ticker since not clearly relevant)
post-image
BTC-0.70%
I was just about to go rant on the forum, but then I looked at my balance and thought, forget it—the market daddy is always right 🙏 A few days ago, in that split second before bed, I almost closed my short and was still cursing the market for playing dirty.

Then $UB today it taught me a lesson, sliding all the way from 0.21896 to 0.12085, with +1098.3% secured. Luckily, I held my nerve and didn’t foolishly cut the position at the start of the rise. That wait was worth it.

Looking back, the rebound lacked volume, selling pressure was obvious, and the structure had not turned bullish. I cho
post-image
UB-5.65%
SOL-0.22%
ETH+0.05%
Load More

Join 40 M users in our growing community

⚡️ Join 40 M users in the crypto craze discussion

💬 Engage with your favorite top creators

👍 See what interests you