
















#KeyMacroWeekAhead #宏观关键周 #WCTCS9 The Fed, GDP and PCE: Three Tests That Could Reset Market Direction
Some weeks are driven by one headline. This one is different. Between October 27 and October 29, markets will receive a consumer-confidence reading, the Federal Reserve’s policy decision, and two major economic releases covering US growth and inflation. The challenge is that these indicators could point in different directions: the economy may remain resilient while inflation stays uncomfortable and financial markets struggle to find momentum.
My focus this week is not simply whether the data comes in hot or cool. It is whether the combined evidence changes expectations for interest rates, liquidity and the value of risk assets.
The starting point: markets are already cautious
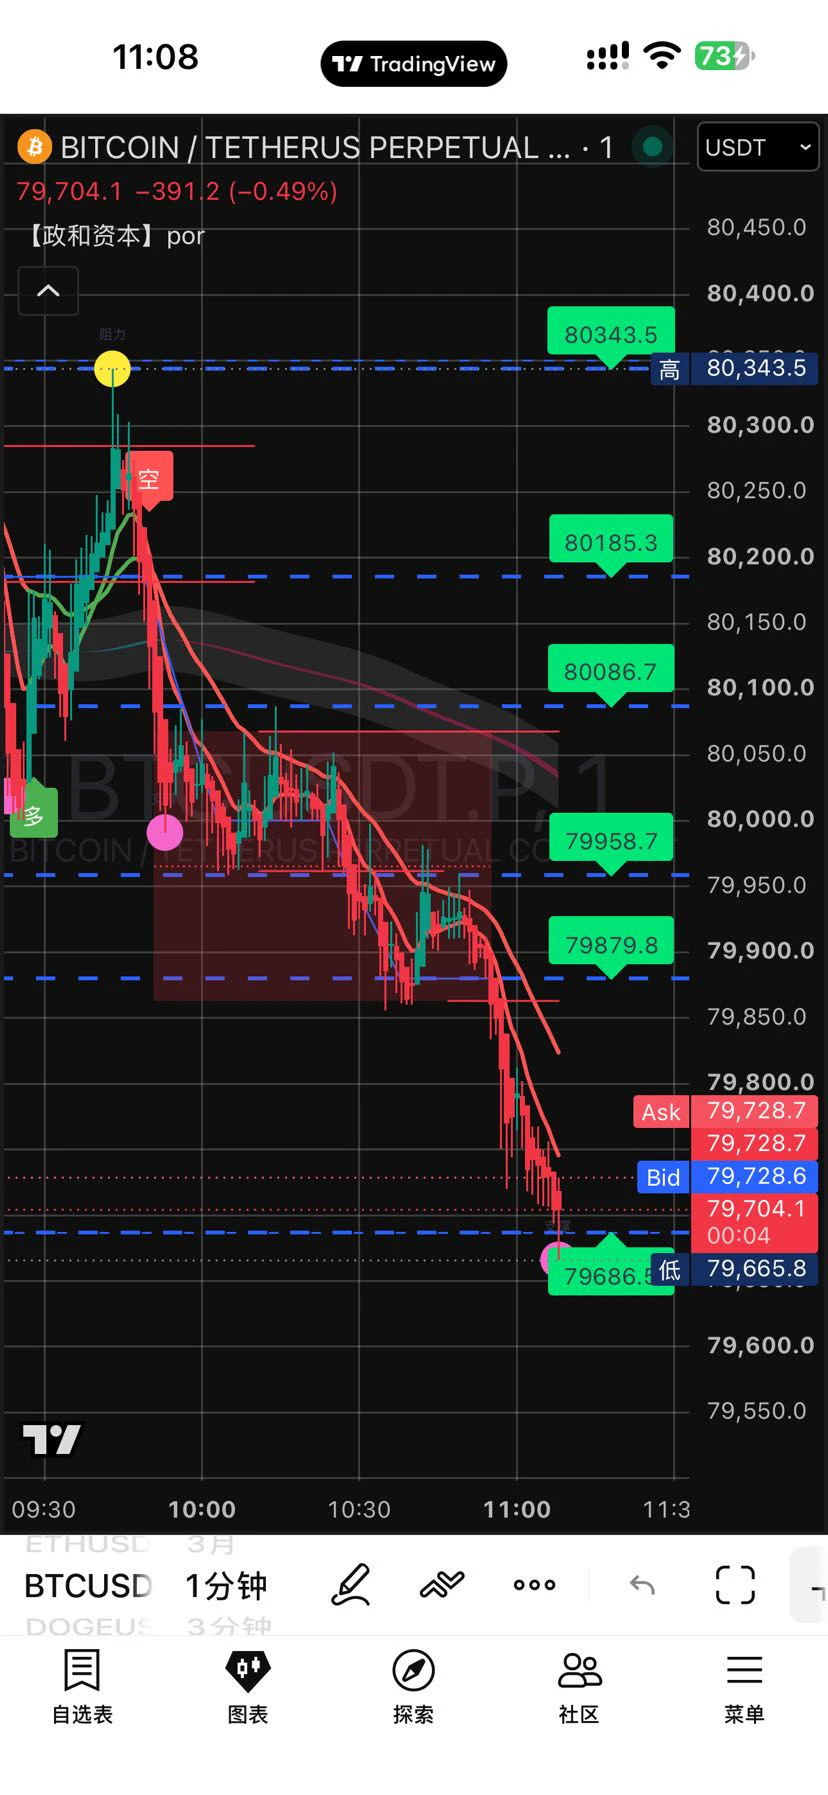
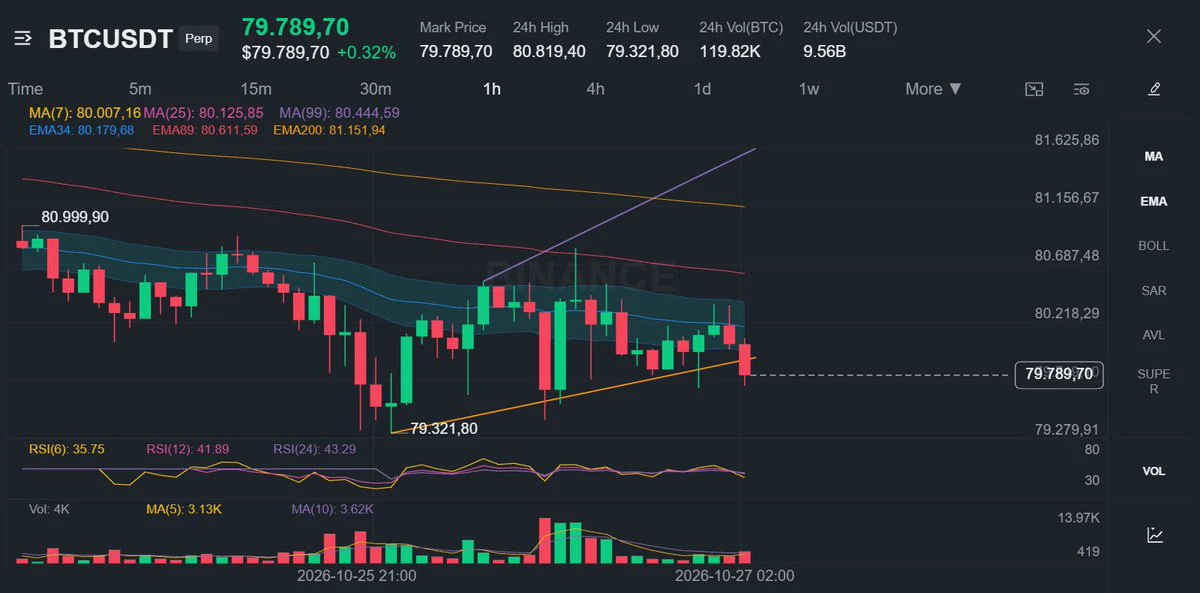
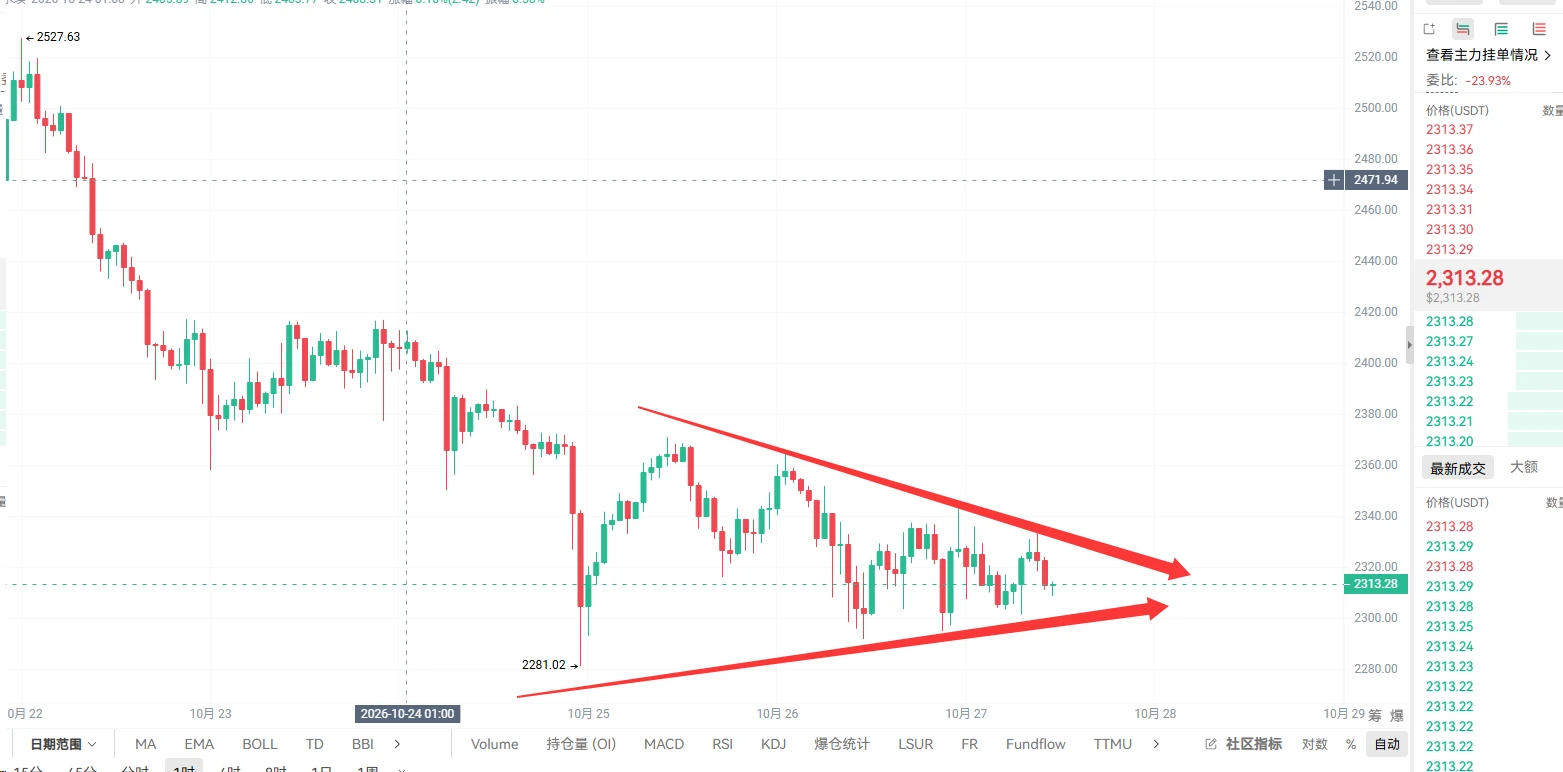
On October 26, Bitcoin was trading around $80,000–$80,500 in the latest available market snapshots, while Ethereum was near $2,300. The Nasdaq Composite closed at 29,026.41 on October 23, down approximately 0.7% for the week. The US Dollar Index stood near 101.64, the 10-year Treasury yield was around 4.97%, and gold was near $3,986 per ounce in Monday’s market report.
These readings provide the starting line, not a prediction. Crypto trades continuously, whereas US equities have regular sessions, so exact prices and percentage changes depend on the timestamp. What matters next is how these markets respond after each release.
October 27 — Consumer confidence: the first signal
The Conference Board’s September Consumer Confidence Index fell to 81.9 from 88.6 in August, missing expectations and highlighting weaker household sentiment. The October reading is due Tuesday. Market-calendar estimates vary, so I would compare the actual release with the latest consensus available immediately before publication rather than treat one forecast as certain.
A further decline could raise concerns about future spending and economic growth. A recovery would suggest that households are becoming more optimistic despite cost pressures. Either result needs context: confidence measures how people feel, while actual spending data shows what they do.
October 28 — The Federal Reserve: the week’s policy pivot
The Fed’s decision and Chair Kevin Warsh’s press conference are the first major market test. The base case entering the week is that rates remain unchanged, which means the statement and the chair’s comments could matter more than the decision itself.
I will listen for three things: whether inflation is still described as persistent, whether policymakers see evidence of cooling demand, and whether the language leaves room for future easing or signals a longer period of restrictive policy.
A steady rate with a balanced message could support risk appetite if markets interpret it as reducing uncertainty. A steady rate accompanied by stronger inflation warnings could still pressure crypto and equities by lifting expectations for tighter policy. An unexpected change would likely produce a more immediate repricing across currencies, bonds and risk assets.
October 29 — Q3 GDP: growth versus expectations
The advance estimate for third-quarter US GDP is scheduled for Thursday. The previous quarter’s growth rate was 2.2% annualized, while a market-calendar estimate puts Q3 growth near 3.2%. That forecast is not the actual result and can change before release.
A stronger-than-expected number could support equities by showing that economic activity remains robust. But if strong growth also reinforces inflation concerns and delays expected rate cuts, the reaction could be less positive for high-risk assets.
A weaker reading could increase recession concerns, even as some investors begin to anticipate a more supportive future policy path. The details matter: consumer spending, business investment, inventories and trade can reveal whether growth is broad-based or concentrated in a few components.
October 29 — PCE inflation: the most important price-pressure check
The September Personal Consumption Expenditures report is the Fed’s preferred inflation measure. The latest published reading, for August, showed headline PCE inflation at 3.4% year over year and core PCE inflation at 3.0%. On a monthly basis, headline prices increased 0.3%, while core prices rose 0.2%.
The September report will show whether those pressures are easing, stabilizing or building again. I would focus on both monthly changes and annual rates, especially core PCE, which excludes food and energy.
Cooler-than-expected inflation could strengthen expectations for a less restrictive policy path. A hotter reading could keep Treasury yields elevated and put pressure on assets whose valuations depend heavily on future liquidity. A mixed result such as softer core inflation but stronger headline inflation would require a more careful interpretation rather than an automatic bullish or bearish reaction.
Consumer spending: is demand still holding up?
August personal spending rose 0.9% month over month, while inflation-adjusted spending increased 0.6%. That was a strong reading, but it also raises a question: can households continue spending at that pace if energy and other living costs remain elevated?
September spending will be released alongside PCE on October 29. Strong spending with cooling inflation would be a constructive combination. Strong spending with persistent inflation could complicate the Fed’s job, while weak spending alongside softer inflation could indicate that economic momentum is fading.
How I will read the reaction across markets
The US dollar, 10-year Treasury yield, Bitcoin, Ethereum, gold and Nasdaq will help reveal how investors interpret the same information.
If inflation cools and yields decline while the dollar weakens, crypto and growth stocks could find support—provided the data does not trigger serious growth fears. If inflation surprises higher and yields rise, the dollar may strengthen while risk assets face pressure. Gold could move differently depending on whether investors prioritize inflation protection, real yields or safe-haven demand.
That is why I will not assume every hot inflation print automatically sends Bitcoin lower or every soft print guarantees a rally. The surprise relative to expectations, the Fed’s response and the market’s positioning all matter.
Three scenarios I am watching
The constructive case: inflation cools, the Fed sounds balanced, and markets interpret GDP as sustainable growth rather than an inflation threat. Lower yields and improving risk appetite could support a recovery in BTC, ETH and the Nasdaq.
The mixed case: the Fed holds, GDP remains solid, but inflation stays sticky. Markets may remain volatile as investors debate whether rate relief will arrive soon enough.
The pressure case: PCE accelerates, the Fed emphasizes inflation risks, or growth weakens more sharply than expected. That combination could unsettle both risk appetite and the policy outlook.
My plan is to compare actual data with consensus, then watch the first market reaction and whether it holds after the initial volatility. I will pay particular attention to Treasury yields and the dollar before deciding whether a crypto or equity move has genuine macroeconomic support.
This is a week for evidence over assumptions. The Fed sets the tone, GDP tests the growth narrative, and PCE measures whether inflation is giving policymakers room to change direction. The most important signal may not be any single number, but the relationship between all three. @Gate_Square
$BTC $ETH $NAS100