





Share your thoughts
placeholder
Article
With this move, I don't even need to think—the account is dancing on its own.

Right after lunch, when I checked the chart, $ZEC had just pulled back to around 610.37. Volume hadn't contracted, and there were buyers waiting below—a textbook pullback that held support. When an opportunity comes, you have to move fast, so I went long immediately.

The candle has now touched 1035.58, with unrealized gains of +4942.73%. That was a satisfying bite of profit—the people on board should all be waking up laughing. Being flat isn't a sin; opening positions recklessly is the mistake. I'll take 75% off
post-image
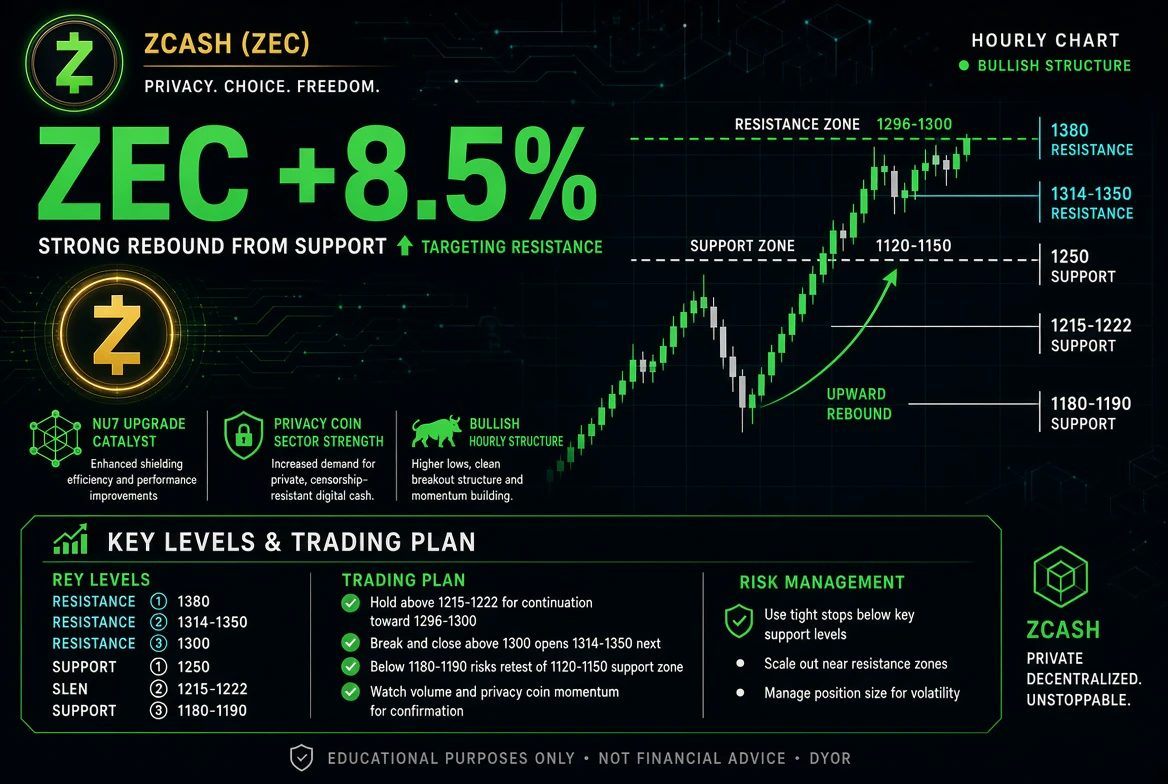
ZEC+5.62%
LAB+0.60%
DOGE+6.65%
#Altcoins relative strength vs bitcoin:native is breaking out
What does this mean?
IYKYK
post-image
BTC+0.35%
  • 2
Layout for Bitcoin, Ethereum, and Dogecoin
live-cover
LIVE2,731
  • 1
Repeated rebounds have been thwarted, and the short-term outlook for $ZAMA has completely weakened.
After multiple failed attempts to hold above the upper price levels, incremental capital has stopped entering, and the market has entered a stock-based game. High-level holders are gradually taking profits and exiting, selling pressure on the order book continues to be released, and indicators reflect weakening bullish momentum, leaving room for a pullback.
Prices continue to probe lower, remaining in a weak range in the short term with intense volatility, and a rebound recovery may occur at an
post-image
ZAMA-2.67%
DOGE+6.65%
Waddle waddle 🐧
$QUOTRON coded
Most traders will fade this ONDO breakout—that’s exactly why 95% confidence scares me.

$ONDO /USDT - LONG

Trade Plan:
Entry: 0.3743 – 0.3761
SL: 0.3665
TP1: 0.3817
TP2: 0.3861
TP3: 0.3926

Why this setup?
- 4H bias is LONG with 95% confidence, but the 15m RSI at 62.07 isn’t overbought—room to run.
- Entry ref 0.3752, TP1 0.3817 (+1.7%), TP2 0.3861 (+2.9%), TP3 0.3926 (+4.6%).
- Daily trend is bullish; SL at 0.3665 keeps risk tight (2.3%).
- Why now? Price is coiling inside 0.3743–0.3761—a compression that typically precedes expansion.

Debate:
If the 1D trend is bullish but RSI is
post-image
ONDO+3.02%
Why is everyone still long HOME/USDT when the 1-day trend just flipped bearish?

HOME/USDT - SHORT

Trade Plan:
Entry: 0.00611 – 0.00613
SL: 0.00622
TP1: 0.00604
TP2: 0.00599
TP3: 0.00592

Why this setup?
- 95% confidence on the SHORT setup—this isn’t a coin flip.
- 4h momentum is fading; RSI on 15m (56.89) is stalling, not confirming upside.
- Price sits at 0.00612, with immediate downside targets at 0.00604 (TP1) and 0.00599 (TP2).
- ATR (1h) is tight (0.000042)—low volatility means the next expansion likely favors the path of least resistance: down.
- Invalidation is clear at 0.0
HOME+2.17%
🇺🇸 US dollar has lost 97% of its purchasing power since the Federal Reserve was created.
A $3 item in 1913 would cost $100 today.
post-image
2026.9.6 Weekend Summary and Review: Growth Is an Inevitable Journey
This week, I made a total of 5 trades, all profitable: long SNDK at 1515 on Monday, long XAU at 4363 and BTC at 76700 on Tuesday, and long Little Nose tree at 0.418 on Wednesday night. It is either profit or loss; the stop-loss has not been triggered, and it is currently in a take-profit state. If you do not want to hold it, simply take profit; on Thursday night, I went long HYPE at 83.68, reduced the position on Friday, and exited with the remaining position at breakeven with a small profit at 84.
The WIF position left over
post-image
SNDK+11.88%
XAU-0.04%
BTC+0.35%
TREE+2.55%
HYPE+2.27%
[$牛来 Signal] Long + 4H bullish continuation
$牛来 current price 0.12198, 4H MACD histogram 0.0053 showing bullish expansion, 1H MACD histogram -0.0004 with the negative value narrowing. 1H rebounded from 0.11173, and the price touched the 4H Bollinger upper band at 0.1215. Order book depth imbalance is -14.11%, Bid/Ask 0.75, with sell-side depth prevailing.
🎯Direction: Long
⚡Entry/Limit order: 0.1216141 - 0.1219800
🛑Stop-loss: 0.1207602
🚀Target 1: 0.1238097
🚀Target 2: 0.1247246
🛡️Trade management:
- Execution strategy: After reaching Target 1, reduce the position by 50% and move the stop-lo
post-image
牛来+43.91%
BTC+0.35%
ETH+1.60%
SOL+1.63%
Most traders will fade this WLD/USDT short—that’s exactly why I’m watching 0.3974 break.

WLD/USDT - SHORT

Trade Plan:
Entry: 0.3964 – 0.3984
SL: 0.4073
TP1: 0.3900
TP2: 0.3850
TP3: 0.3776

Why this setup?
- 4h bias is SHORT (55% confidence)—not a screaming signal, but the range top is rejecting.
- RSI 15m at 51.5 shows zero momentum; we’re coiling under resistance, not above support.
- ATR 1h (0.00413) is tight—volatility is about to expand, and the path of least resistance is down to TP1 at 0.3900.
- Why now? We’re waiting at entry_ref 0.3974 while 1D stays range-bound—this is a sc
WLD+3.79%
Everyone’s watching $MU /USDT for a breakout—but the 4H chart just whispered a secret the crowd missed.

$MU /USDT - SHORT

Trade Plan:
Entry: 1015.38 – 1017.00
SL: 1026.36
TP1: 1008.56
TP2: 1003.48
TP3: 995.86

Why this setup?
- RSI (15m) at 47.92—no momentum spike, just sideways exhaustion.
- ATR (1H) at 3.25 shows shrinking volatility, priming for a sharp squeeze lower.
- 1D trend is *range*—so we’re not chasing; we’re fading the top of the box at 1016.19.
- TP1 at 1008.56 is 0.75% away; TP2 at 1003.48 is the real magnet if 1015 support cracks.

Debate:
Is 1016 the fake ceiling be
MU+0.71%
【$BULL Signal】Funding rate at 0.14%, relatively high; target short-term longs amid 1H high-level consolidation
$BULL Funding rate at 0.1406%, with extremely high long holding costs. After surging to 0.0924 on the 1H timeframe, price fell back to around 0.0816, with buy-side depth imbalance at -12.89% and sell orders slightly dominant. The 4H MACD histogram has contracted continuously, indicating weakening momentum. The 1H MACD histogram is 0.0001, moving along the zero axis. In terms of order-book depth, the Bid/Ask depth ratio is 0.77, indicating average buying support. The current price is n
post-image
BTC+0.35%
ETH+1.60%
SOL+1.63%
$SUSHI Signal】Long pullback stabilizing + short squeeze setup
$SUSHI RSI 1H 73.35, 4H 71.86; the strong zones on both timeframes remain intact. The price fell from 0.2828 to the 0.2452-0.2556 range, with buying repeatedly absorbing the pullback and clear support orders around 0.2466 below.
🎯Direction: Long
⚡Entry/Limit order: 0.248353 - 0.249100
🛑Stop-loss: 0.246609
🚀Target 1: 0.252836
🚀Target 2: 0.254705
🛡️Trade management:
- Execution strategy: Reduce the position by 50% after reaching Target 1 and move the stop-loss up to breakeven. If the price falls back to the entry level, exit aut
post-image
SUSHI+32.79%
MARKET ALERT - GWEI
​4-Hour Timeframe Analysis (4H)
​Condition: The short-term trend is tending upward (bullish recovery). The price is at 0.026826, trading above EMA20 (0.025552) and EMA50 (0.024935).
​Constraint: Rejection occurred right around EMA200 (0.027370), with a fairly long upper candle wick, indicating that selling pressure remains high in that resistance area.
​1-Day Timeframe Analysis (1H / 1D)
​Condition: The long-term trend remains in a dominant downtrend/lower consolidation phase.
​Positive Signal: The price has begun to hold and break above EMA20 (0.024854), but remains far be
GWEI+7.18%
ETH+1.60%
BTC+0.37%
  • 3
  • 1
Omg $ZEC broke out again!🤯🚀 currently 1078!
post-image
ZEC+5.64%
A few days ago, I checked $AKE ’s chart before going to bed. After a series of small bullish candles formed, I chose not to add to my position, but moved up the take-profit level for my long position first. I entered around 0.0129703, and the current price is 0.0183729, giving an unrealized gain of +1022.45%.
Since the area above was a previous high-volume trading zone, I did not close everything at once. Instead, I first closed 70% of the position and moved the take-profit level for the remaining 30% above the entry price, letting it run a little longer.
The difficulty at this level is that t
post-image
AKE+15.33%
ZEC+5.62%
SNDK+1.95%
#BTCReclaims80K BTC Reclaims $80K, Market Confidence Returns
Bitcoin reclaiming the $80,000 level is more than just another move on the price chart. It represents an important psychological milestone for the market, because round-number levels often become powerful areas where traders decide whether momentum is strong enough to continue or whether another correction could begin.
The recovery above $80K shows that buyers are willing to step back into the market after periods of uncertainty. When Bitcoin successfully moves back above a major psychological level, market sentiment can change quick
BTC+0.35%
Load More

Join 40 M users in our growing community

⚡️ Join 40 M users in the crypto craze discussion

💬 Engage with your favorite top creators

👍 See what interests you

View More