Share your thoughts
placeholder
Article
Same name, same identity! Good morning, friends! This is your swing-trading expert, Qingyao, as always! This Monday, let’s briefly discuss the market outlook for the days ahead! This week, global markets are entering a “super central bank week,” and the crypto market is standing at the crossroads of an epic market shift. First, let’s look at the most urgent pressure: According to the CME FedWatch Tool, the probability of a 25-basis-point rate hike in September has surged to 86.2%, and Bitcoin’s $76,380 support is facing a severe test.
My personal view is very clear: Before the rate hike takes
post-image
$ARB some traders left because it has been down since launch, but arbitrum remains fundamentally strong.
buy, hold, or let the Smart Rebalance bot work until the market kicks off again.
patience pays off.
ARB-1.24%
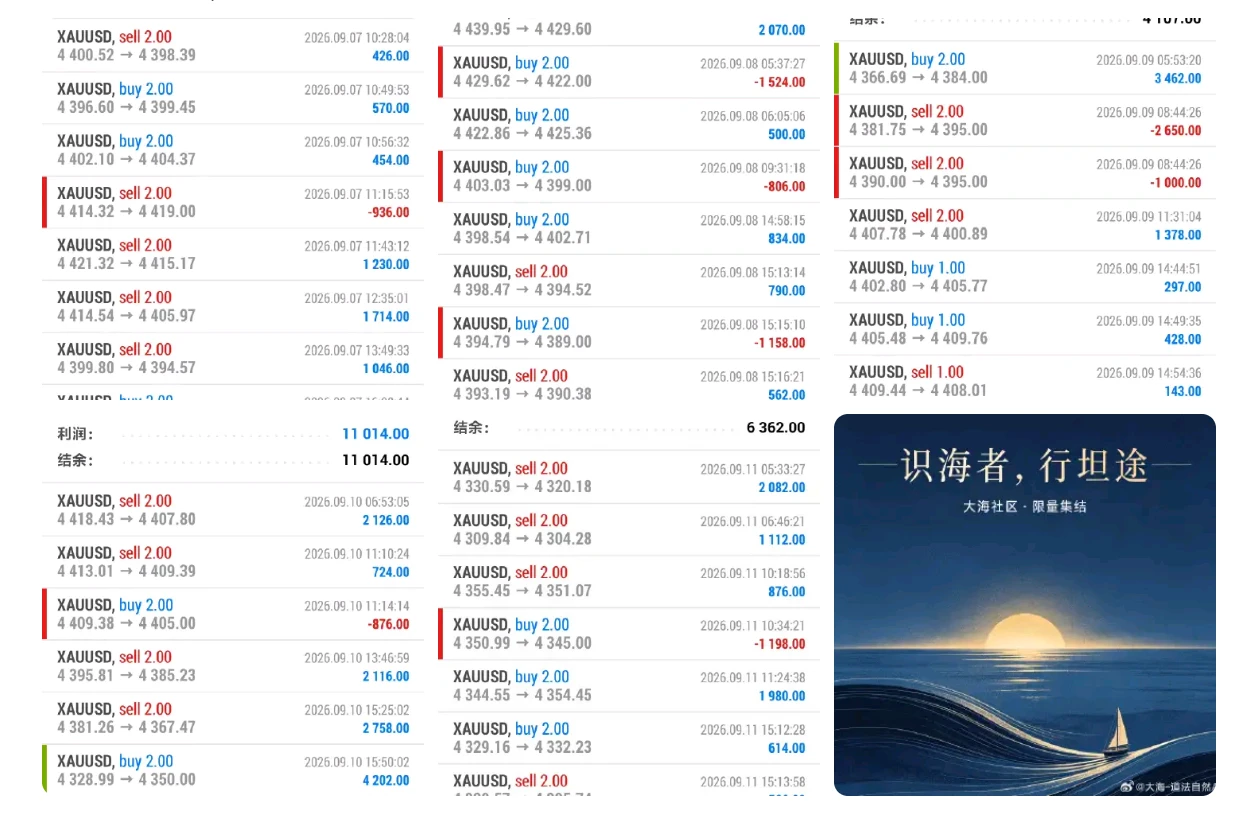
King Wen recognized Jiang Shang, and thus grasped the grand trend of the world;
If you understand the ocean, investing naturally has a smooth path.
The market is like the sea, full of unpredictable twists and turns.
Some drift with the current, while others row against it,
But what we must do is harness the waves and head straight for the vast sea.
The Da Hai Community has officially opened limited enrollment.
We know that true hands-on practice leaves no room for even the slightest perfunctory effort.
To ensure the quality of guidance, participation slots will be strictly limited this time.
W
post-image
XAU-0.54%
#AnthropicPicksNasdaqForIPO
Anthropic Chooses Nasdaq: The IPO That Could Test the Entire AI Market
Anthropic selecting Nasdaq for its potential IPO is one of those developments that deserves much more attention than a simple headline. For me, this is not only about one AI company becoming public. It could become a major test of how much confidence public-market investors still have in the artificial intelligence growth story, how aggressively they are willing to value frontier AI companies, and whether the current AI expansion is developing into a genuine long-term technology supercycle or mo
post-image
With the same 1,000U, going for $MTL now versus chasing other altcoins could lead to completely different outcomes.
$MTL is currently at 0.4124, up 39.37% directly over 24h, surging from 0.2698 to 0.4196, with a trading volume of 57.9 million U. This volume cannot be driven by retail investors; it clearly indicates funds entering to sweep up tokens. But note that the 24h amplitude exceeded 55%, and those chasing the rally have already been trapped once.
Technically: 0.27 is near-term support from the previous low, while 0.42 is short-term resistance. On-chain data shows no large unlock-related
MTL+13.02%
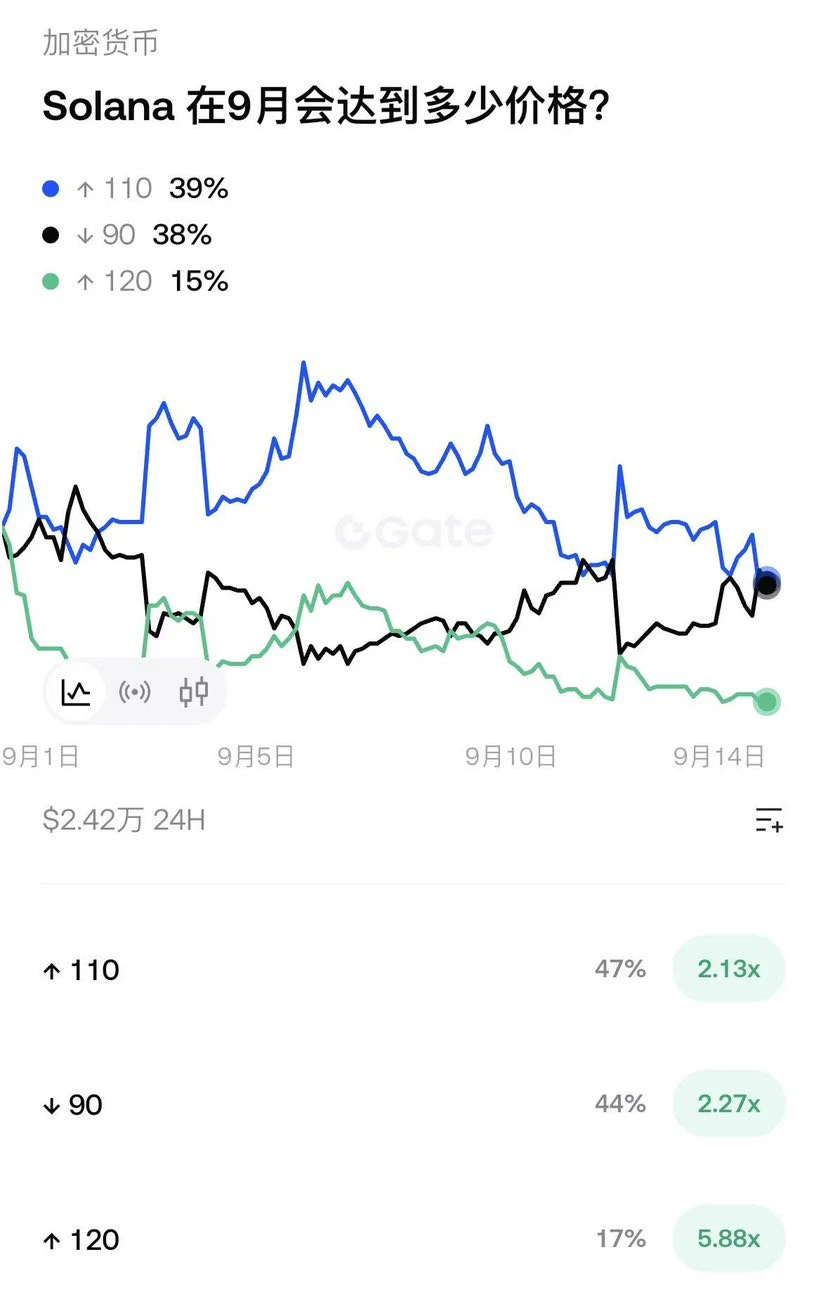
The market lacks a clear consensus, with SOL in a balanced bull-bear structure: the probabilities of an upside move to 110 and a pullback to test 90 are nearly equal; the market is not optimistic about a breakout above 120. Compared with BTC and ETH, Solana has significantly greater divergence and higher volatility risk.
post-image
SOL-0.94%
BTC+0.44%
ETH-0.44%
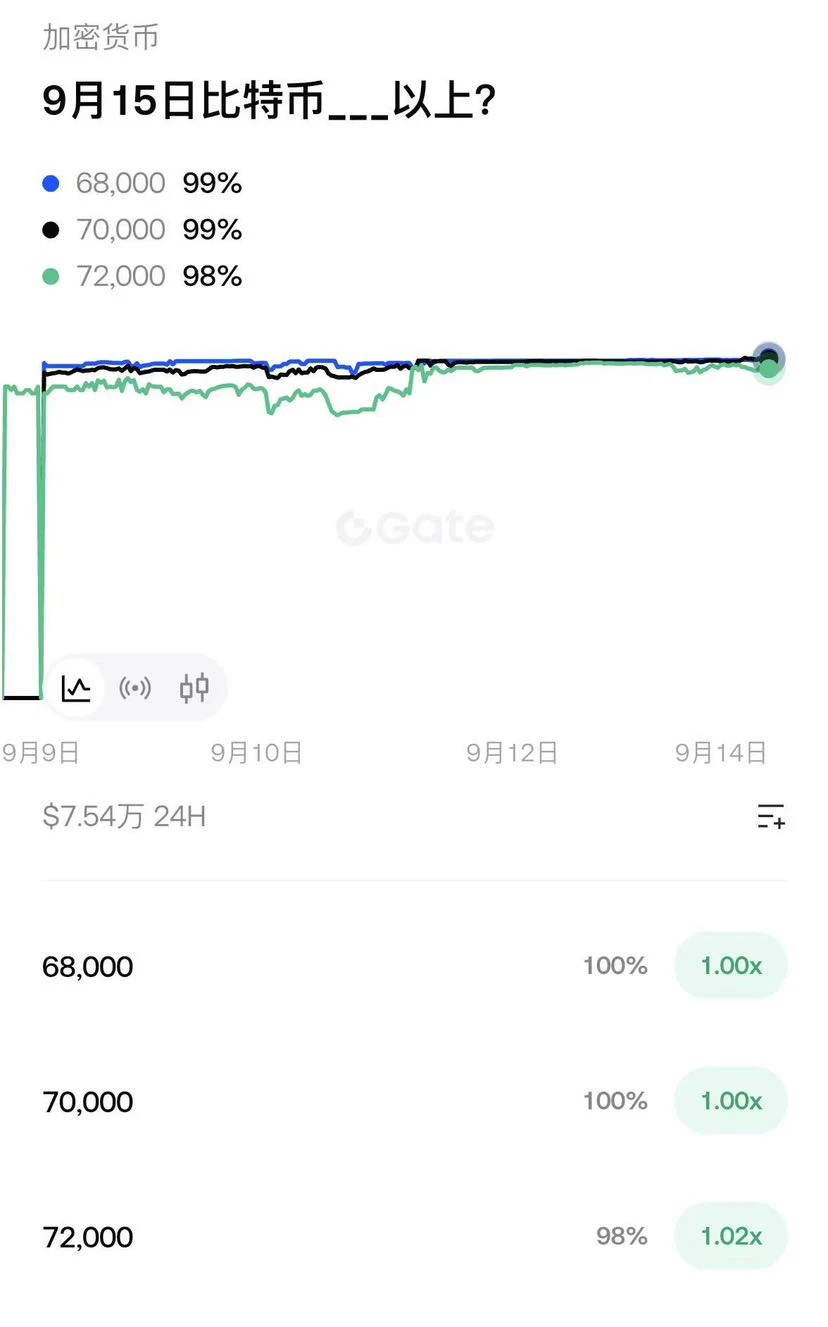
Mainstream prediction market expectations: BTC is highly unlikely to fall back below 70,000 on September 15; there is also a very high probability that the 72,000 level will hold. The market is barely pricing in a deep correction scenario and remains bullish.
post-image
BTC+0.44%
Tong Ge's 9.14 ETH strategy
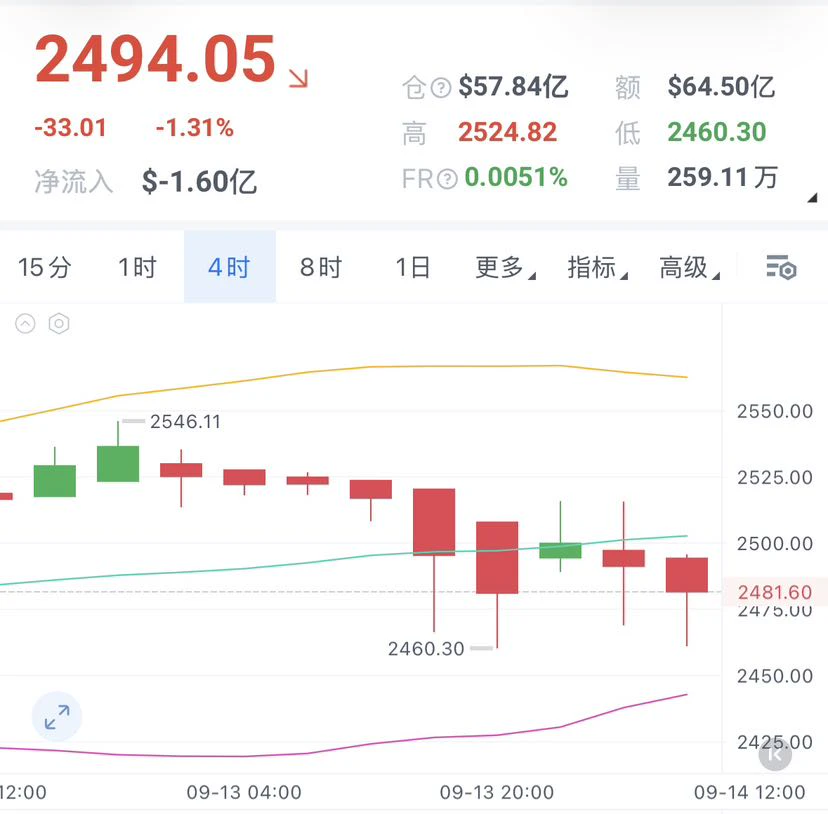
Enter short positions around $ETH 2500-2520, stop-loss at 2540, first target 2460, second target 2430.
The current price is 2493. It just touched a low of 2461, so the first target was essentially reached, then rebounded to 2493, right below 2500. Yesterday, I said 2500 was support, but it broke directly today. After the breakdown, 2500 becomes new resistance on the rebound. If the price cannot break above this level, it is where to re-enter short positions.
2460 below has already been tested once. A further breakdown would target 2430, or even 2400. Do not mistake
post-image
ETH-0.43%
U Jie 9.14 $BTC Morning Strategy
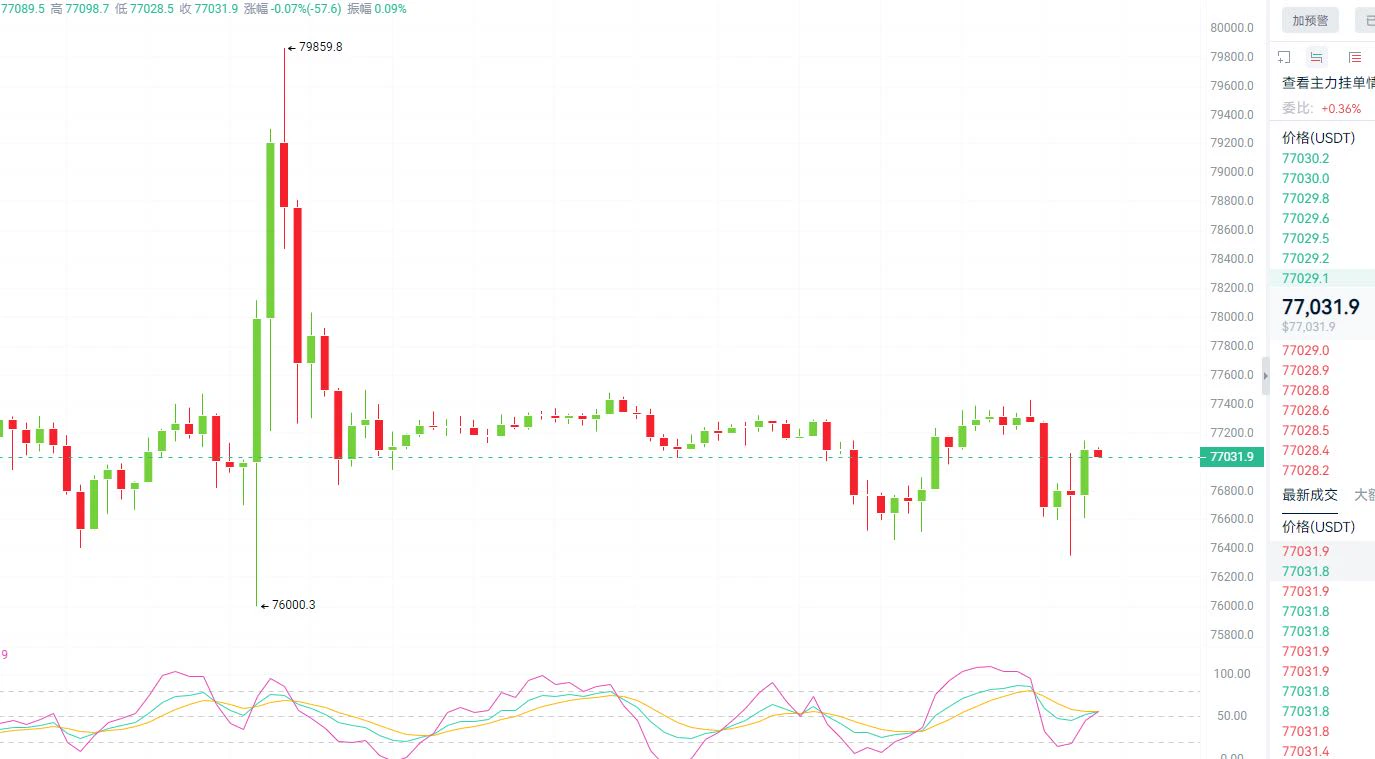
Entry: Short near 77400-77800 on a rebound, stop loss above 78300, targets 76600-76000
The 4-hour chart has formed a double-top pattern. After the previous high of 82282 came under pressure, selling pressure continued to emerge, and the market's center of gravity kept moving lower. The KD indicator has turned down from high levels, and the strength of each rebound by the bulls is weakening, forming a typical structure of rebounds facing resistance.
There are currently two key points on the chart:
①The 77400-77800 area above is the lower boundary of the previo
post-image
BTC+0.44%
Insiders are watching SYMBOL like never before.

$ETH /USDT - LONG

Trade Plan:
Entry: 2505.57 – 2513.15
SL: 2472.99
TP1: 2536.64
TP2: 2554.83
TP3: 2582.11

Why this setup?
Why now? The daily trend is bullish, and the 1h ATR of 15.16 signals enough volatility to fuel a clean move from the entry zone near 2509.36. The 15m RSI at 60.3 shows room to run without being overbought, while the 4h trend alignment adds conviction. TP1 at 2536.64 and TP2 at 2554.83 offer staged profit-taking, but the trade invalidates hard below 2471.23. This is the line in the sand separating a continuation from a fa
ETH-0.43%
BREAKONG: $PENDLE BUYBACK !!
Over 7 months, total buybacks $PENDLE have now reached 2,820,283 $PENDLE , a considerable amount relative to the total supply of 281 million.
Each token is purchased directly from the market and then redistributed to sPENDLE stakers.
What is interesting about $PENDLE:
• Emission has fallen 78% since the beginning of the year
• Annual inflation is only around 0.5%
• YTD buybacks are already approximately 1.5%
This means buybacks are already more than 3x the inflation rate. Emission is falling + buybacks are increasing, so supply pressure in $PENDLE is becoming lo
PENDLE+3.98%
Geniuses usually use both hands. You can’t hold it with just one hand.
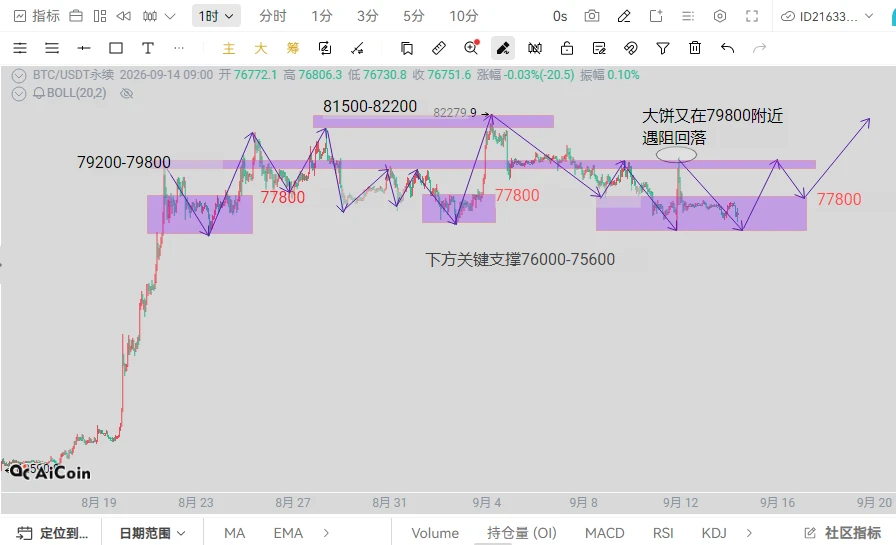
Bitcoin 1-hour chart analysis

BTC is currently in a broad range-bound consolidation pattern. Short-term resistance above is 79200-79800, where multiple rebounds have been rejected and pulled back; stronger resistance above is 81500-82200.
Support below: 77800, the lower boundary of the range; stronger support is 75600-76000.
The current price is 76751, trading in the lower-middle part of the range. A rebound to around 79800 is likely to face selling pressure and pull back. Until there is an effective breakout, maintain a range-bound approach.

BTC short-term trading strategy

Try shorting
post-image
BTC+0.44%
Crypto Market trends
live-cover
LIVE1,033
FOMC showdown!
This week's U.S. stocks + central bank events—be sure to keep a close eye on 🚨
This is a super central bank week, with multiple major events set to unfold in quick succession, posing a significant impact on the crypto market. The key focus is the Fed's FOMC rate decision, dot plot, and Powell's press conference in the early hours of September 17, which will determine whether this is a one-off rate hike or the start of a new rate-hike cycle, directly affecting the dollar, U.S. Treasuries, and crypto markets.
Key U.S. economic data on retail sales, employment, manufacturing, and
BTC+0.44%
ETH-0.43%
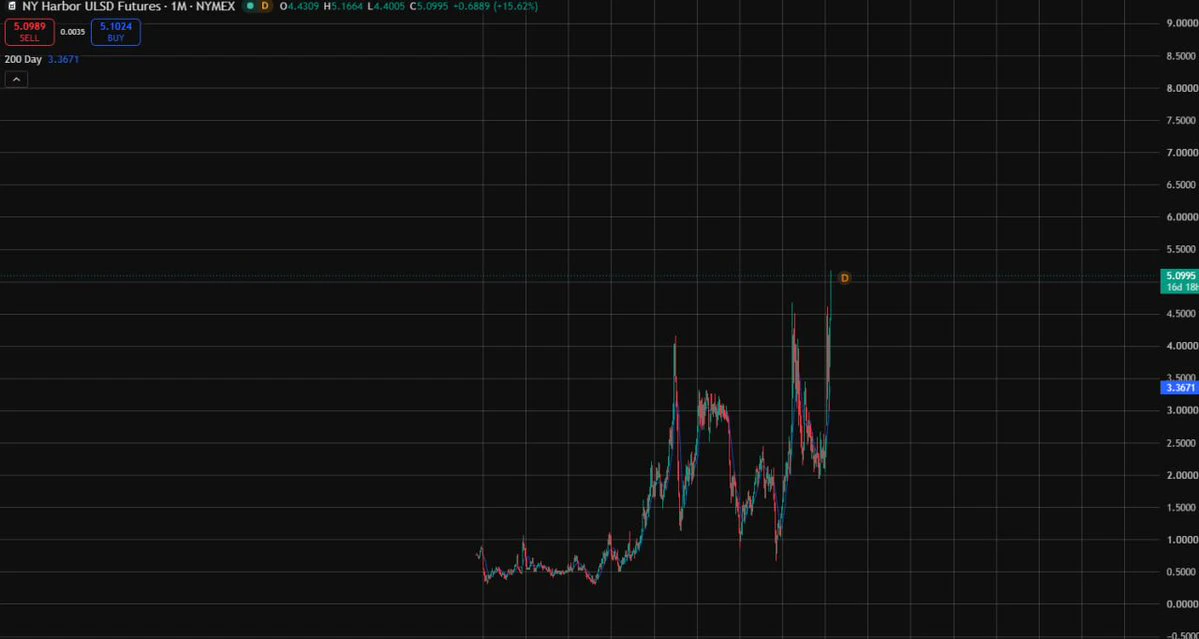
higher diesel, no trucks on the road, no food coming in, farmers begin going out of business. this is a collapse in the global economy waiting to happen.
folks, please hold physical gold. this is not normal, we can't sustain this.
post-image
XAU-0.54%
[New Streamer]Crypto Trading Market
live-cover
LIVE738
There are definitely plenty of people calling for a crash these past two days—I know your fingers are itching too, but you’re afraid of catching it halfway down. But whether you should buy this week depends not on your courage, but on your position size: the standout performer on my list has only 1% left in its futures core position.
The core position I placed at 76,700 last week has now been exited at breakeven. Only those who avoided the entire grind down still have bullets in hand to wait for the crash.
This is what I look for when choosing people: there are opportunities being shouted ever
post-image
BTC+0.44%
ETH-0.43%
#8月核心CPI超预期 The CPI “shoe” has dropped—why did gold fall first and then rebound?
In early Asian trading on September 14, spot gold was trading around $4,330 per ounce, extending the volatile pattern following Friday’s CPI data.
The US August CPI data released last Friday (September 11) produced one of the most dramatic episodes in the recent gold market: gold prices initially plunged after the data was released, but then quickly surged, with spot gold jumping $110 intraday to set a new daily high of $4,400.81 per ounce.
Why did a “hawkish” inflation report fail to crush gold? CPI data: Headlin
post-image
XAUUSD-0.36%
  • 2
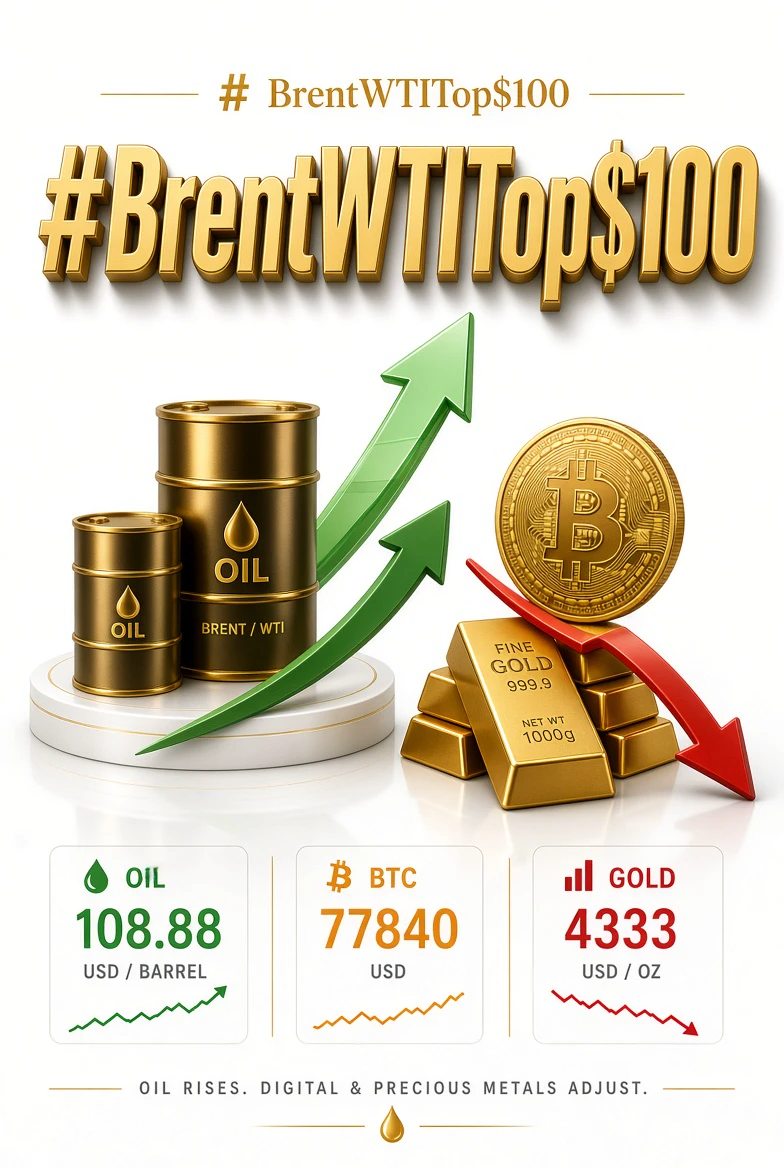
#BrentWTITop$100
$XBRUSD $BTC $XAUUSD
The market is entering Monday with a very unusual cross-asset signal: oil is accelerating while Bitcoin and gold are weakening ahead of the Federal Reserve decision. Brent is trading around $108.88 in the latest market snapshot, firmly above the psychological $100 level, while BTC is around $77,840 and gold near $4,333. This is not simply three unrelated price moves. It is a developing macro trade where energy inflation, Treasury yields and expectations for a hawkish Fed are influencing different asset classes in opposite directions.
The oil move i
post-image
XBRUSD+3.04%
BTC+0.44%
XAUUSD-0.36%
Load More

Join 40 M users in our growing community

⚡️ Join 40 M users in the crypto craze discussion

💬 Engage with your favorite top creators

👍 See what interests you

Trending Topics

AnthropicPicksNasdaqForIPO

71.68k Views2.58k Discussing

The related rumor has heated up valuation discussions around unlisted AI companies and also linked SpaceX's secondary-market performance with primary-market sentiment. However, it remains an unconfirmed market rumor for now.

Gate 24H Futures Open Interest Tops $11.479B

4.03k Views113 Discussing

Korea Stocks Plunge 3.14% at Open

43.94k Views4.77k Discussing

View More