Square
Following
Hot
News
Profile
Share your thoughts
placeholder
Article
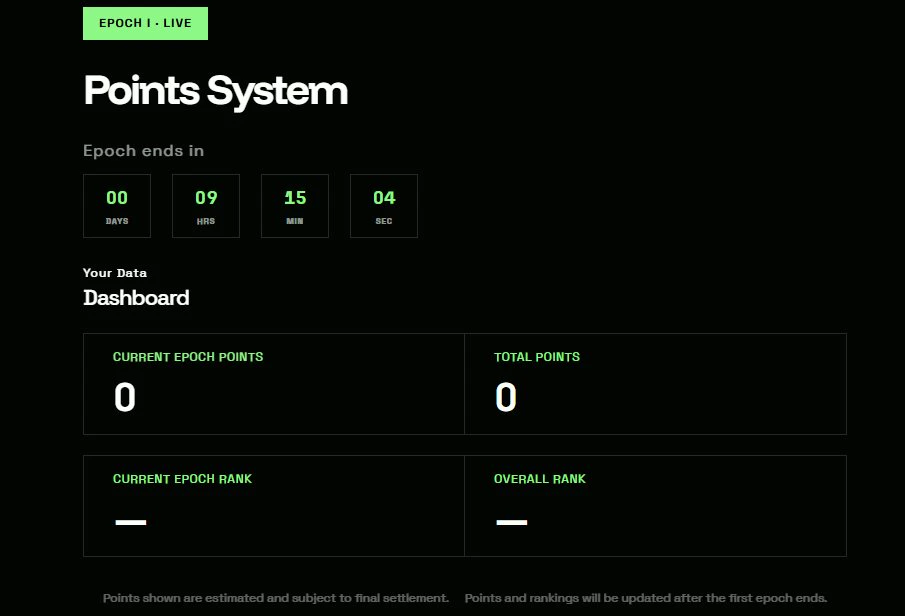
First week point drop for @TxFlow_L1 coming in less than a day!
Also season 0 points drop shouldn't take much longer...
Exciting week coming up!
You're still early btw. Best perks + free discord access:
Let's get it!
post-image
The easiest mistake in trading is to mistake a “low-volume recovery” for the “start of a reversal.”

Reviewing today’s ETH trade: entered short at 2425-2445, with the high precisely touching 2428 before price fell all the way to the current low of 2366, delivering the expected 62-point move.
Why short at this level? Because the chart was clear: yesterday’s nearly 100-point dump was followed only by an oversold recovery after the sharp drop, with no fresh capital coming in to drive it higher. And with BTC failing to make a move, 2425-2445 was a solid resistance zone above ETH.

Those who trad
BTC-0.39%
ETH-1.70%
SOL-1.69%
Trenches
AGT
A
bade
b
AGT
0x5d...e274
Market Cap
$.
Change
.
24h Vol
$.
Holders
.
CNPY
C
bade
b
CNPY
0xc6...ddd2
Market Cap
$.
Change
.
24h Vol
$.
Holders
.
TSI
T
bade
b
TSI
0xa8...1c1e
Market Cap
$.
Change
.
24h Vol
$.
Holders
.
Gato
G
bade
b
Gato
55A3...pump
Market Cap
$.
Change
.
24h Vol
$.
Holders
.
hi
h
bade
b
hi
0x8a...a7f7
Market Cap
$.
Change
.
24h Vol
$.
Holders
.
#美股存储板块跌幅扩大
The core question is whether this represents a healthy correction following a rally driven by artificial intelligence (AI), or the beginning of a deeper repricing process within the storage sector. Rather than buying simply because prices have fallen, it would be more prudent to focus on earnings expectations, memory pricing, and whether each company can maintain its profit margins.
My perspectives on storage sector stocks:
* Micron (MU): Monitor demand for DRAM and HBM, memory growth linked to AI, and gross profit margin forecasts. Strong AI demand could bolster earnings, though
post-image
MU-5.66%
SNDK-6.90%
Tesla Roadster Ignites Meme Craze, FTR Briefly Doubles
The Tesla Roadster has once again become a market focus, with discussion around its flying car concept rapidly heating up and sparking a wave of Meme coin speculation in the crypto market. FTR surged sharply in a short time, drawing the attention of many traders as the market began searching for the next token that could take the baton as a hot topic.
The rally is driven not entirely by project fundamentals, but by sentiment trading fueled jointly by the tech narrative, social media buzz, and short-term capital. For Meme coins, a topic wit
TSLA-2.17%
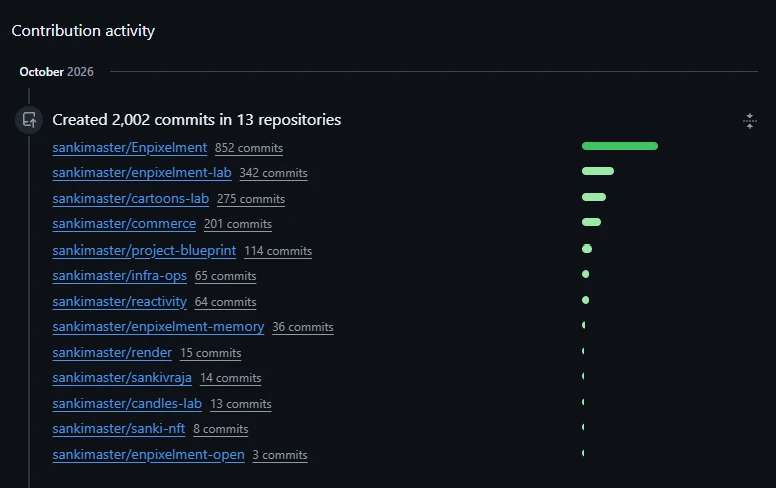
October isn't over yet, and we've already crossed 2,000 commits across 13 repositories!
Building nonstop. The SANKI & ENPIXELMENT ecosystems keep growing! 🚀
#solobuilder #vibecoding
post-image
What catches people’s eye is what stands out and makes them take notice.
post-image
#每周来晒 #美国9月PPI大超预期 The week after the double inflation beat: what the market actually did
Two hot inflation reports landed in two days, and the verdict is in. Stocks fell, bonds steadied, the Fed odds cooled and Bitcoin held its ground. Here is the final scorecard as of Sunday, October 18, followed by an if-then framework for next week.
What the data said
September CPI rose 3.7% against 3.6% expected, and producer prices rose 1.3% on the month and 6.3% on the year. The surprise sat in the details, since core PPI rose 0.7% against a 0.3% forecast.
How each market responded
US stocks: tech took
post-image
BTC-0.42%
MU-5.66%
AMD-5.98%
GLD-0.16%
US500-1.06%
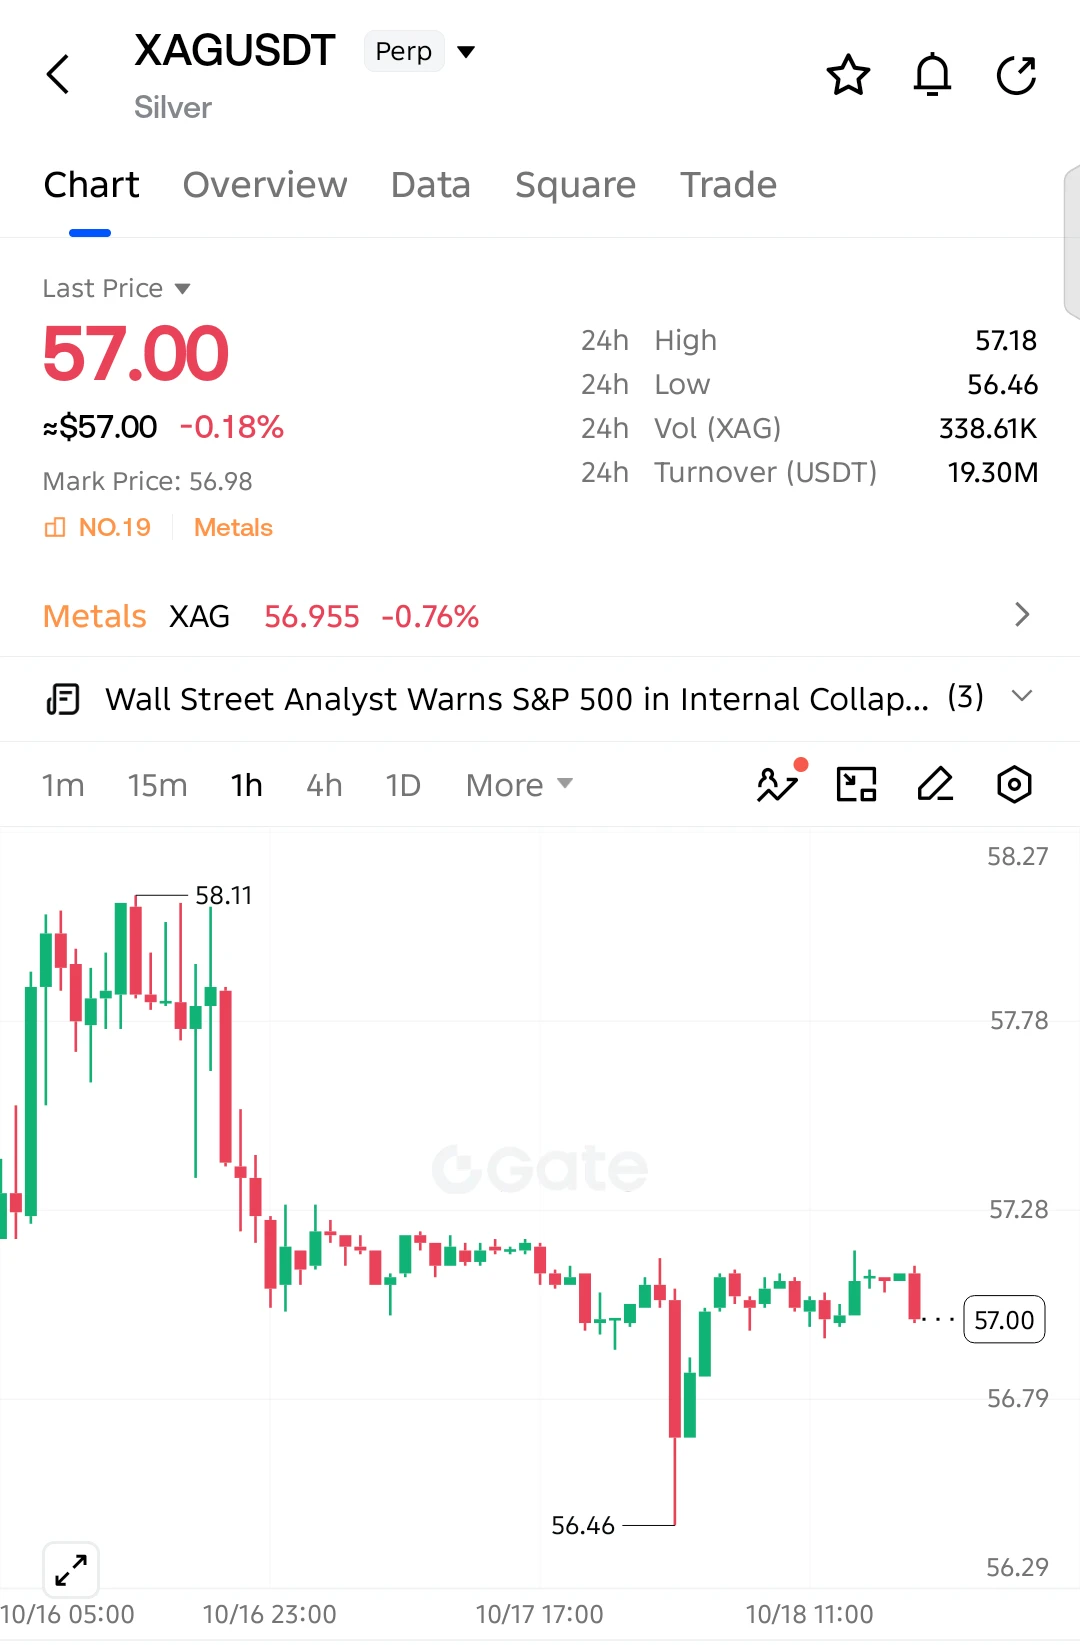
$XAG SHORT SETUP 📉
Entry: 57.10 – 57.20
SL: 57.40
TP1: 56.80
TP2: 56.46
TP3: 56.20
1H bearish structure. Watch for rejection at resistance before entry.
post-image
XAG-0.19%
  • 5
  • 1
$aria #aria r we gud ?
small delay in the process
ARIA+29.03%
$SAND #SAND
Falling Wedge already broken on 1W Chart.
Slight pump with rising vol could provide a solid bullish trend during coming weeks✍️
SAND-4.04%
#美国9月PPI大超预期 #ShareWeekly
Writing
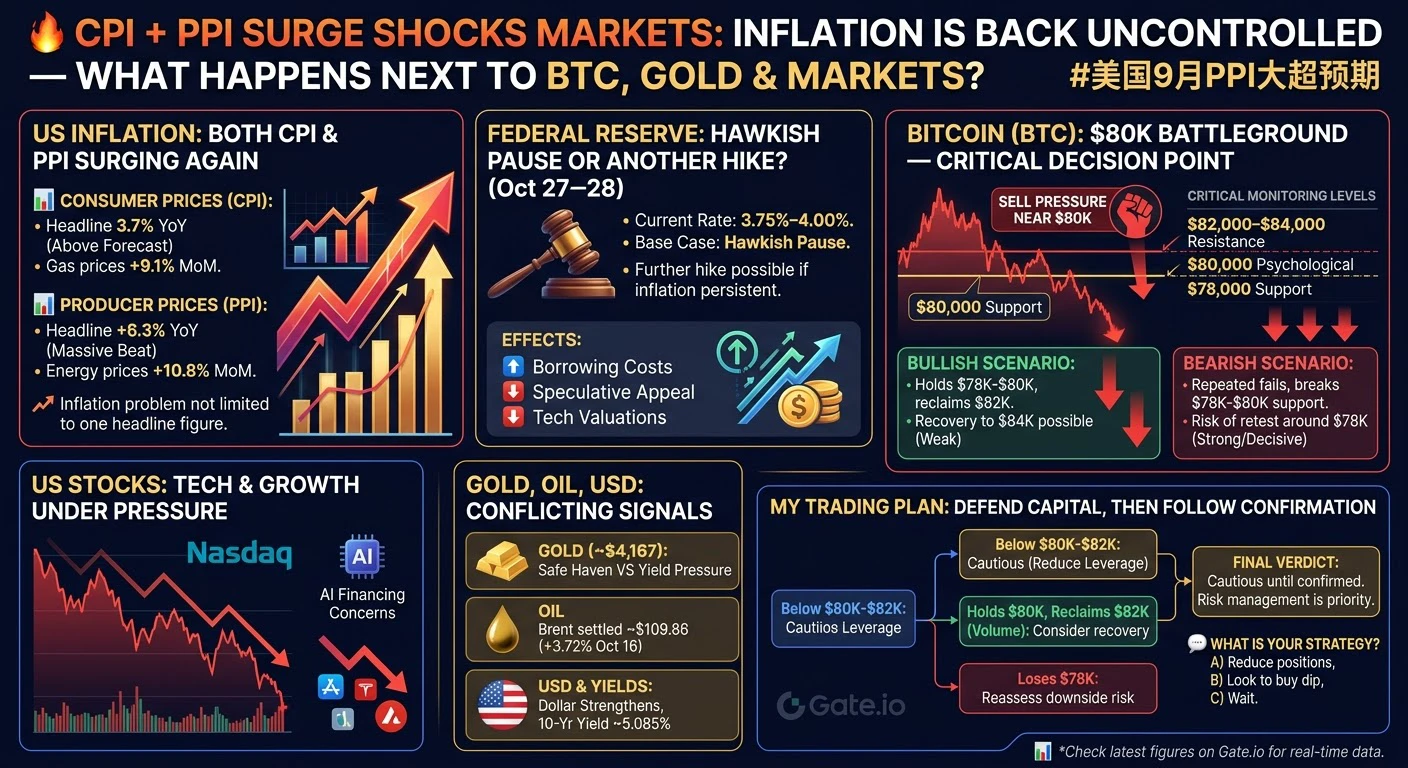
🔥 CPI + PPI SHOCK: INFLATION IS BACK IN CONTROL — WHAT HAPPENS NEXT TO BTC, GOLD
The market is facing a serious macroeconomic test. September inflation came in hotter than expected, producer prices surged, technology stocks weakened, and Bitcoin came under pressure near the $80,000 region.
But this is not simply a bearish market. It is a battle between persistent inflation, Federal Reserve policy, liquidity, institutional positioning, and safe-haven demand. The next move will depend on how these forces interact.
Let's break down the numbers, market structur
post-image
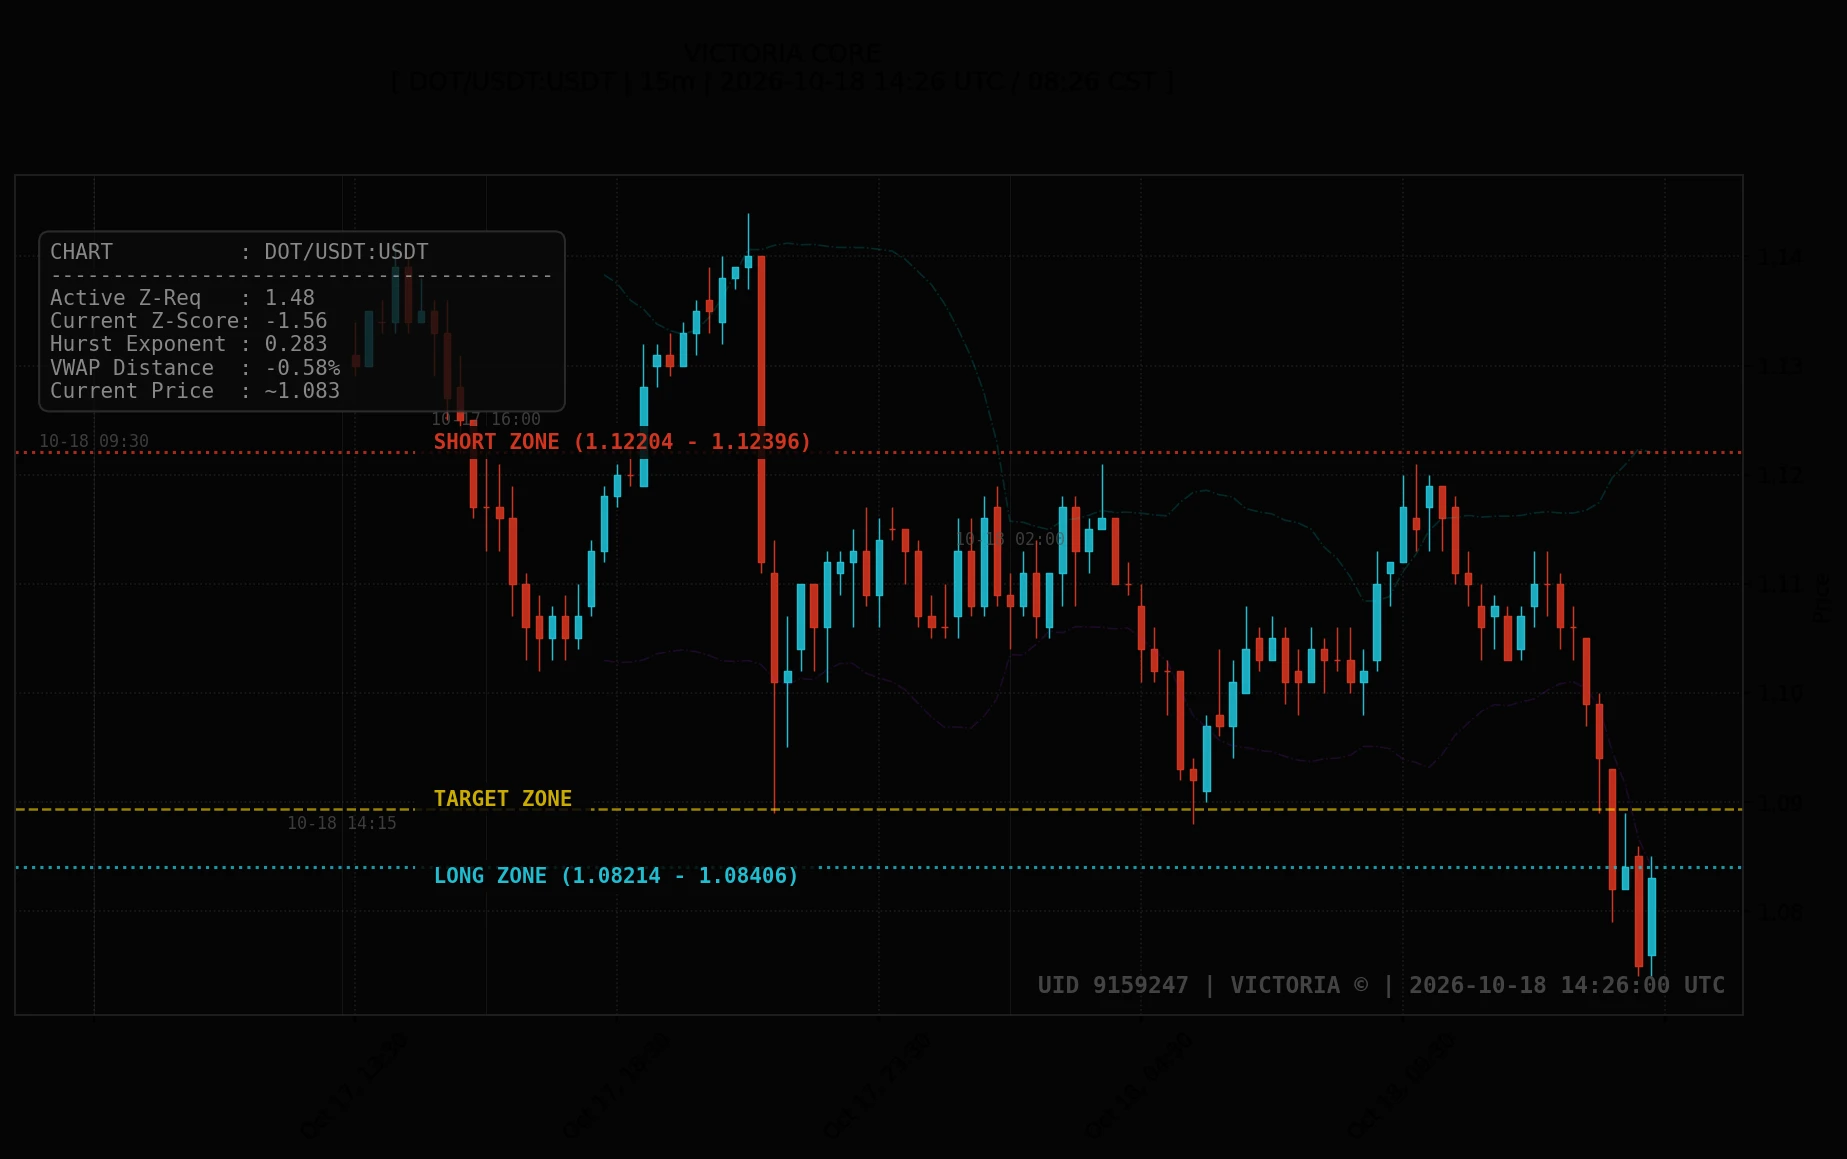
2026-10-18 14:26 UTC. DOT/USDT flushed down to test demand at 1.074 USDT and now rests at ~1.083 USDT inside its lower support zone, coiling for a recovery attempt toward its mean. Actionable levels sit at the SHORT ZONE (1.12204 - 1.12396 USDT), the LONG ZONE (1.08214 - 1.08406 USDT), and the TARGET ZONE (~1.08933 USDT).
NEAR/USDT also holds a clean structure (SHORT: 5.0232 - 5.03393 USDT | LONG: 4.80066 - 4.81139 USDT | TARGET: ~4.90179 USDT), alongside FIL/USDT (SHORT: 1.07141 - 1.07312 USDT | LONG: 1.03593 - 1.03764 USDT | TARGET: ~1.04784 USDT).
post-image
DOT-4.73%
FIL-6.74%
#美股存储板块跌幅扩大 Friday's session gave me a clear answer on how deep this storage selloff really is, so I rebuilt my sector notes from the numbers. Here is where I stand after the close on October 16.
The damage is big. Micron fell 5.63% on Friday and 14.6% on the week, while SanDisk dropped 6.85%, Western Digital about 7% and Seagate more than 7%, with the storage chip index down 17.6% on the week. SanDisk closed at $1,299.30, its seventh lower close between October 8 and October 16. Against its June high close of $2,335, that is about 44% lower by my math.
The bigger picture is even harsher. Six
post-image
MU-5.66%
STX-7.45%
INDEX-17.72%
  • 1
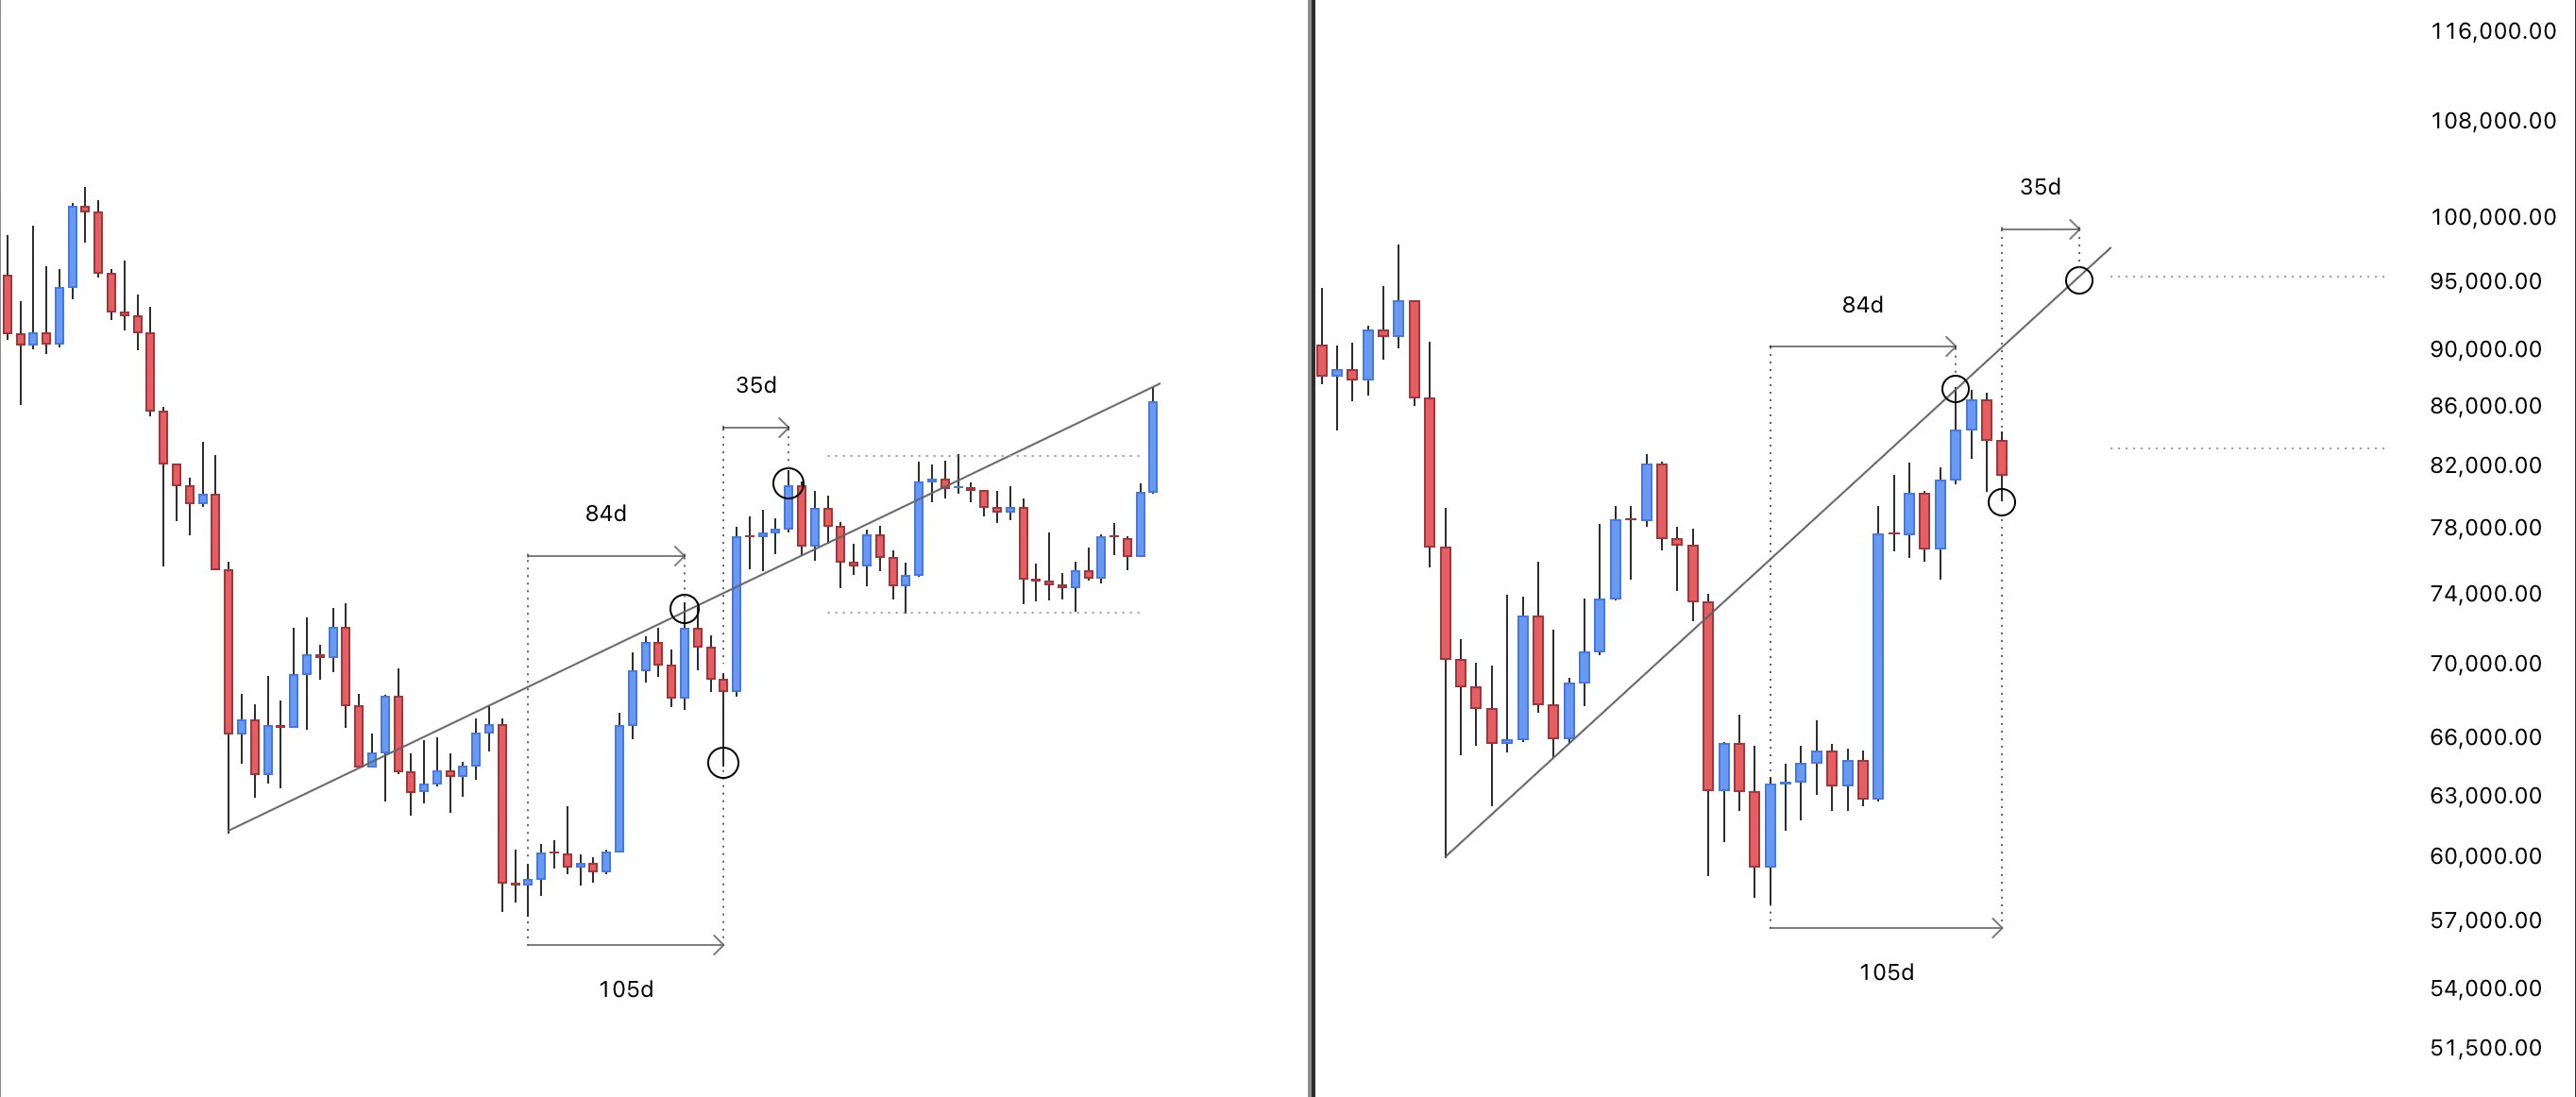
$BTC Price is following the same time pattern as the early stages of the previous bull market.
If this correlation continues, price could push higher over the next 35 days.
post-image
BTC-0.39%
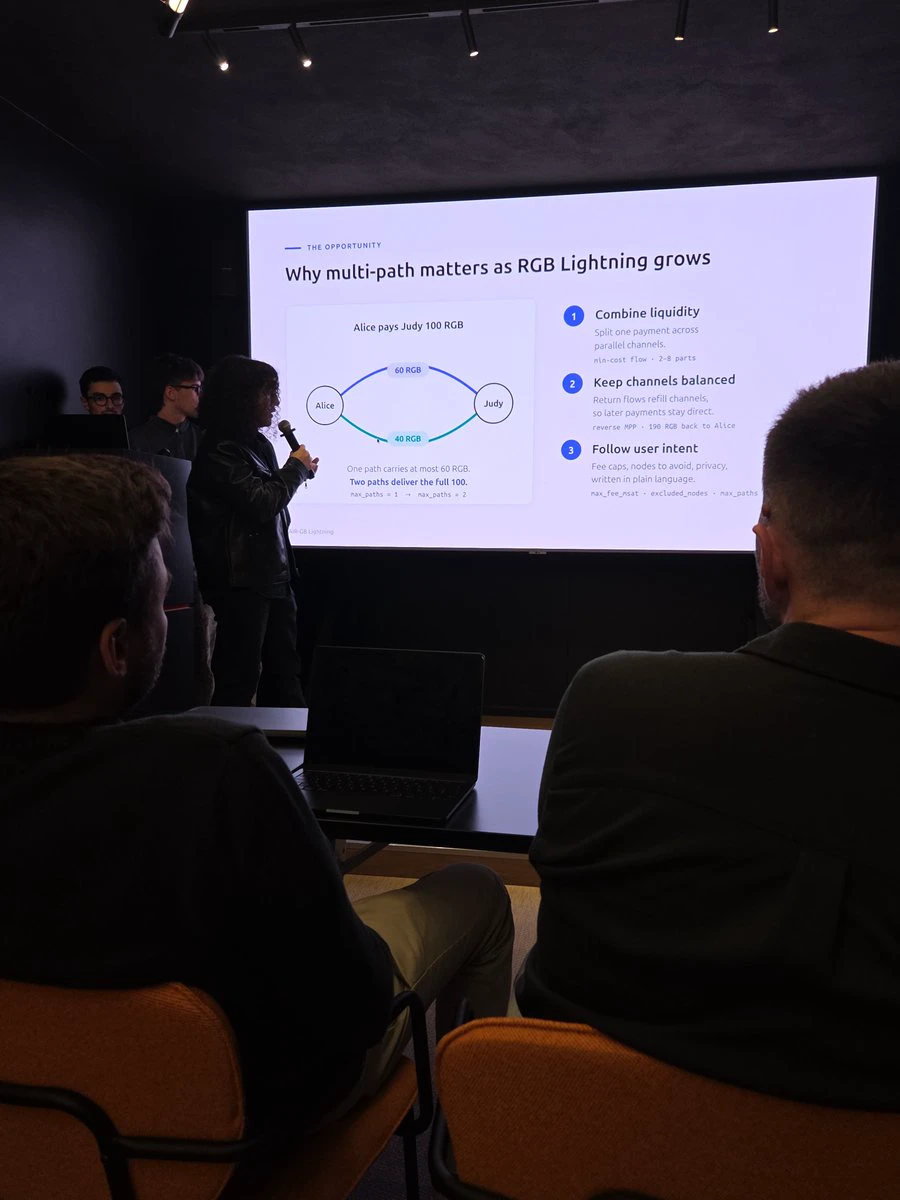
One the RGB presentations.
post-image
[New Streamer] Whales Moves in Sync!
live-cover
LIVE1,559
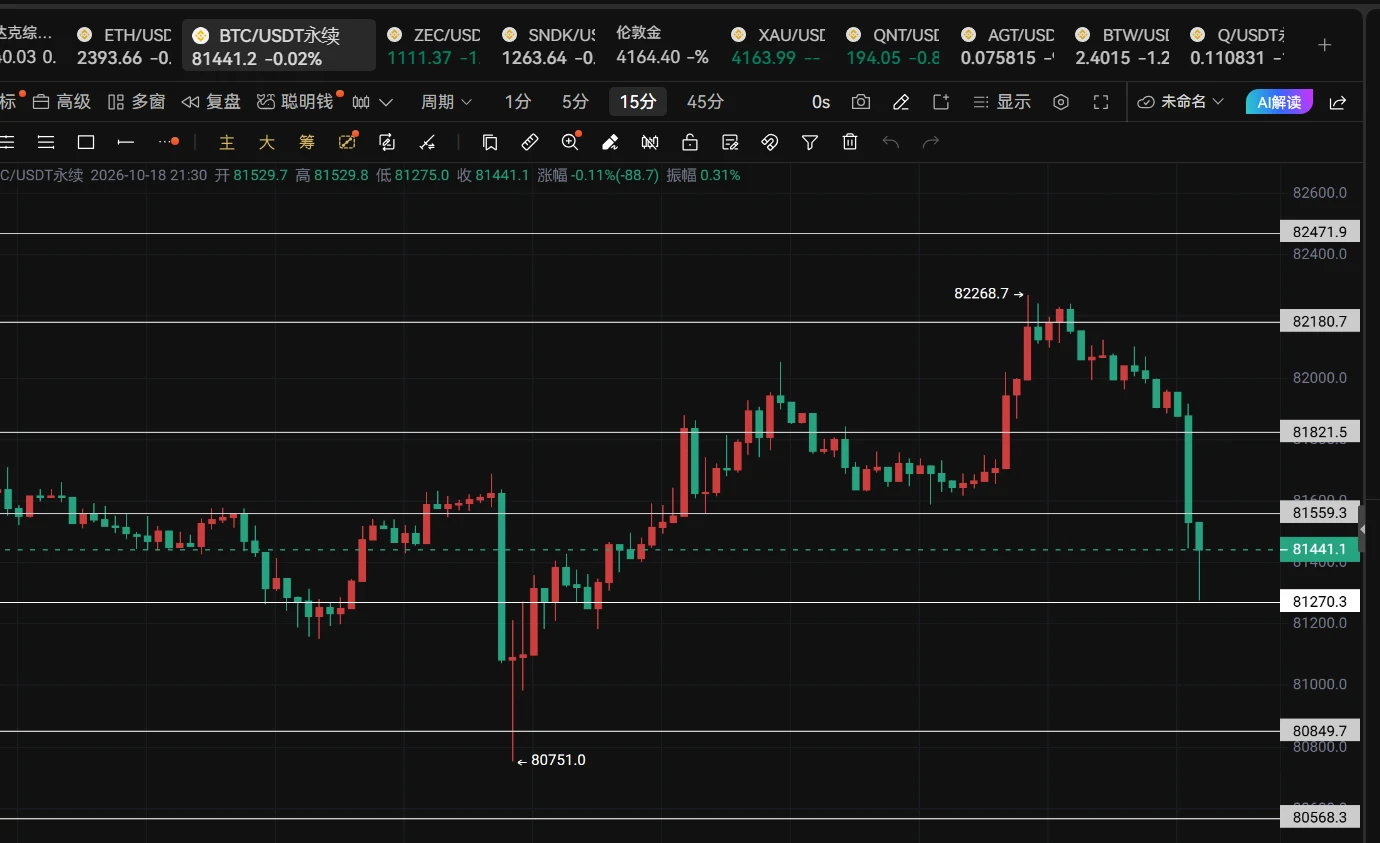
Is BTC still seeing such big swings over the weekend?
Two levels are key: one is 80849, the strong support level hit over the past few days.
The other is 82180, the level where BTC’s latest decline found a bottom.
It’s been moving within this range over the weekend, yet has swung back and forth by over 2,000 points. Truly rare.
Trading suggestion:
You can look to go long near 80800——81300.
Pay close attention to 80849!
Build your position in batches and set your stop-loss. $BTC ‌#Gate两大币种合约成交额跻全球前三
post-image
BTC-0.39%
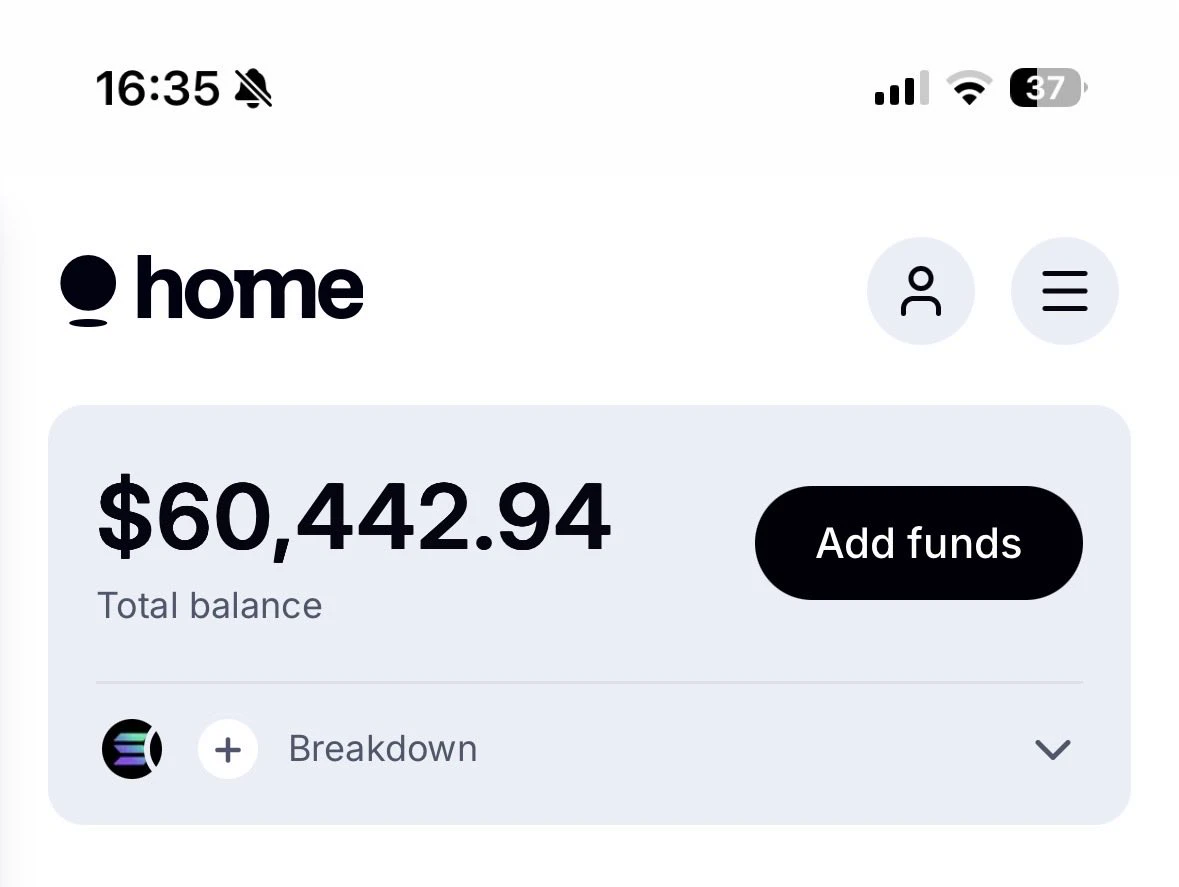
Just found this sitting in one of my Privy accounts
No way.
Go check yours :
post-image
crypto gainers and lossers signals
live-cover
LIVE2,529
Load More

Join 40 M users in our growing community

⚡️ Join 40 M users in the crypto craze discussion

💬 Engage with your favorite top creators

👍 See what interests you

Trending Topics

USSeptemberPPIBeatsExpectations

91.35k Views1.93k Discussing

US September PPI came in at 6.3% YoY, well above the 5.3% market expectation, pointing to renewed producer-side inflation pressure. Weekly jobless claims were 199K, broadly in line with forecasts. Could hotter inflation further reduce room for rate cuts, and what does it mean for $BTC, US stocks, and gold?

GateWCTCS9GlobalTradingCompetition

37.87k Views6.79k Discussing

GateBTCAndETHFuturesVolumeRanksTop3

53.8k Views1.9k Discussing

View More