
Square
Following
Hot
News
Notifications
Profile
Share your thoughts
placeholder
Article
Straight to the point:
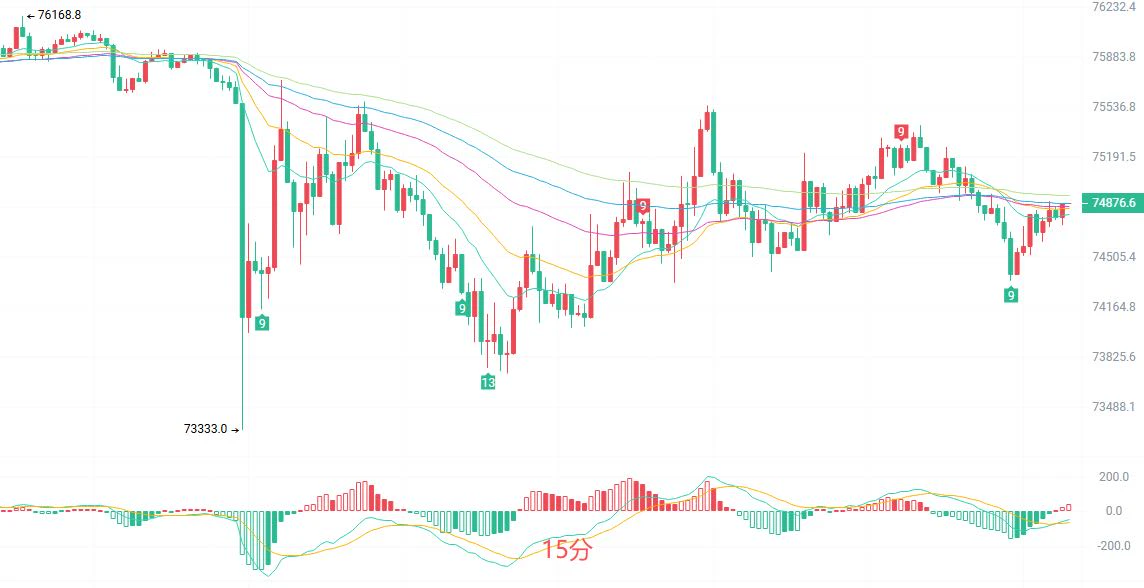
2-hour timeframe: EMAs are in a fully bearish alignment. The MACD red histogram bars have extended to 127.7, signaling a brake on the bearish move, not a bullish reversal. The BOLL middle band at 74898 is pressing right overhead.
15-minute timeframe: A small-scale golden cross, TD 1, and five moving averages tangled between 74784–74929; wait for a direction.
Trade reference:
Try a long: If price pulls back to 74400–74450 and holds, go long; stop-loss at 74150, targets at 75200–75800.
Try a short: If a rebound to 75500–75800 is rejected and closes bearish, go short; stop-
post-image
ETH-1.23%
$1INCH Now heavily shorting, then buying at $0.04354; short entry price: 0.07670 $1INCH 👇
post-image
1INCH-0.84%
Trenches
牛逼
牛
bade
b
牛逼
0x96...7777
Market Cap
$.
Change
.
24h Vol
$.
Holders
.
PIEVERSE
P
bade
b
PIEVERSE
0x0e...25a9
Market Cap
$.
Change
.
24h Vol
$.
Holders
.
STONK
S
bade
b
STONK
6GmA...UNgx
Market Cap
$.
Change
.
24h Vol
$.
Holders
.
ON
O
bade
b
ON
0x0e...1d48
Market Cap
$.
Change
.
24h Vol
$.
Holders
.
FLOAT
F
bade
b
FLOAT
Bv1a...BMmr
Market Cap
$.
Change
.
24h Vol
$.
Holders
.
GPT-5.6 Cyber enters AWS GovCloud; approval doesn’t mean access
On November 4, OpenAI announced that Daybreak Red is now available in AWS GovCloud (US East). Approved customers can use GPT-5.6 Cyber through Amazon Bedrock for authorized cybersecurity work. This extends the same capabilities to a government cloud region, after Daybreak models became available on Bedrock.
【Daybreak Red approval is not enough; AWS access must be enabled separately】
Access requires clearing two gates: OpenAI approval for Daybreak Red and enablement on the AWS side. The official notice states that Daybreak Red appr
post-image
Go long, go long, hold for three days and steadily rake in profits
post-image
Images 2.6: Faster generation, plus GIFs, finer editing, and API controls
OpenAI released Images 2.6. The announcement says image generation is faster, with new GIF creation, more precise editing, and new API controls; it is available across ChatGPT, Codex, and API. The date in official materials is 2026-11-04.
【Three entry points move to 2.6 at once】
This is not just adding a new model name to the chat window. The announcement brings the same Images 2.6 to ChatGPT, Codex, and API. Whether generating images in chat, inserting images while coding, or connecting to the API to generate images, th
post-image
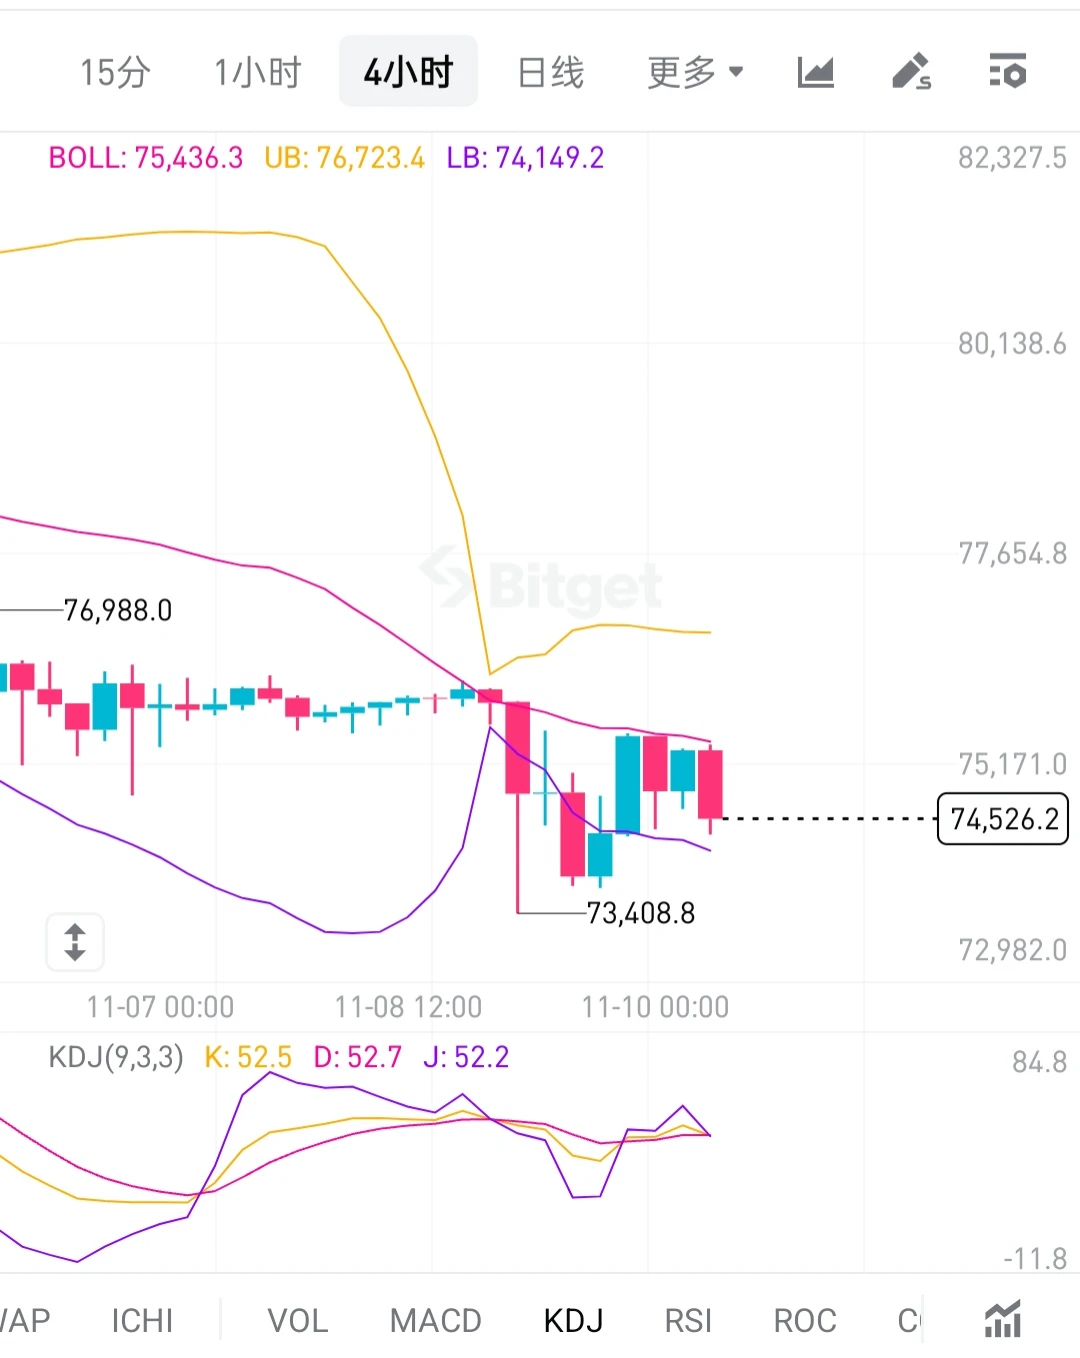
11/10 Midday Bitcoin:

On the 4-hour chart, the current price is trading between the middle and lower Bollinger Bands, in a low-range consolidation following a sharp drop. The previous low around 73400 remains key support below, while the middle band around 75430 is the first short-term resistance.

The three KDJ lines are converging near the midpoint, with no clear golden or death cross signal. This indicates that short-term buyers and sellers are temporarily locked in a stalemate; the rebound is limited, and no stable structure has emerged yet. Watch support and resistance levels; expect ran
post-image
BTC-0.67%
[New Streamer] Market Prediction
live-cover
LIVE1,554
MArket Updates About BTC ETH ZEC SOL ,,,,,
live-cover
LIVE1,798
I’ll be livestreaming at 9:30 tonight. I should be able to cover everything in about an hour.

I’ve been watching short dramas lately. *Armed Entry into the Song Dynasty* has racked up 12 billion views worldwide. It was made by more than 30 ordinary people from Xinxiang, Henan, including stay-at-home moms and taxi drivers.

I was curious what kind of drama was so popular. There are ten seasons in total, and I’ve watched four. I really have to admire it: the content is historically accurate, packed with references and deeply rooted in Chinese culture. Even I’m struggling to keep up.

The barrie
post-image
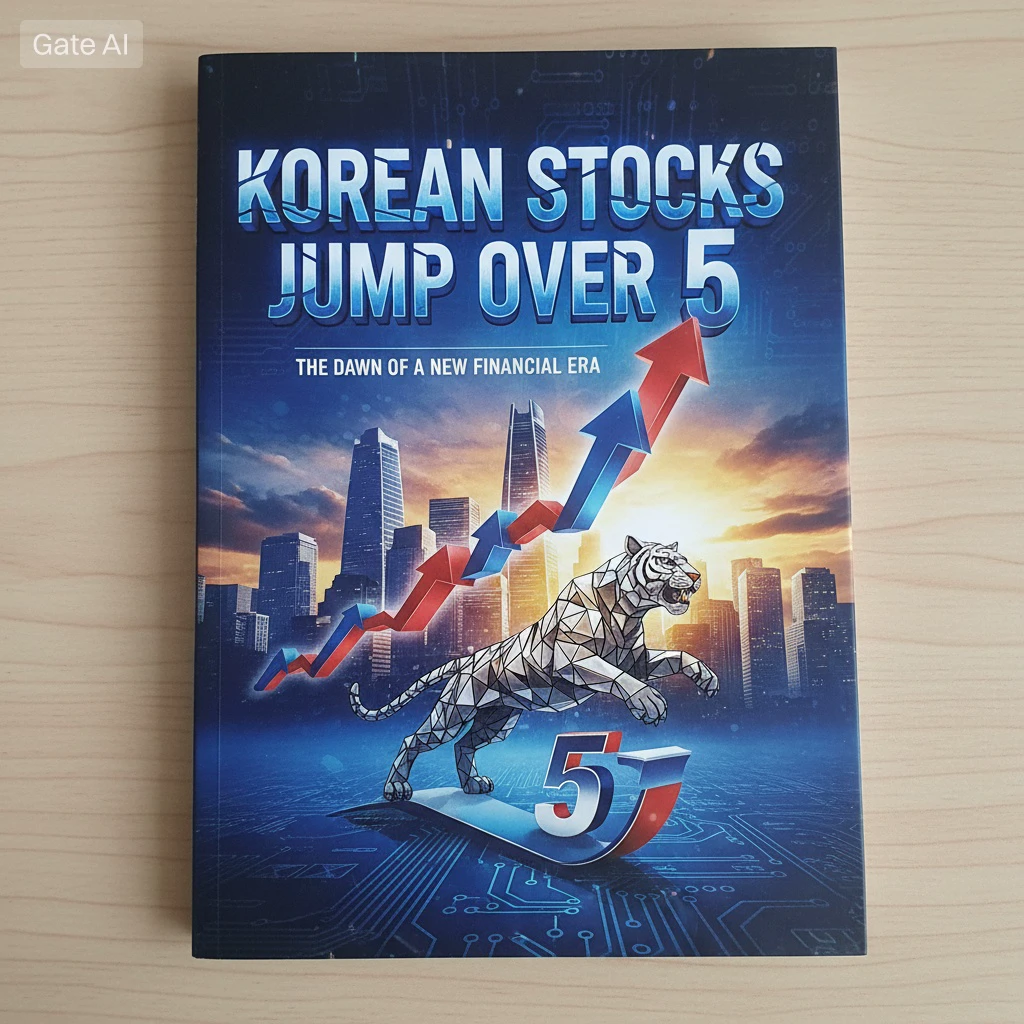
#KoreanStocksJumpOver5% 🇰🇷📈 #ShareWeekly #WCTCS9

South Korean Stocks Surge Over 5%: Is a New Market Rally Taking Shape?

South Korea's stock market has delivered a powerful rebound, with the benchmark index jumping more than 5% in early trading. What makes this move particularly interesting is that the rally was not limited to one sector. Major players across semiconductors and automobiles joined the advance, reflecting a broader improvement in investor sentiment.

📊 Key Market Developments:

- 🇰🇷 Korean benchmark index: Up 5.49% to 5,294.35
- Samsung Electronics: +5.85%
- SK Hynix: +8.
post-image
  • 3
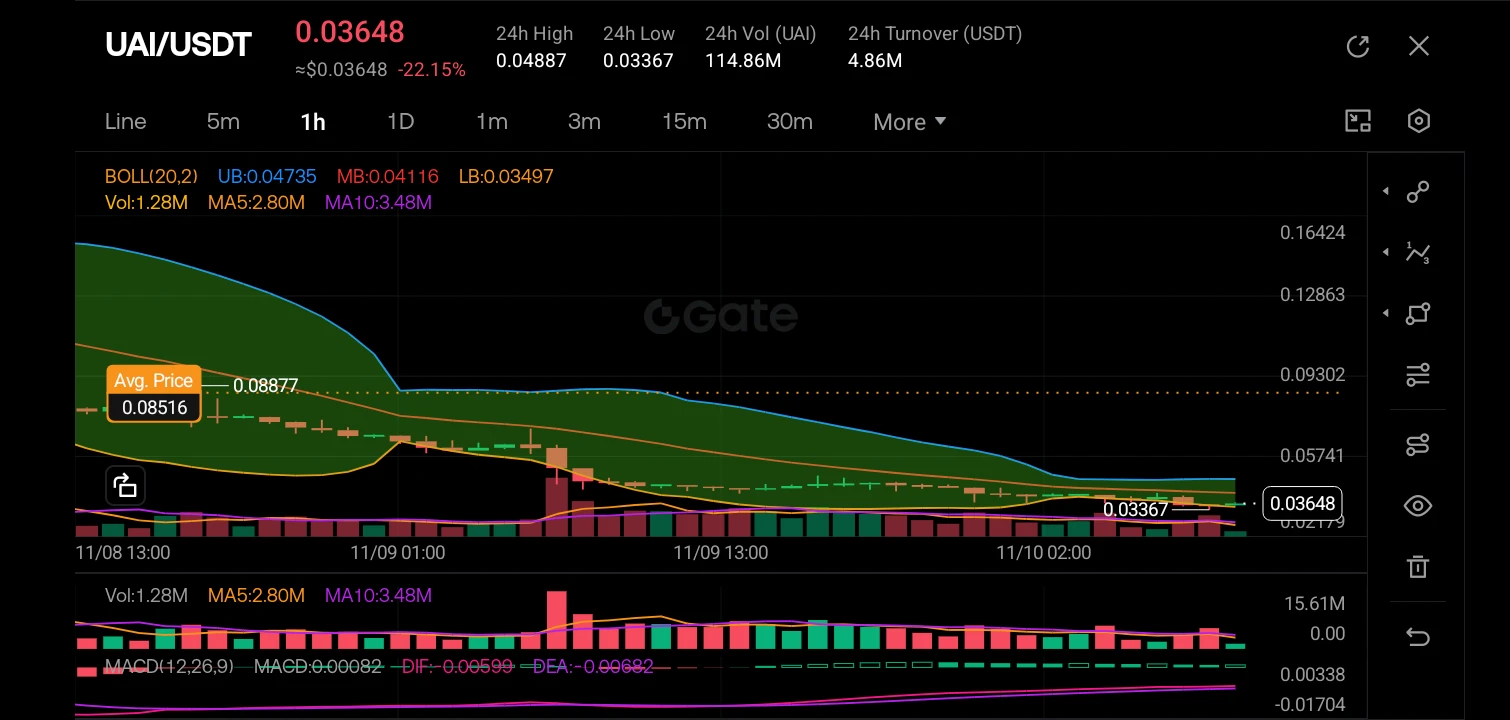
$UAI ‌
The market structure is in a clear and aggressive bearish downtrend, having collapsed from the 0.088 level down to current lows near 0.036. The price is consolidating at the bottom of a massive drop, showing a breakdown of previous support levels, and the Bollinger Bands are beginning to narrow, suggesting a potential pause before the next leg or a consolidation phase.

The 1-hour K-lines show a heavy sell-off followed by a low-volatility sideways chop between roughly 0.033 and 0.041. The price is currently trading below the middle Bollinger Band (MB: 0.041) and hugging the lower band,
post-image
UAI-7.58%
  • 2
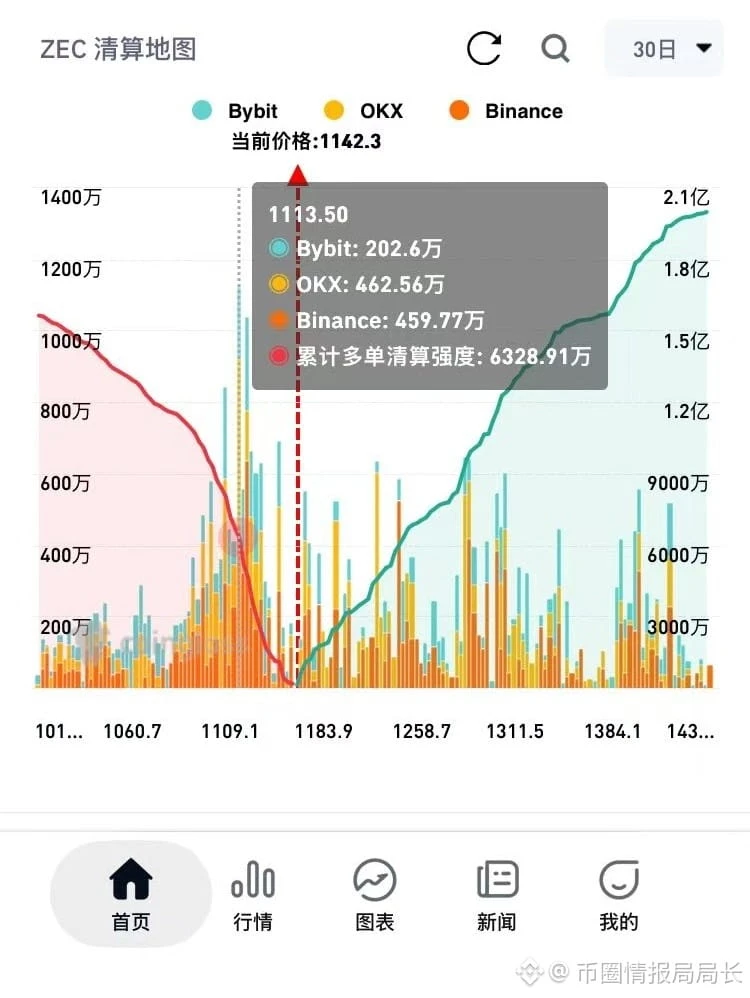
$ZEC The 30-day liquidation map shows:
1. If ZEC falls to $1113.5, cumulative long liquidation intensity reaches $63.28 million.
2. If ZEC falls to $1089, cumulative long liquidation intensity reaches $109 million!
3. If ZEC falls to $1065, cumulative long liquidation intensity reaches $126 million.

4. If ZEC rises to $1236, cumulative short liquidation intensity reaches $45.8 million.
5. If ZEC rises to $1307, cumulative short liquidation intensity reaches $124 million.
6. If ZEC rises to $1414, cumulative short liquidation intensity reaches $194 million.

ZEC is currently at $1152, with a r
post-image
ZEC+1.29%
Bear Market is the time to build positions and accumulate assets with potential.
Bull Market is the time to maximize opportunities and seek the fastest compounding strategy.
Lock In.
post-image
$ZEC ‌
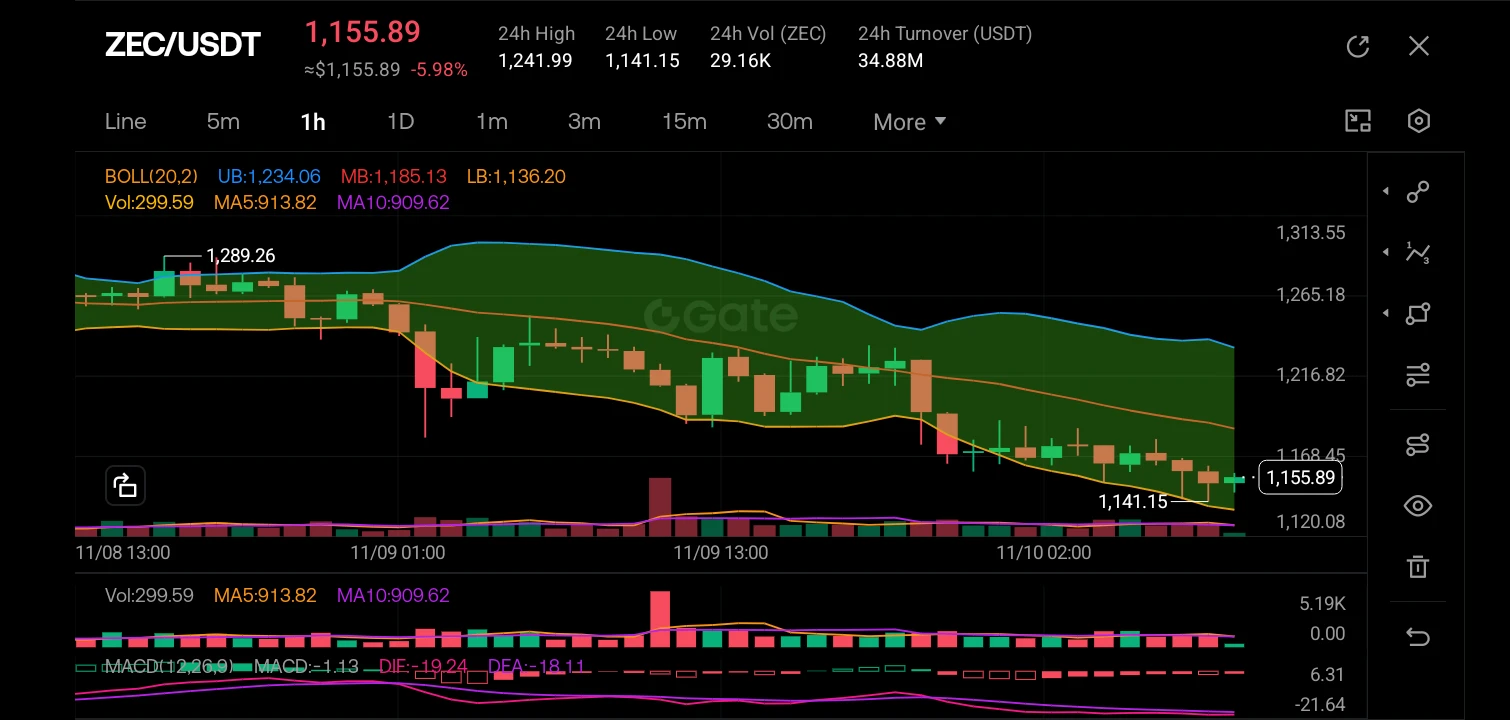
The market structure on the 1-hour timeframe has shifted from a consolidation phase to a clear bearish breakdown. After failing to sustain the highs near 1,289.26, the price action created a series of lower highs and lower lows, aggressively breaking below the middle Bollinger Band (MB: 1,185.13). The current structure is distinctly bearish as the price rides the lower Bollinger Band (LB: 1,136.20), indicating strong selling pressure and a lack of immediate buying interest at these levels.

Looking at the K-lines, the trend is heavy. We can see a strong impulsive red candle on 11/09 th
post-image
ZEC+1.16%
  • 2
$JCT This price action is enough to make your scalp crawl: down 20% in 24 hours, with the price now at 0.0075. The people in the group who were shouting “send it” this morning are all playing dead now. This move is like someone suddenly yelling “The market inspectors are here!” just as the market is closing—everyone tramples each other before checking whether the goods are any good. Trading volume surged to 772.9M, showing panic sellers and dip buyers are battling it out between 0.0067 and 0.0118. The money isn’t fleeing; they’re just calling each other idiots.
Sentiment-wise, this is a classi
JCT-3.26%
  • 3
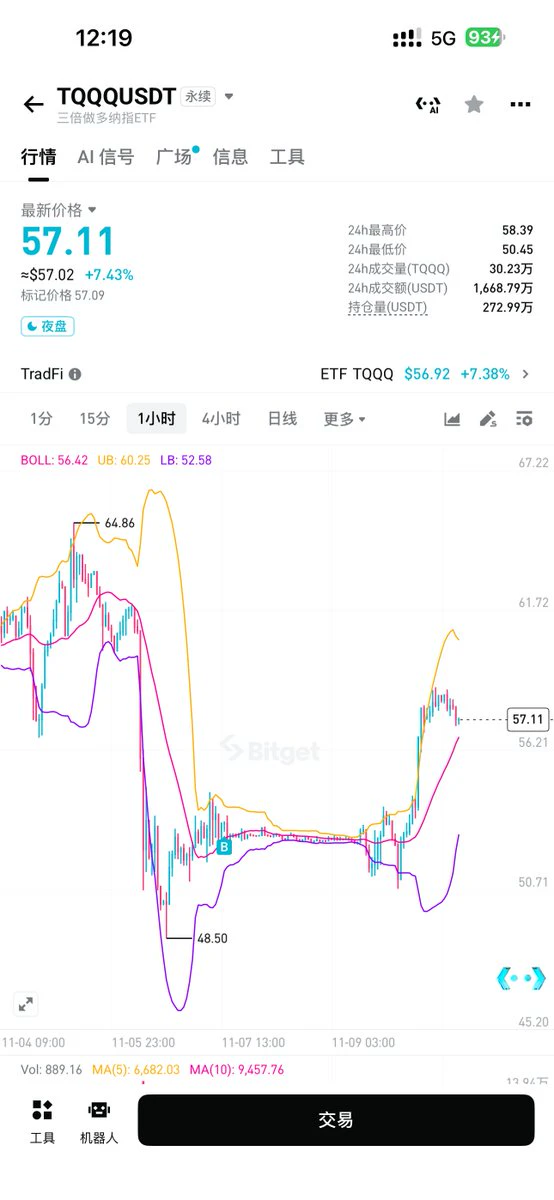
#TQ Be greedy when others are fearful. I bought the dip in TQ, though not perfectly: my entry price was $52; I didn’t dare enter at the low of $48.5
post-image
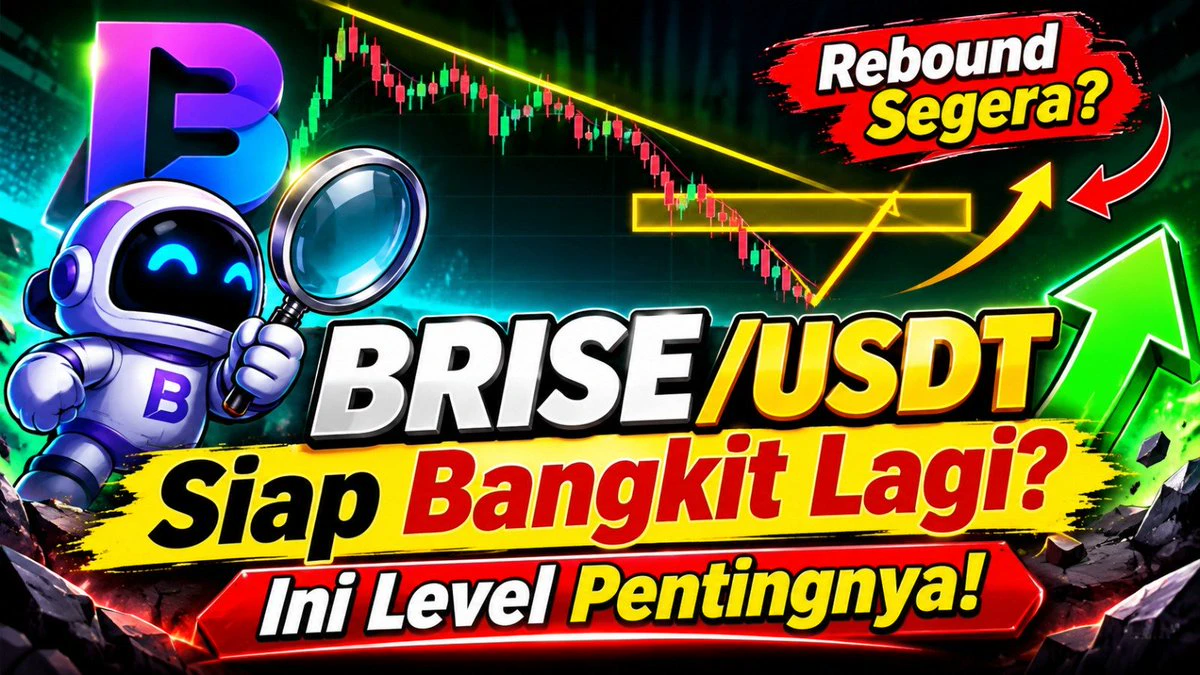
Is BRISE Ready to Rebound? Scalping Traders Must Watch This Level!

#BRISE #DIDICHANEL
post-image
BRISE-0.31%
Nuke the chain bro wtf 😭
post-image
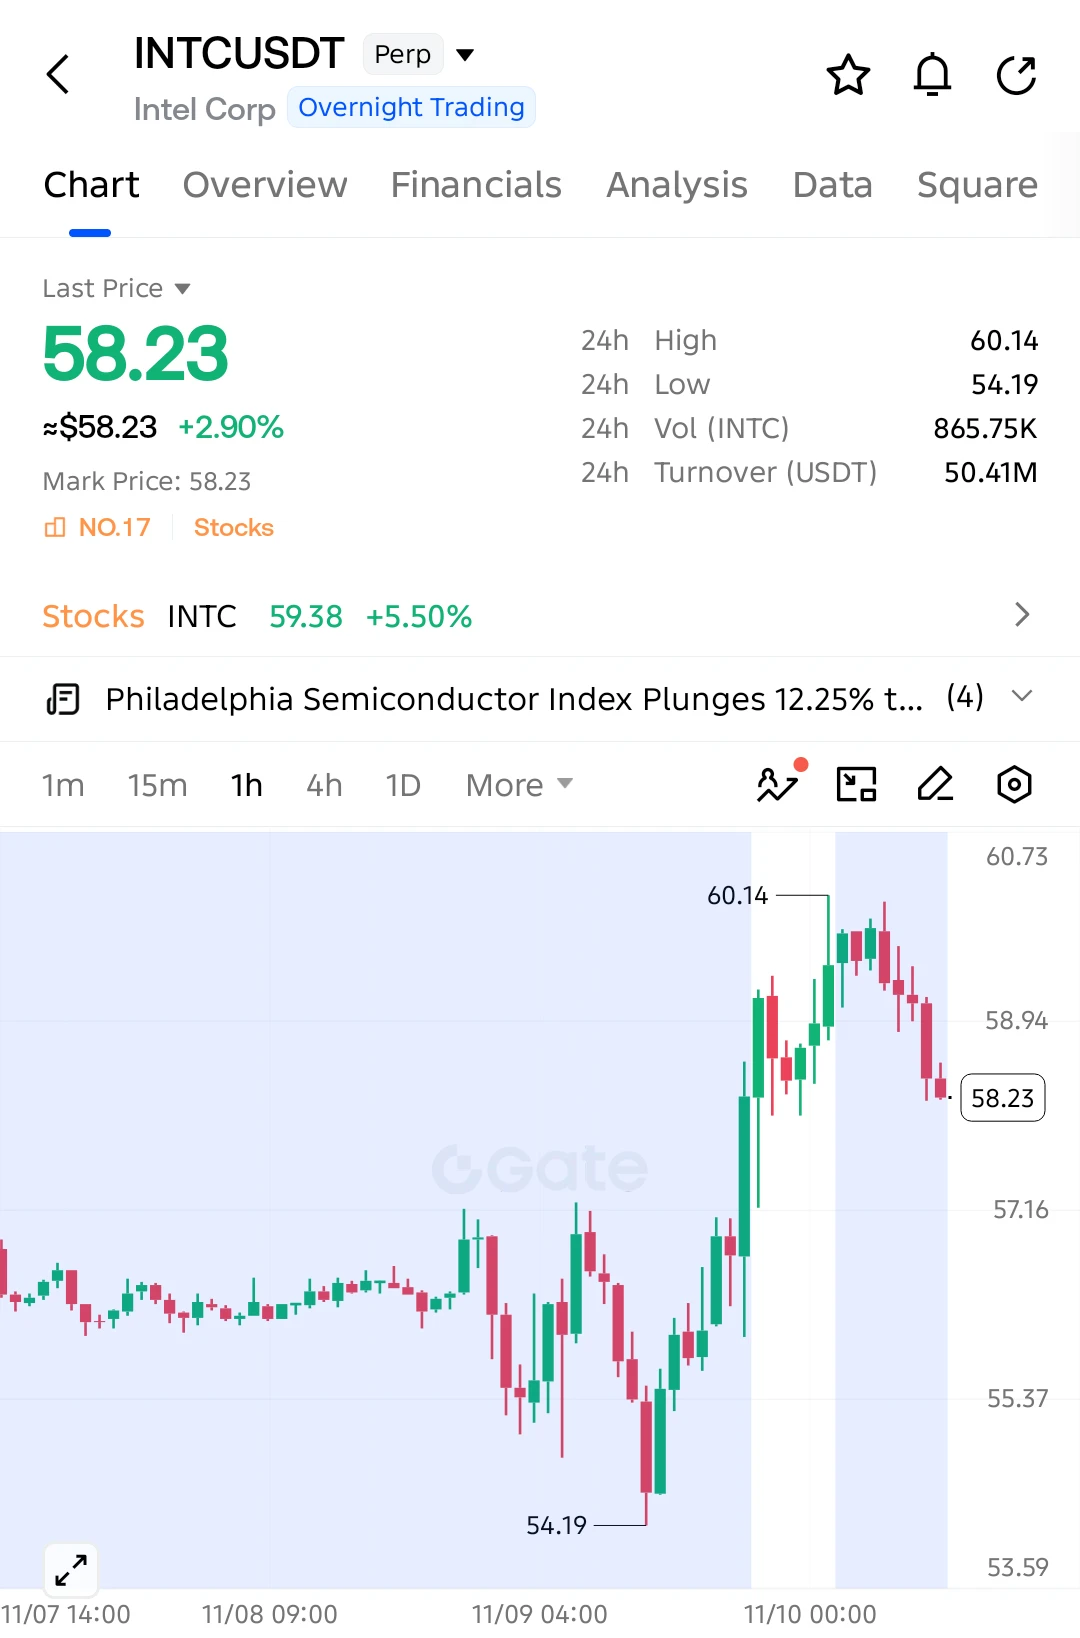
$INTC SHORT SETUP — SELLERS TAKING CONTROL!

$INTC has faced a sharp rejection from 60.14, and the latest candles show growing selling pressure. The pullback could extend further as buyers lose momentum!

Entry: 58.23
SL: 59.10

TP1: 57.40
TP2: 57.16
TP3: 56.30
Final Target: 55.37

$INTC is forming lower highs after failing to hold above 59.00. Sellers have pushed price below nearby support, opening the possibility of a deeper correction toward 57.16. A breakdown below that level could accelerate the decline.

Invalidation: Sustained recovery above 59.10.

Watch $INTC closely. Bears are gainin
post-image
INTC+0.05%
#SP500PostsBiggestGainIn7Months
The strong rebound seen in United States shares has changed in a moment the mood of investors who had long stayed under pressure, and this move suggests that the market has begun to gain strength again with a daily gain on a scale not seen in seven months.

The broad share gauge rose 2.3 percent in trade, and by the close it had risen 173.08 points, or 2.35 percent, to 7549.94, a move recorded as the strongest daily gain seen since April 8.

Behind this rebound stood buying in response to the sharp selling wave seen last week in artificial intelligence shares
post-image
NVDA-4.34%
AAPL+2.37%
AMZN+2.95%
MSFT+2.75%
GOOGL+1.21%
  • 10
  • 5
Load More

Join 40 M users in our growing community

⚡️ Join 40 M users in the crypto craze discussion

💬 Engage with your favorite top creators

👍 See what interests you

Trending Topics

USCPIDataIncoming

49.63k Views2.21k Discussing

The U.S. October CPI report will be released on November 10 at 8:30 a.m. ET. September CPI came in at 3.7% year over year, and markets will be watching closely for signs that inflation is cooling, especially in core CPI. A softer-than-expected reading could strengthen rate-cut expectations, while hotter inflation may pressure risk assets through higher Treasury yields and a stronger dollar. How do you think this CPI print will move $BTC, U.S. stocks and gold?

USIranTalksShowNewProgress

6.14k Views1.25k Discussing

KoreanStocksJumpOver5%

1.69k Views4.83k Discussing

View More