





Share your thoughts
placeholder
Article
$XVS XVSUSDT – Accumulation Nearing Its End, Major Breakout?
The price is moving within a descending channel on the 1-hour timeframe and has reached the lower boundary. It is now poised for a bounce and is expected to retest this boundary.
The Relative Strength Index (RSI) indicates a downward trend, which is likely to continue given the overbought conditions.
There is a key support zone in green at 2.82, and the price has bounced off this zone several times, making it a strong support level.
The price is trending towards the 100-period moving average, which we are approaching. This trend supp
post-image
XVS-2.81%
#HYPEBreaks88HitsNewAllTimeHigh HYPE Breaks $88 & Hits a New All-Time High!
Hyperliquid’s native token HYPE has once again captured the crypto market’s attention, climbing to a fresh all-time high around $88. Recent data shows HYPE gaining more than 51% over the past month, highlighting the strength of its current bullish momentum.
What’s driving the rally?
• Strong buying momentum and renewed market confidence
• Significant HYPE token buybacks supporting demand
• Large-holder accumulation adding to bullish sentiment
• Growing attention toward Hyperliquid’s decentralized trading ecosystem
post-image
HYPE+3.77%
This was purely the market being in a good mood and casually sprinkling some gold coins—one just happened to hit me on the head 🪙

When I checked the market after lunch, $HYPE held firm after pulling back to around 78.190, and buying pressure strengthened. Every dip was met with funds buying in. This kind of market doesn’t need fancy analysis—when the key level holds, just go for it.

Now at 87.757, +773.68%, it really feels great. It wasn’t a heart-stopping pump, but a steady rhythm; get the timing right and you can make big gains.

Take profit on 80% first and put the bulk in your pocke
post-image
HYPE+3.83%
ZEC+17.29%
BTC+0.39%
With this trend, I don't even need to think—the account is dancing on its own. A few days ago, I was still calculating whether I had enough money for instant noodles this month; this morning, I was already wondering whether to add sausage. 😂 $SOXS really came through for me.

When the price plunged intraday, selling pressure was overwhelming, and the buying support was as flimsy as paper. Every rebound fell just short of breaking through key levels—this was a classic sign of weakness. I placed a short order around 52.38 right then and entered as it ran out of steam. The strategy was summed
post-image
SOXS-3.40%
ZEC+17.29%
BNB+0.71%
#ZEC How should we view ZEC after it broke above $1,200?
First, the most compelling point in the bullish narrative: ZEC's all-time high was actually $5,941 in 2016—the current $1,193 is still about 80% below its ATH. Against the backdrop of continued ETF inflows, the market can fully tell the story that a ten-year high is only the beginning and that ZEC is returning to its ATH. ZEC's ETF assets under management have surpassed $400 million, while the SMA-200 near $440 provides strong trend support, and the daily structure remains healthy.
But in terms of momentum, the risk is accumulating rathe
ZEC+17.30%
  • 17
  • 1
I wasn't even expecting to break even, but it took me straight into profit. This service is seriously on point.

While everyone was still watching from the sidelines, $BTC got dumped again. Bearish news was flooding the screens, and the chart looked pretty bad, but I watched the key level hold firm. Instead, funds kept buying as the price fell. This was a level where you had to be brave, so I went straight into a long position.

Looking back, the entry was 77595.4 and the current price is 79897.97. This was a textbook retest wick followed by an engulfing reversal. +499.46% is safely in the b
post-image
BTC+0.39%
BNB+0.71%
ZEC+17.29%
$ETH Signal】Buy the pullback, 4H momentum expanding
$ETH Order book depth imbalance -79%, price has not broken below 2490. The 4H MACD histogram is expanding, and EMA20/50 are diverging upward. 1H volume has contracted to 5785 ETH, with selling pressure nearly exhausted. Funding rate 0.0042%, with low leverage costs.
🎯Direction: Long
⚡Entry/Limit order: 2491.0643 - 2498.5600
🛑Stop loss: 2473.5744
🚀Target 1: 2536.0384
🚀Target 2: 2554.7776
🛡️Trade management: Reduce the position by 50% upon reaching Target 1 and move the stop loss to the entry price. If the price falls back to the entry le
post-image
ETH+1.97%
BTC+0.39%
SOL+4.16%
I originally just wanted to freeload a breakfast, but the market ended up serving me six months’ worth of dumplings. I had my eye on this $HYPE long when the pullback held, but it was still grinding around that afternoon a few days ago, so I waited until confirmation before entering. Since I dared to take the trade, I wasn’t afraid it wouldn’t give me any meat. I stayed in throughout the repeated intraday swings, stuck around the entry price for half a day, and was almost shaken sick. But what happened? The market is won by waiting, and profits are made by holding. This move directly cashed in
post-image
HYPE+3.83%
BNB+0.71%
ZEC+17.29%
No sense of scale, can’t hold on—the profits on this trade are paper-thin, but I’m absolutely loving it.
When the screen was glowing green, I set my sights on $WLD . The price repeatedly retested 0.3669 but managed to hold, and this kind of resilience in a weak market looked more like a signal light. While everyone else was running, I went long with a small position instead. Unexpectedly, the market really came through, climbing all the way to 0.4022, for a return of +681.22%.
Sideways movement at the bottom is an accumulation of strength, while holding firm after a retest shows confidence. Wea
post-image
WLD+3.43%
LAB-2.48%
SNDK+1.58%
Everyone’s long $SNDK /USDT—but the 4h tape just whispered a secret that flips the script.

$SNDK /USDT - SHORT

Trade Plan:
Entry: 1782.45 – 1786.49
SL: 1809.67
TP1: 1765.57
TP2: 1752.97
TP3: 1734.06

Why this setup?
Why now? The 1D trend is stuck in a range, and the 15m RSI (62.77) is already hot—yet price is stalling at 1784.47.
- Short setup: Entry 1784.47, TP1 1765.57, TP2 1752.97—that’s a 1.8% drop from here.
- ATR 1h at 8.07 means volatility is alive, but not exploding—perfect for a controlled fade.
- Confidence 77.4 says the range top is rejecting, not absorbing.
- If bulls
SNDK+1.58%
Dollar Weakness Returns Across Markets! Could BTC & ETH Gain From the Shift?
live-cover
LIVE74
Everyone’s staring at ADA’s recovery—but the 4h chart just whispered a secret that contradicts the crowd.

$ADA /USDT - SHORT

Trade Plan:
Entry: 0.2202 – 0.2214
SL: 0.2265
TP1: 0.2166
TP2: 0.2137
TP3: 0.2095

Why this setup?
- 1D trend is *range*, but our 4h bias flips SHORT at 55% conviction—not a strong sell, but a tactical fade.
- RSI 15m at 58.31 shows a dead-cat bounce losing steam right under our entry zone (0.2208).
- ATR 1h (0.002357) is tight—meaning the next leg down (TP1 0.2166) is closer than the upside trap (alt TP1 0.2250).
- Why now? Price is “Waiting” at resistance—th
ADA+3.53%
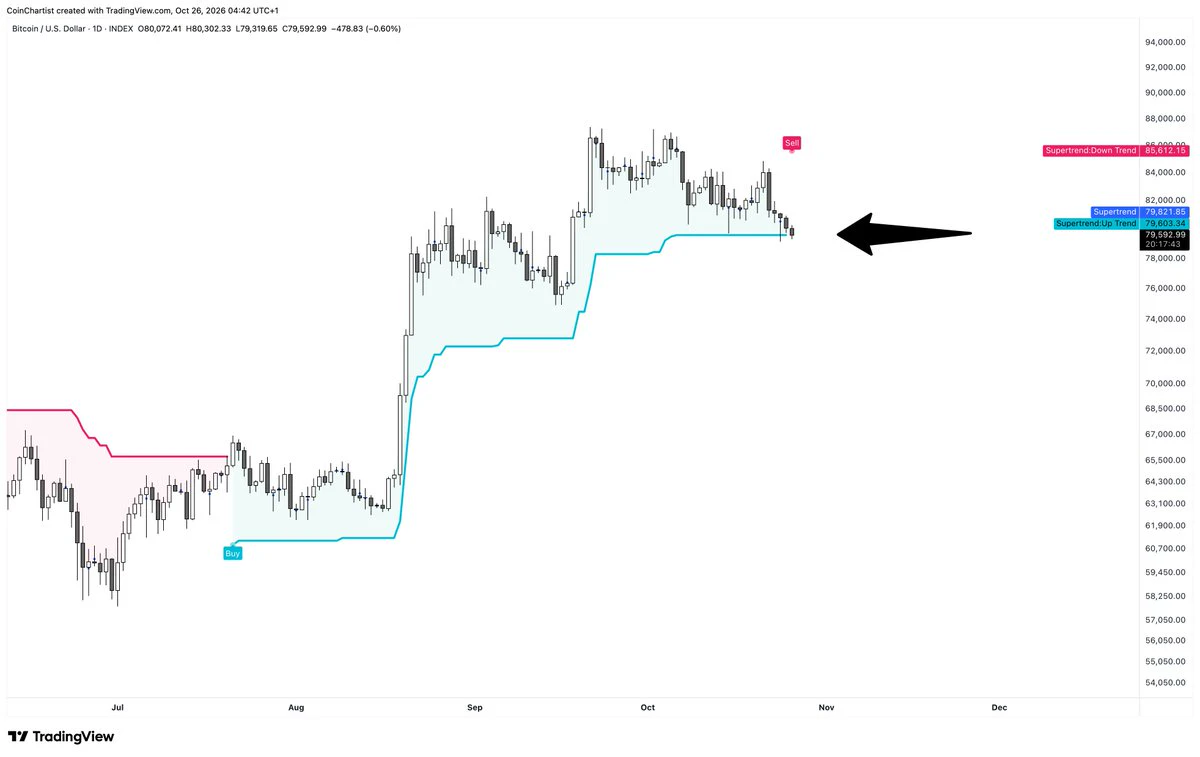
Everyone’s long BTC, but my 4h tape just whispered a name: SHORT. Trust the range?

$BTC /USDT - SHORT

Trade Plan:
Entry: 79826.85 – 79939.39
SL: 80423.28
TP1: 79478.00
TP2: 79207.91
TP3: 78802.79

Why this setup?
Why now?
- Price is pinned at 79,883, hugging the upper lip of a 1D range—rejection fuel.
- RSI (15m) at 50.78 is dead neutral, offering zero upside momentum to break 80,423 (SL).
- ATR (1h) at 225 means we have room to bleed to TP1 (79,478) without panic.
- Confidence is 55.4—not a scream, but a smirk. The range top is the trap door.

Debate:
Are you fading this range t
BTC+0.39%
I just casually hit refresh, and it went up on its own, leaving me in a pretty passive position.
While it was grinding along the bottom intraday, my position was still showing an unrealized loss, and I didn't do much. Then $MU suddenly shot up in a bullish candle, and my account went straight from bright green to bright red. Who could handle an experience like that?
My brain hadn't caught up, but I had held the position all the way up from 934.48, and now it's at 1030.57. I did the math, and the return is +662.26%. It's okay if you don't understand the market—what matters is knowing how to hol
post-image
MU+1.56%
ADA+3.53%
SOL+4.19%
Afternoon Marke Updates
live-cover
LIVE2,140
$ZIVIDEND graduated on @LaunchOnSF and we're now officially out in the wild! 🤑
First wave of sellers are out!
Time to absolutely send this
$282 worth of zcash:native already sitting in the contract to be distributed to holders
I will work hard to bring @blknoiz06 aboard!
LFG!
ZEC+17.30%
Everyone’s long XRP—but the 4h tape just whispered a trap at 1.4206.

XRP/USDT - SHORT

Trade Plan:
Entry: 1.4185 – 1.4227
SL: 1.4412
TP1: 1.4051
TP2: 1.3948
TP3: 1.3793

Why this setup?
Why now?
- 1D trend is *range*, meaning no momentum to break higher—shorts win chop.
- RSI 15m at 54 is lukewarm, not overheated—room to fade the pop.
- Entry 1.4206 with tight SL 1.4412 gives a 2.2R to TP2 (1.3948) before the real dump.
- ATR 1h is thin (0.0086)—low volatility means the range top is sticky, not explosive.

Debate:
Are you fading 1.42 or buying the dip to 1.40 first?
XRP+1.15%
#Bots I'm trading with the Rebalance Bot bot on Gate.
post-image
$ZEC Signal】Long + 1H volume breakout
$ZEC RSI 4H surged to 82.12, spiked to 1223 on 1H before retreating to around 1174, with a 21.56% buy-side depth imbalance and aggressive buy volume at 1.55x. MACD 4H bullish momentum continues to expand, but the 1H histogram has contracted, with the short term entering high-level consolidation.
🎯 Direction: Long
⚡ Entry/limit order: 1170.43 - 1173.95
🛑 Stop-loss: 1115.25
🚀 Target 1: 1261.99
🚀 Target 2: 1306.02
🛡️Trade management:
- Execution strategy: After reaching Target 1, reduce the position by 50% and move the stop-loss up to breakeven. If the
post-image
ZEC+17.29%
BTC+0.39%
ETH+1.98%
SOL+4.16%
Load More

Join 40 M users in our growing community

⚡️ Join 40 M users in the crypto craze discussion

💬 Engage with your favorite top creators

👍 See what interests you

View More