
Square
Following
Hot
News
Notifications
Profile
Share your thoughts
placeholder
Article
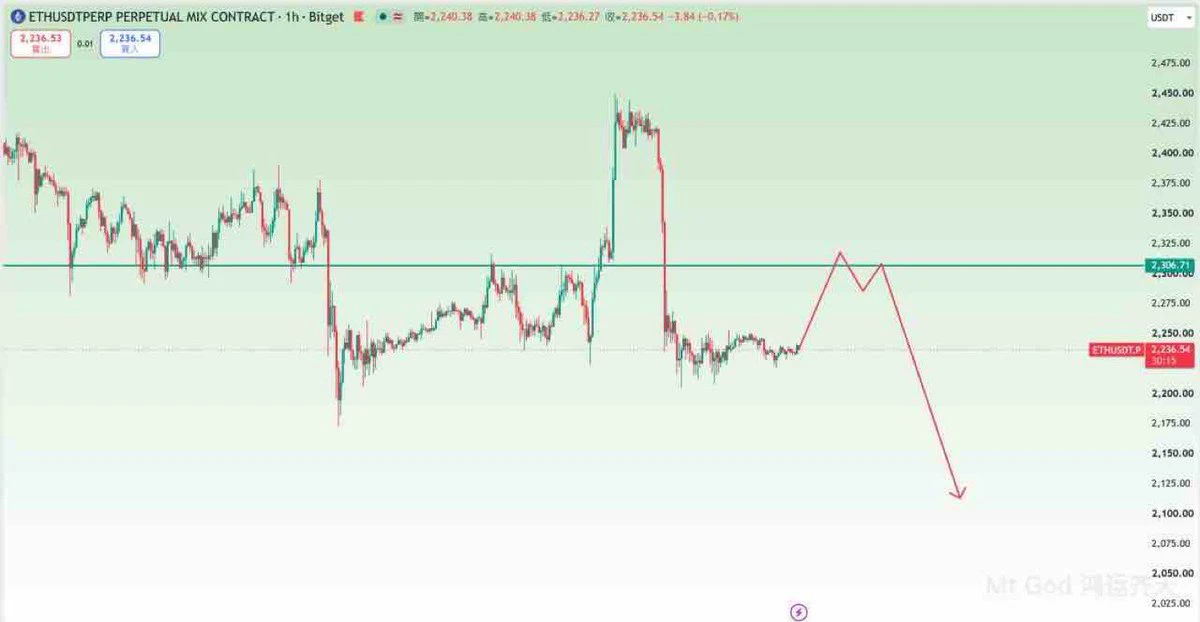
#ETH Watch for short opportunities if the price rebounds to this level.
post-image
ETH-1.23%
VIP GROUP NOW FREE FOR THE NEXT 60 MINUTES 🆓 🐋
Join now and enjoy the fast signals 🎯
Beautiful analyses are being shared, I want everyone to join.

Link friends limited to only the first 25 members⚠️
post-image
Trenches
ZIG
Z
bade
b
ZIG
0x8c...1145
Market Cap
$.
Change
.
24h Vol
$.
Holders
.
STONK
S
bade
b
STONK
6GmA...UNgx
Market Cap
$.
Change
.
24h Vol
$.
Holders
.
IDOL
I
bade
b
IDOL
0x3b...ab07
Market Cap
$.
Change
.
24h Vol
$.
Holders
.
CLAUDIA
C
bade
b
CLAUDIA
2j5S...W2ZM
Market Cap
$.
Change
.
24h Vol
$.
Holders
.
FLOAT
F
bade
b
FLOAT
Bv1a...BMmr
Market Cap
$.
Change
.
24h Vol
$.
Holders
.
Apple is up 24% this year, the best performer among the “Magnificent Seven”—why has being “a beat behind” on AI turned into an advantage?

U.S. stocks have plunged over the past few days, wiping out about $1.04 trillion in combined value for the Magnificent Seven. But looking at the year as a whole, Apple is the group’s best performer, up 24%. The reason may sound counterintuitive: it’s precisely because the company is “a beat behind” on AI.‌‌

Here’s the market’s logic: In the early days of the AI boom, money flowed to the most aggressive AI players, such as Nvidia and Google. But concerns
AAPL-0.57%
#USCPIDataIncoming
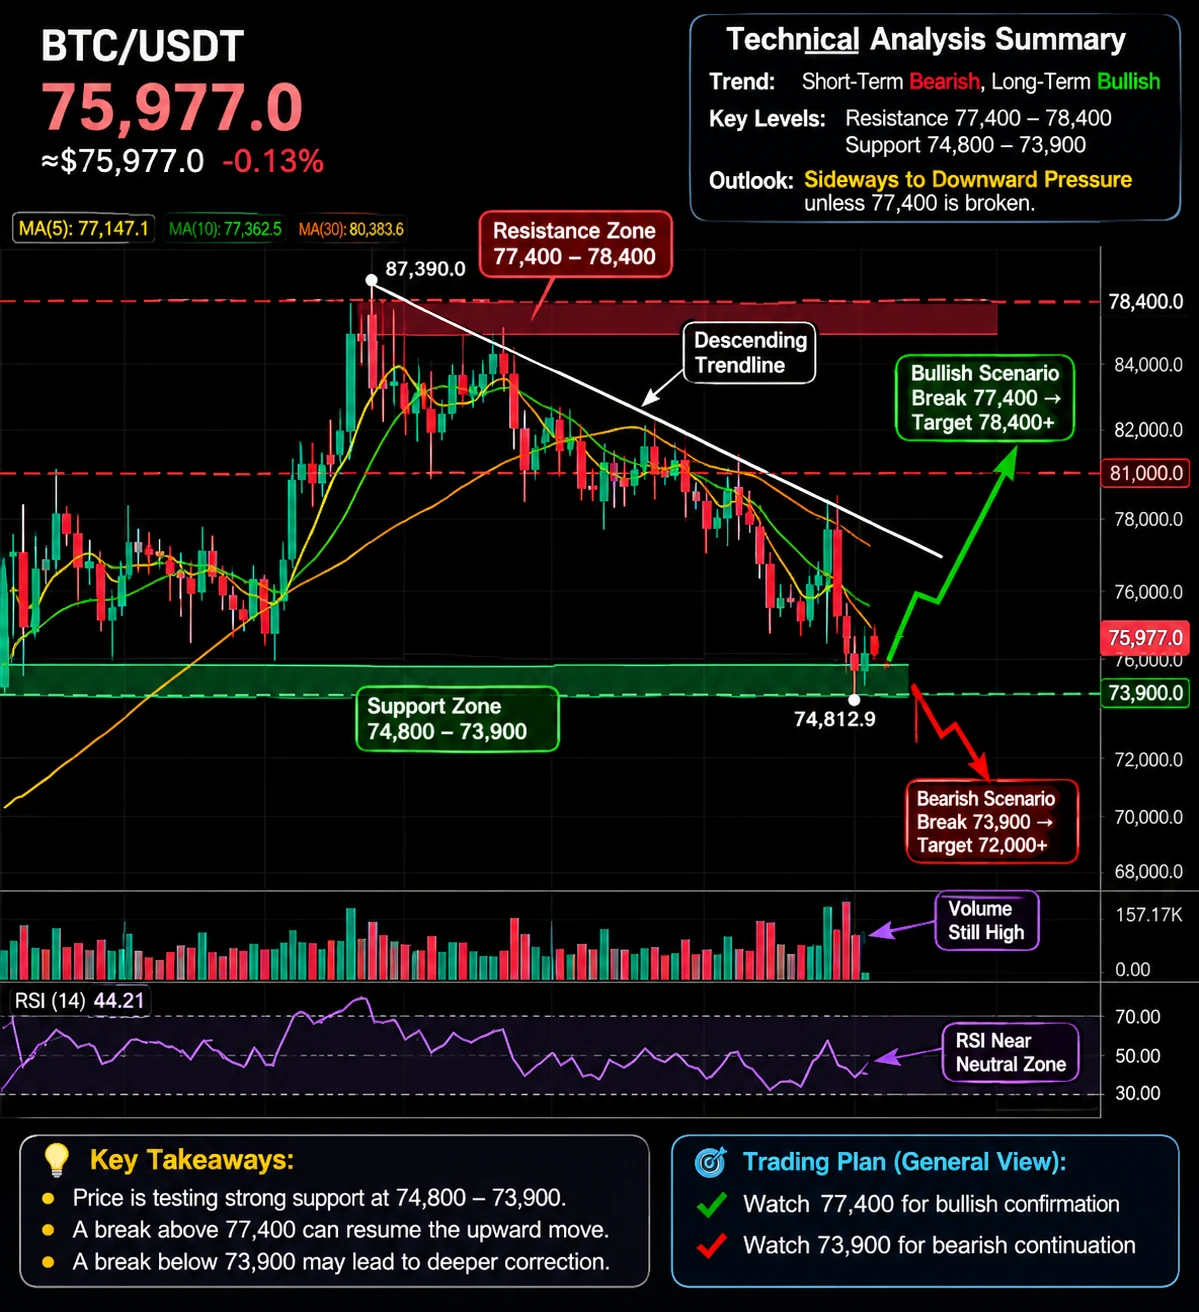
Today, I expect BTC to rebound; the 80-81k range will be tested again. After weeks of back-and-forth within the resistance/support range, I expect a nice transformation. If 81k breaks, the 84-86k range could be tested again. For now, I don't expect 90k in the near term, but I expect a rise toward the new year.
long position
entry level 75800
10x
close 81k
$NVDA $BTC ‌
post-image
NVDA+2.80%
BTC-0.65%
  • 3
$IDOL ‌
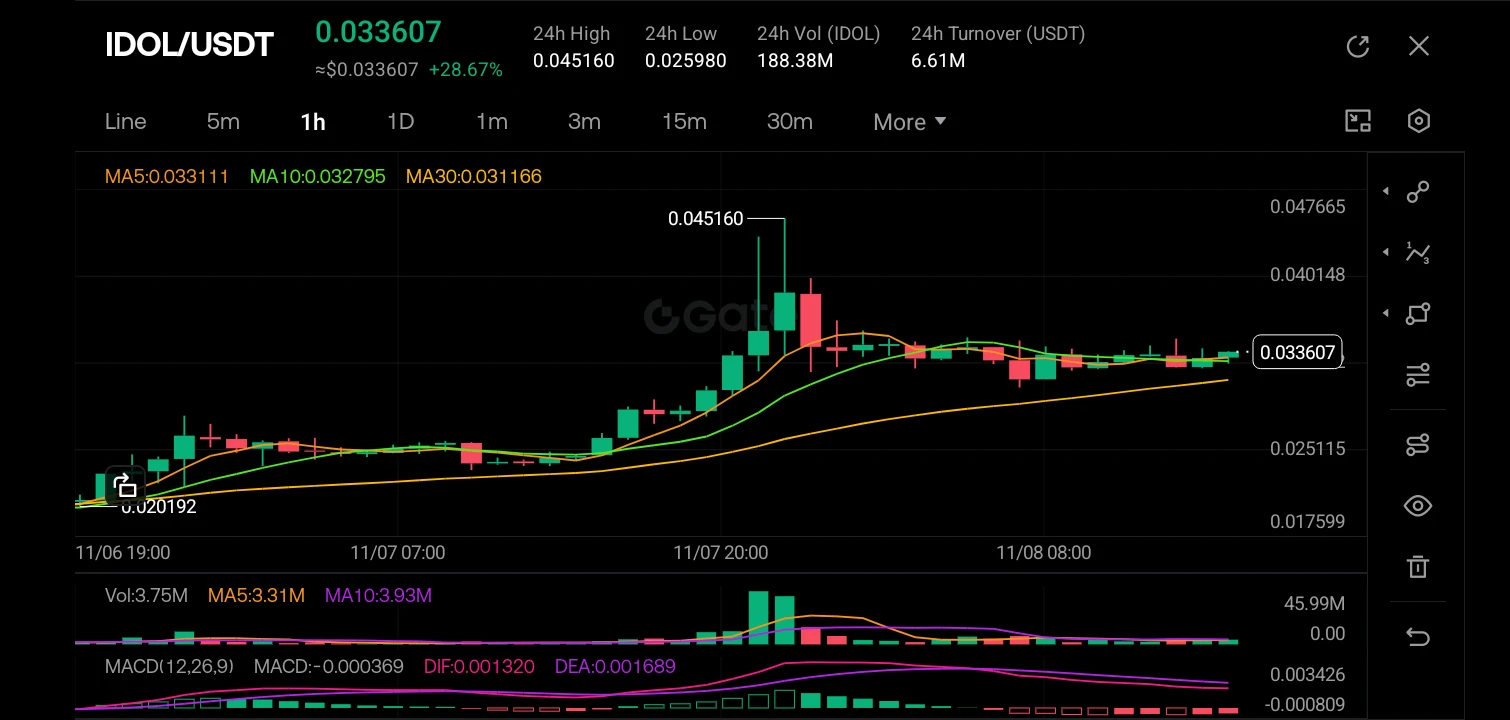
The chart shows a classic "pump and consolidation" structure; IDOL exploded from a base of roughly 0.020 to a peak of 0.045160, marking a massive +28.67% gain for the day, but the current 1H candles show a cooling-off period with smaller bodies and wicks, indicating the buying momentum has paused. The price is currently trading at 0.033607, which is holding above the MA5 (0.033111) and MA10 (0.032795), suggesting immediate support is intact, while the MA30 (0.031166) acts as the stronger trend floor below. On the MACD, we see a bearish cross with the DIF (0.001320) dipping below the D
post-image
IDOL-7.01%
  • 1
$CBRS LONG SETUP — BIG BREAKOUT COMING?

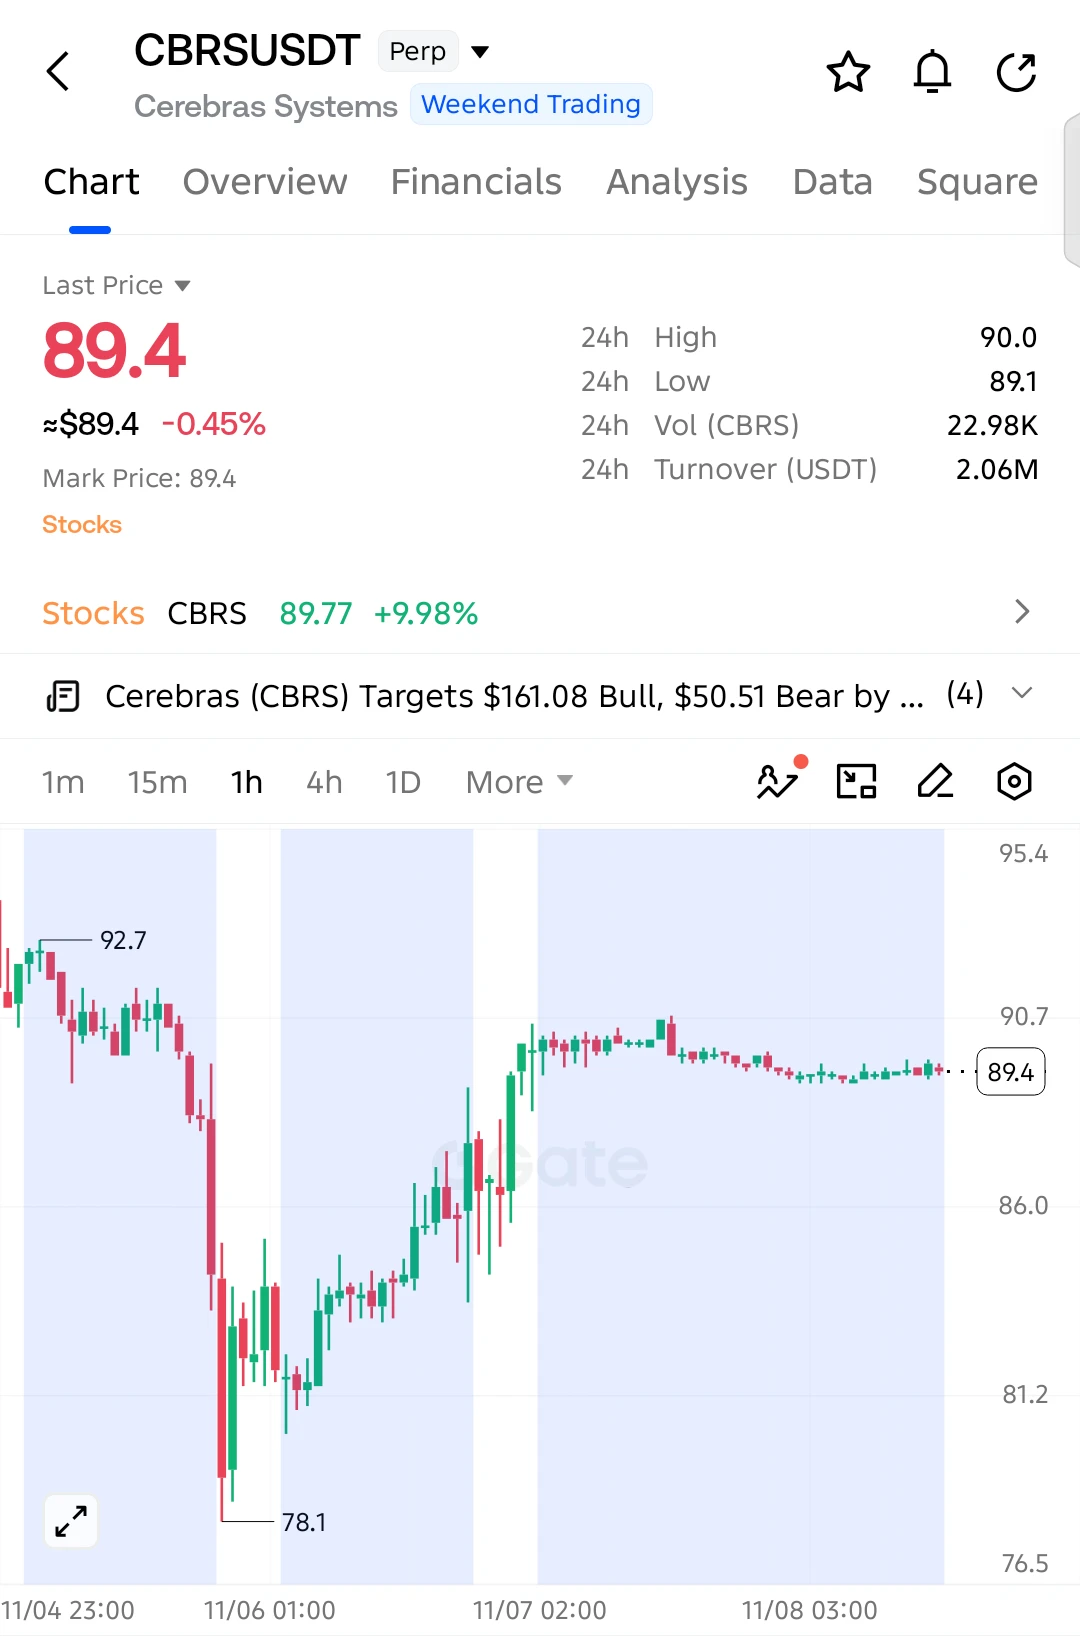
$CBRS is holding strong near 89.40 after recovering from 78.10. Selling pressure is fading, and buyers could be preparing for another upside push!

Entry: 89.40
SL: 88.80

TP1: 90.20
TP2: 90.70
TP3: 91.60
Final Target: 92.70

Buyers have defended the 89.10 support area as price consolidates in a tight range. A breakout above 90.00 could attract fresh buying pressure and open the door toward 91.60–92.70.

Invalidation: A sustained break below 88.80 weakens the bullish setup.

Keep your eyes on $CBRS!
post-image
CBRS-1.52%
A Top-Tier Revenge Thirty Years in the Making
post-image
$NVDA ‌Let’s gooooo! Love you, mwah!😘😘😘😘😘😘😘😘😘😘😘😘😘😘😘😘😘😘😘😘😘😘😘😘😘😘😘😘😘😘😘😘😘😘😘😘😘😘😘😘😘😘😘😘😘😘😘😘😘😘😘😘😘😘😘😘😘😘😘😘😘😘😘😘😘😘😘😘😘😘😘😘😘😘😘😘😘😘😘😘😘😘😘😘😘😘😘😘😘😘😘😘😘😘😘😘😘😘😘😘😘
post-image
NVDA+2.80%
$ETH /USDT TIGHT COIL Low Conviction Scalp Short

$ETH /USDT

Direction: SHORT

Entry: 2,237.59

Stop Loss: 2,254.56

Targets
TP1: 2,224.86
TP2: 2,216.38
TP3: 2,203.66

ETH dropped sharply from the 2,420 high and has since flattened out into a tight, low-volatility base right around MA7 (2,236.25) and MA25 (2,237.82) essentially pinned to both averages for over a day with no real direction. MA99 (2,289.43) remains above, keeping the broader bias technically bearish.

$ETH ‌
ETH-1.23%
#每周来晒 #广场交易达人 #WCTCS9
How Will Gold Move Next Week? My Market Read and Trading Plan

I. Market Analysis

Gold had a particularly choppy week, rallying before pulling back. At its core, this was a tug-of-war between bulls and bears, with neither side gaining a clear upper hand.

The bears’ trump card is rate-hike expectations. The market is now pricing in roughly an 80% chance of a 25bp Fed rate hike in December. The U.S. Dollar Index is holding above 102, while the 10-year Treasury yield is hovering around 4.8%. Rising real rates naturally weigh on gold, a non-yielding asset. This is the fund
post-image
XAUUSD-0.45%
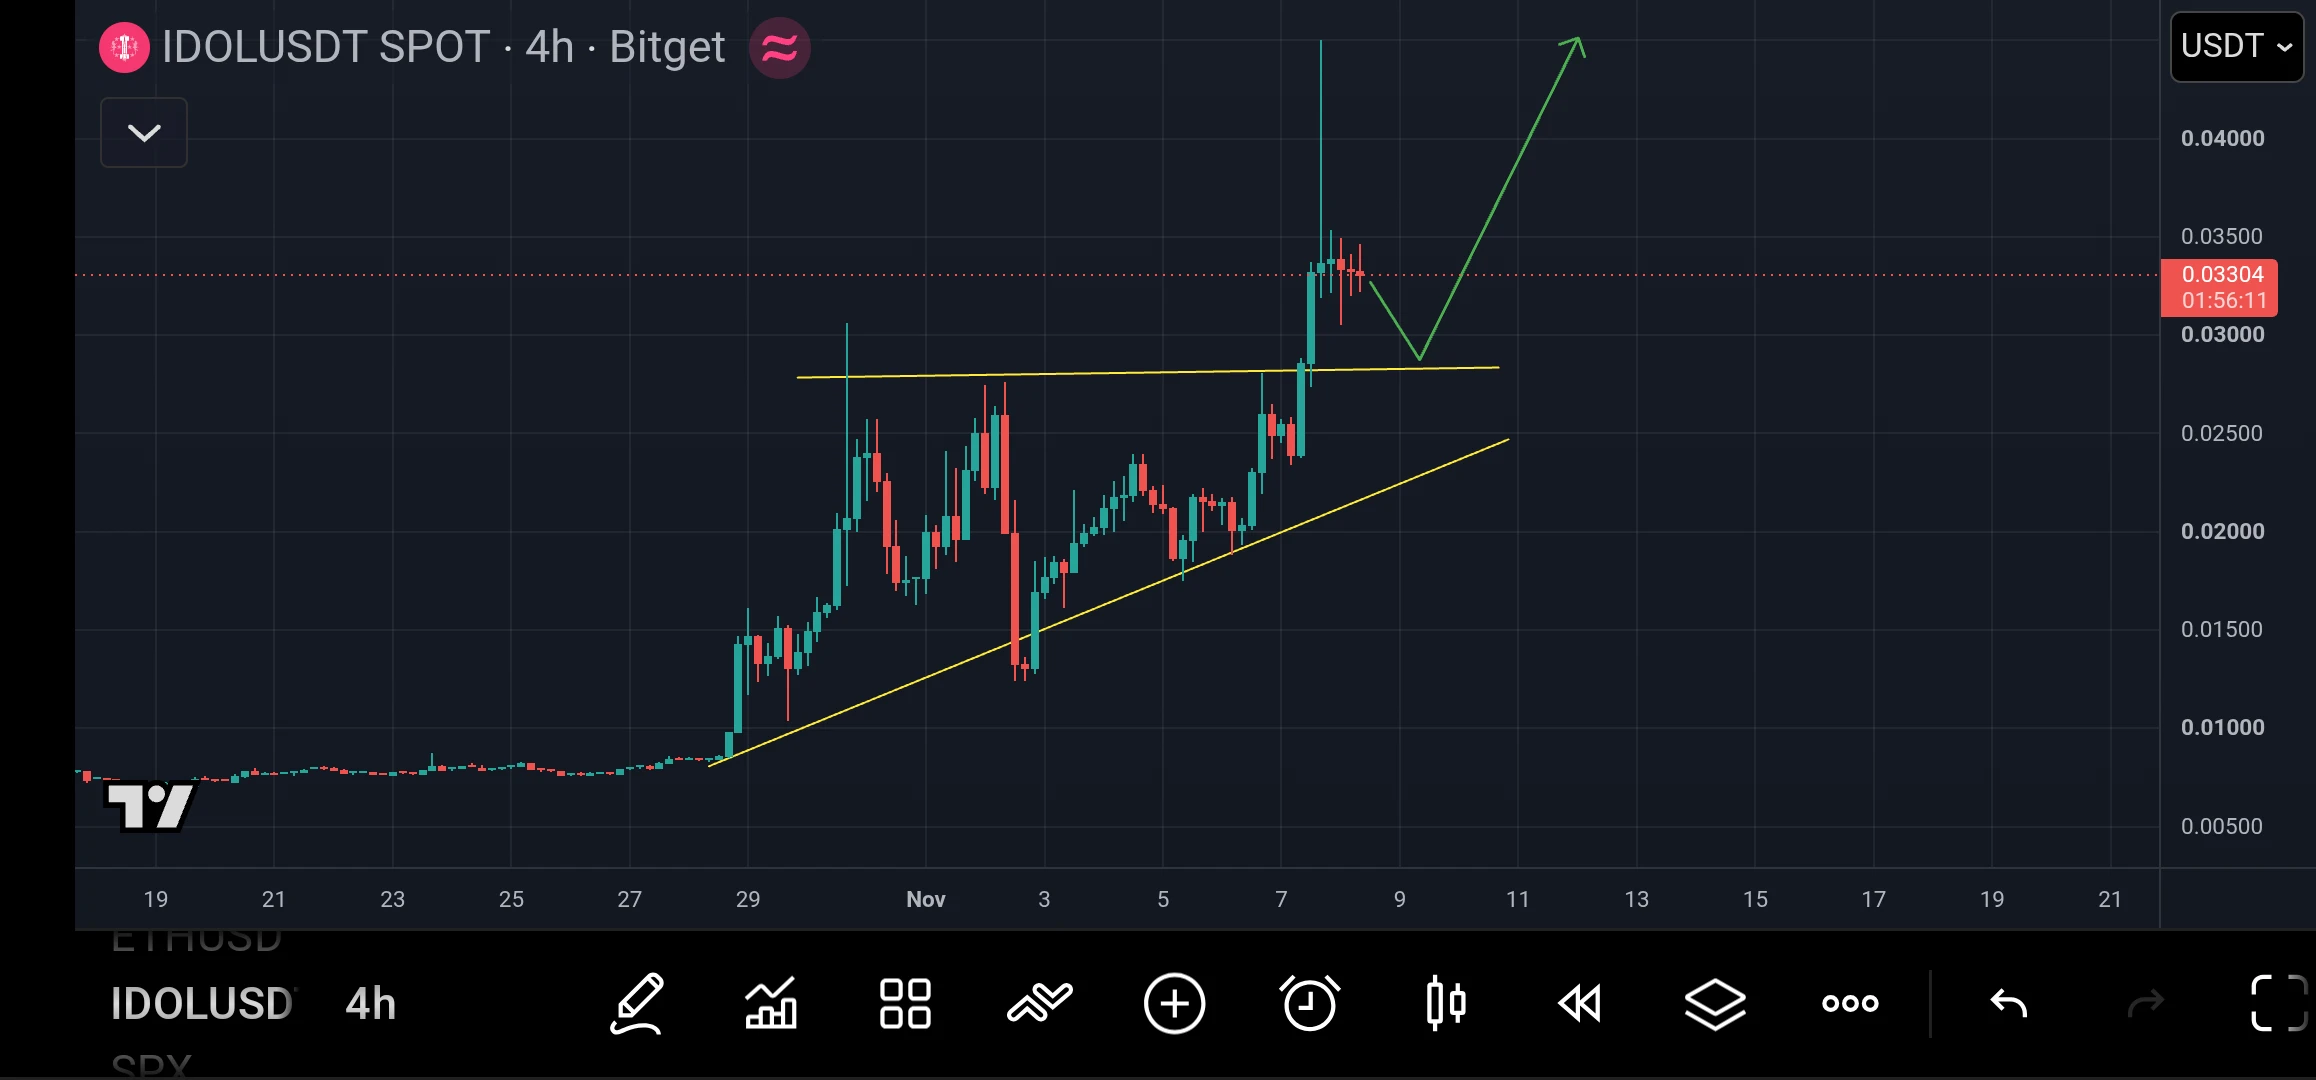
$IDOL has broken above the $0.028 resistance and is trading near $0.033 on this 4H chart.

I’m watching for a retest of $0.028–$0.029. Holding this area could support another move toward $0.035, then $0.040.

My view: the breakout looks promising, but I’d wait for support to hold before getting too bullish. Falling below $0.028 would weaken the setup.
post-image
IDOL-6.71%
btc
live-cover
LIVE1,212
Like ducks sensing the warmth of spring waters first, Bitcoin may be approaching an excellent buying opportunity. $BTC ‌
post-image
BTC-0.65%
$MU ‌
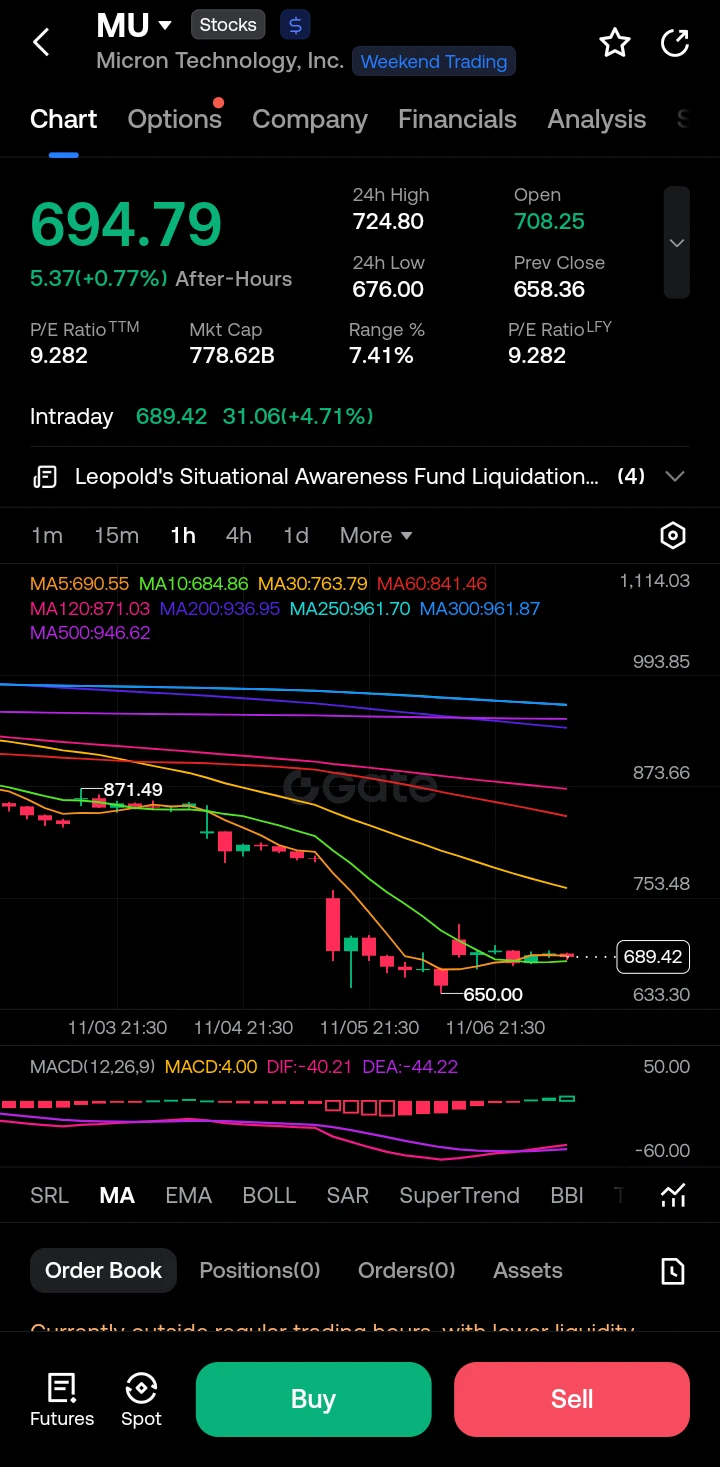
Looking at the 1-hour chart, MU has experienced a significant downtrend, dropping from a recent high of 871.49 down to a low of 650.00. However, the price has recently found support and is attempting a recovery, currently trading around 689.42. Crucially, the price is now pushing up against the shorter-term moving averages, specifically the MA5 (690.55) and MA10 (684.86), indicating a short-term momentum shift. The longer-term moving averages (MA60 at 841.46, MA120 at 871.03) remain sharply above the current price, confirming the broader trend is still heavily bearish. The MACD indicato
post-image
MU+4.71%
  • 1
  • 1
The booths at the African countries’ exhibits are indeed a bit more rudimentary.
$SKYAI This 16.98% surge is one I engineered with 7.7M in trading volume between 0.0296 and 0.0350. Don’t rush to chase it—let me break down the playbook.
First, in the morning session, I placed two buy orders totaling 800,000 U below 0.0300 to absorb panic selling. Second, after 10 a.m., I used small orders to repeatedly sweep the asks from 0.0315 to 0.0325, creating the illusion of a breakout. Once the chasers came in, I placed my short orders above 0.0330. Third, the price is now 0.0347, with a 24h high of 0.0350, just 0.3% below the peak, and 7.7M in trading volume—this volume can’t sustai
SKYAI-7.58%
EVENING UPDATE
live-cover
LIVE1,906
Tornado Cash-Funded Wallet Builds $26M Bitcoin-Ether Trade
A wallet converted 3,100 ETH into roughly 6.92 million USDC before pairing a Bitcoin long with an Ether short on Hyperliquid.
⚠️ Personal market analysis only. NFA — manage risk and DYOR.
Educational content, not investment advice or a recommendation to buy, sell, deposit, or withdraw any asset. No paid promotion or referral/affiliate links.
post-image
BTC-0.65%
ETH-1.26%
USDC+0.01%
$XAUUSD ‌
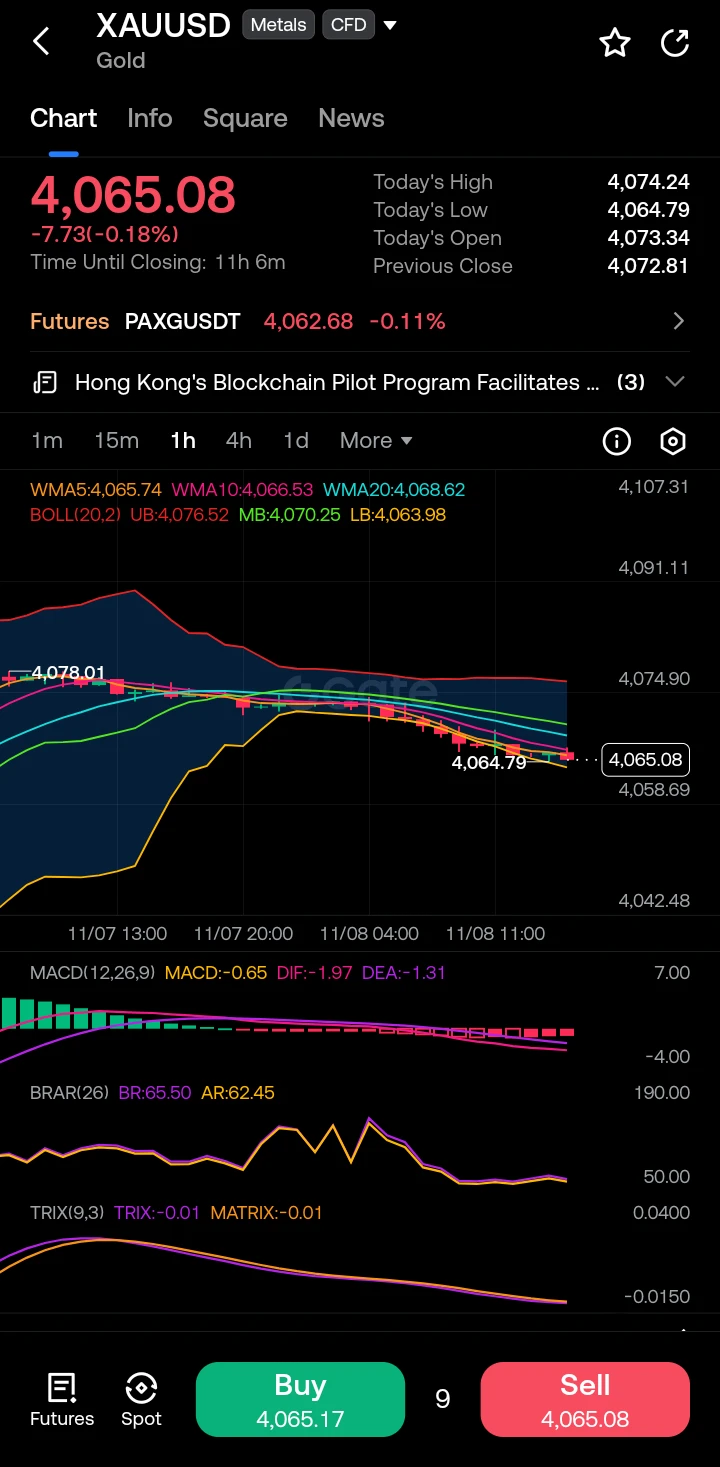
Looking at the 1-hour timeframe, Gold is displaying a clear bearish structure, having broken down from the 4,078 level and establishing a series of lower highs and lower lows. The price is currently pinned to the lower Bollinger Band (LB: 4,063.98) and trading below all three short-term WMA averages (WMA5: 4,065.74, WMA10: 4,066.53, WMA20: 4,068.62), which are fanning out downwards as dynamic resistance. Crucially, the MACD is fully submerged in negative territory with the histogram expanding to the downside (DIF -1.97, DEA -1.31), confirming strong bearish momentum. The TRIX oscill
post-image
XAUUSD-0.45%
Load More

Join 40 M users in our growing community

⚡️ Join 40 M users in the crypto craze discussion

💬 Engage with your favorite top creators

👍 See what interests you

Trending Topics

USCPIDataIncoming

6.81k Views1.56k Discussing

The U.S. October CPI report will be released on November 10 at 8:30 a.m. ET. September CPI came in at 3.7% year over year, and markets will be watching closely for signs that inflation is cooling, especially in core CPI. A softer-than-expected reading could strengthen rate-cut expectations, while hotter inflation may pressure risk assets through higher Treasury yields and a stronger dollar. How do you think this CPI print will move $BTC, U.S. stocks and gold?

USAIStocksHitHard

26.34k Views3.72k Discussing

USNonfarmPayrolls

48.5k Views4.45k Discussing

View More