
Square
Following
Hot
News
Notifications
Profile
Share your thoughts
placeholder
Article
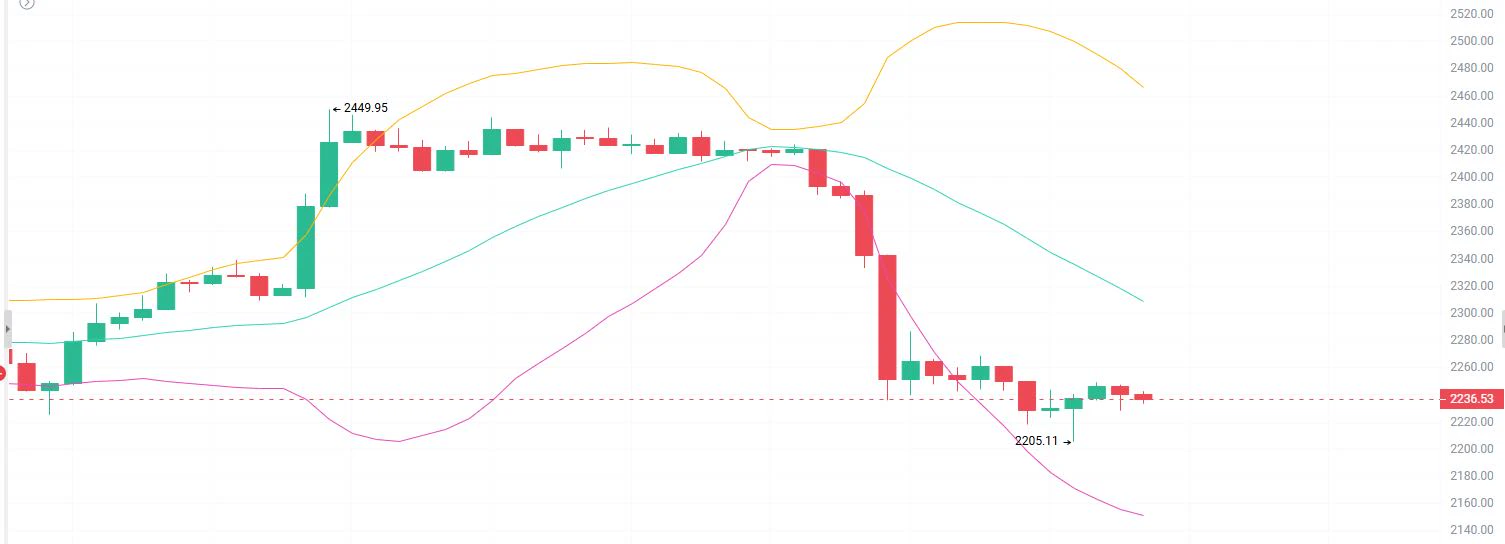
11.6 ETH Analysis

Analysis: Short near 2250-2270 on a rebound, with a stop at 2290. First target: 2220; second target: 2205.

The actual 1H chart shows that after rising to a period high of 2449.95, the price came under pressure and pulled back, closing with a long bearish candle on increased volume and breaking through key support levels in succession. It dipped to a low of 2205.11, and is currently quoted at 2238.32. The short-term uptrend structure has been broken, with concentrated selling pressure from bears. The market has officially entered a weak correction phase. After becoming overs
post-image
ETH-1.26%
$AIN After staying at these highs for so long, it’s starting to move. Net selling volume over the past half hour is 2M. Are we going to repeat the same mistake?
post-image
AIN+3.85%
  • 1
Trenches
fxUSD
f
bade
b
fxUSD
0x08...d8f6
Market Cap
$.
Change
.
24h Vol
$.
Holders
.
ZIG
Z
bade
b
ZIG
0x8c...1145
Market Cap
$.
Change
.
24h Vol
$
Holders
.
BTC
B
bade
b
BTC
C5xp...pump
Market Cap
$.
Change
.
24h Vol
$.
Holders
.
CORLA
C
bade
b
CORLA
0xba...7777
Market Cap
$.
Change
.
24h Vol
$.
Holders
.
STONK
S
bade
b
STONK
6GmA...UNgx
Market Cap
$.
Change
.
24h Vol
$.
Holders
.
Are U.S. stocks done for? Why such a sharp drop?
Last night, U.S. stocks took on the feel of a market crash, with the Magnificent Seven shedding $1.04 trillion in a single day. The irony is that just the day before, the Dow had surged 1,569 points to celebrate the election results. The market first celebrated the “elimination of uncertainty,” then realized uncertainty had simply shifted direction—from “who will govern” to “can AI keep burning through this much cash?” Three factors came together: ① Democrats not only won both chambers, but also the Texas and Georgia governor races; data center
post-image
BTC-0.65%
ETH-1.23%
NAS100+1.80%
Morning update with skyvera
live-cover
LIVE1,870
#10月非农数据聚焦 #WCTCS9 The market has already priced in a December rate hike as highly likely, so weaker-than-expected data could also be interpreted as a sign of a weakening economy. For now, reduce leverage and trim positions, then wait for the data before deciding on direction.

Trading strategy
Positions: Lower leverage and keep sufficient margin to avoid holding large positions around the data release.
Orders: When placing orders on both sides, guard against slippage; execution prices may differ from quoted prices.
Stop-loss: Set stops wider to avoid sharp volatility in the first few minutes
post-image
BTC-0.67%
  • 3
🚨 U.S. Midterm Elections Trigger AI Regulatory Storm: This Could Mark a Major Turning Point in the AI Investment Thesis
This is no ordinary pullback—the AI industry may be facing a major shakeup!
After the U.S. midterm elections, regulation of AI data centers suddenly became a market focus. According to an NBC Election Day poll, 76% of respondents opposed building new data centers in their communities!
Why? Because AI giants are making a fortune, while local residents worry about rising electricity bills, water consumption, and environmental strain!
Wall Street reacted fast!
📉 The Nasdaq plu
post-image
NAS100-0.07%
NVDA-9.33%
AMD-17.64%
BTC-5.05%
MSFT-3.65%
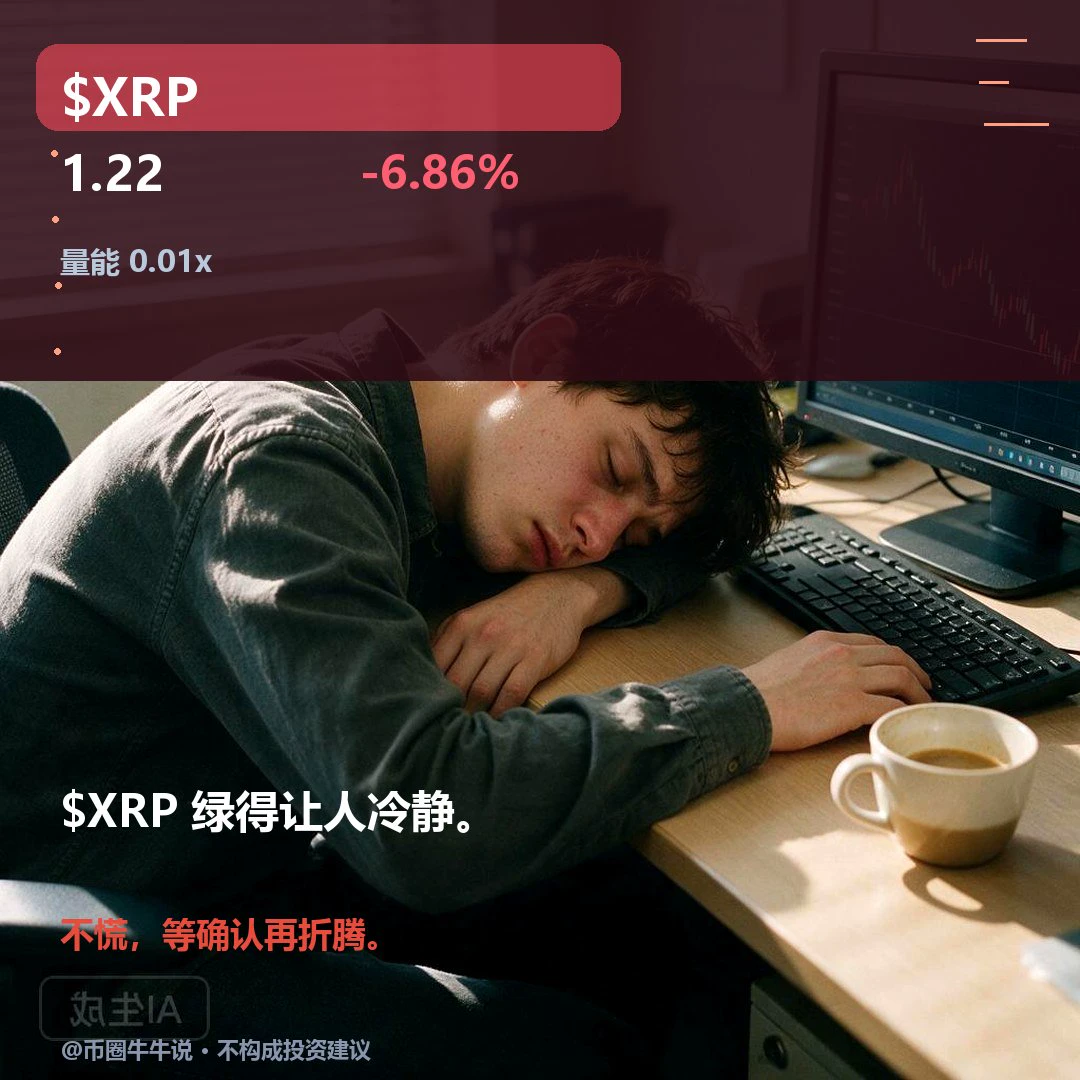
$XRP Currently trading at 1.2181, down 6.86% over 24H, with an intraday range of 1.1995–1.3269. 1H is weak: RSI is 18.53, and the current price is below the EMA20 at 1.2490; 4H is weak: RSI is 37.18, and the current price is below the EMA20 at 1.2664. The 1H volume ratio is 0.01. If price holds above the 1.3269 resistance level, watch for continuation; if it breaks below the 1.1995 support level, the short-term outlook weakens. In a later review, check whether price can hold above 1.3269 and whether it can reclaim 1.1995 after losing that level; with volume at only 0.01x, a single break needs
post-image
XRP-1.15%
BTC PREDICTION MARKET UPDATE
live-cover
LIVE2,107
【November 6 | Morning Market Update and Macro Risks】
First, the facts: BTC is around $76,170. The weekly and daily charts remain in a pullback structure. It has rebounded from the 4-hour low of 75,158 but remains capped by the moving averages. ETH is around $2,239, consolidating weakly on the 4-hour chart. The Nasdaq screenshot shows risk assets under pressure across the board, with the market in a risk-off and deleveraging phase.
Key BTC levels: 75,150–75,000 below; a break below that puts 74,000 in focus. 77,500–78,000 above; reclaiming that range would open room for a recovery. ETH support
post-image
BTC-0.67%
ETH-1.26%
NAS100+1.80%
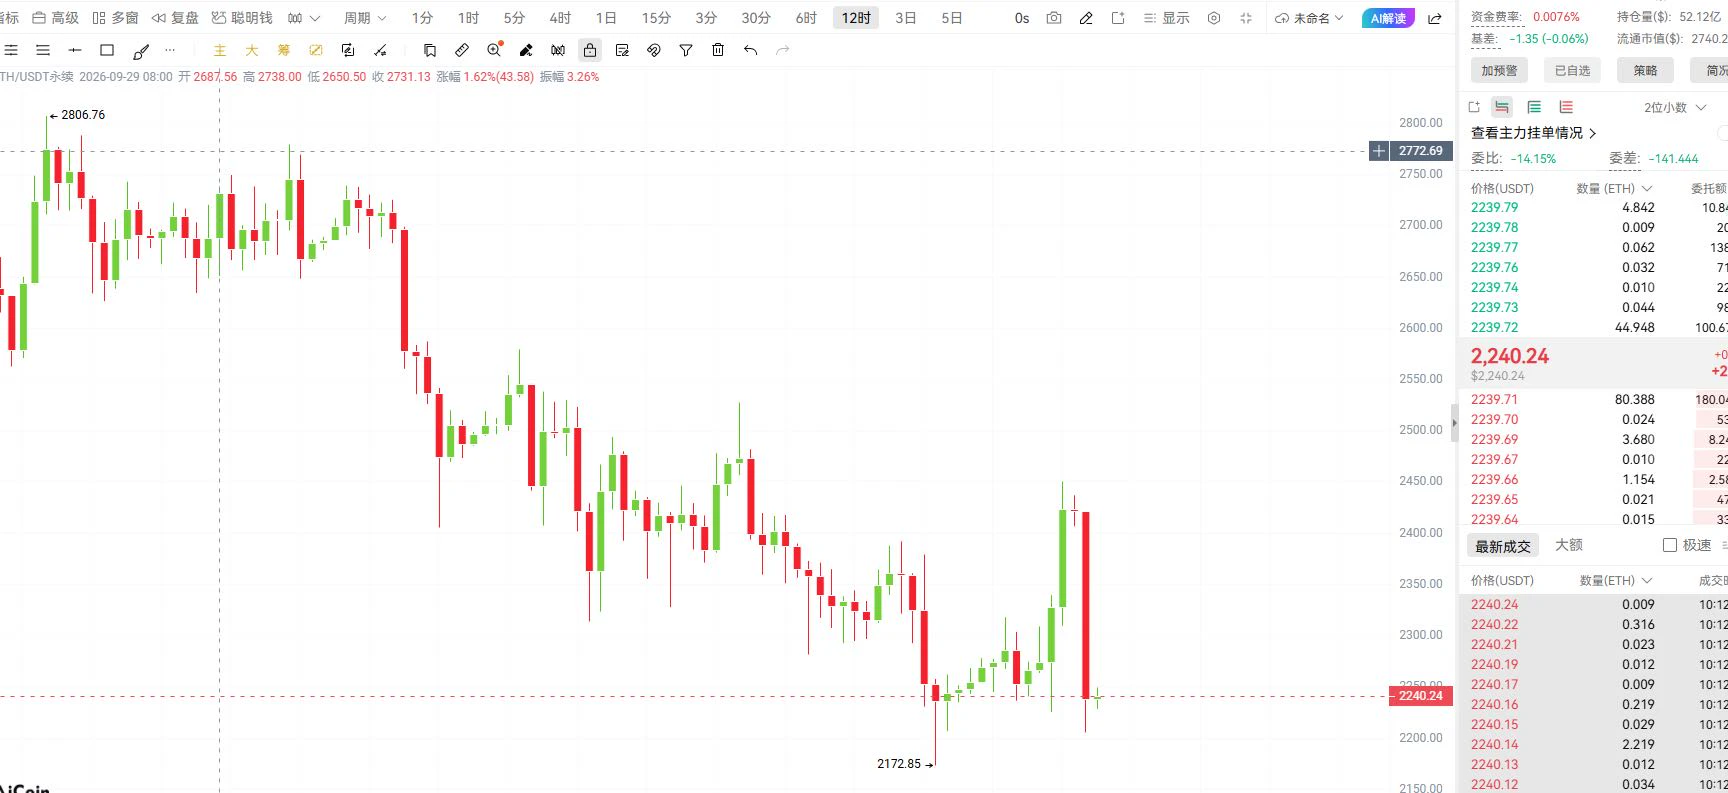
U Sis 11.6 Friday$ETH Strategy

Entry: Short on a rebound around 2290-2310
Stop-loss: Above 2335
Target: 2240-2210
Go long near 2180 if it retests and holds
Stop-loss: Below 2155
Target: 2240-2270

On the 12-hour timeframe, price has been in a choppy downtrend since peaking at 2806.76, with successive lower highs as bears control the pace. After hitting a low of 2172.85 earlier, it staged a rebound, but the recovery was limited and failed to reverse the broader downtrend. Price is now pulling back again, making this a consolidation phase within the downtrend. Short with the trend if a rebound
post-image
ETH-1.23%
🚨 Signal card · just captured
Source: Aesthetic_Meow Asset: $T Short entry: 0.004624 Targets: 0.0046001886 / 0.0045874891 / 0.0045763771 Stop-loss: 0.0046557486
Come to think of it, I reposted this person's $FOGO trade earlier today, and here they are again—their reflexes are seriously quick.
As usual: I only relay the info; judge for yourself whether it's legit. Whether to follow and how much to put in is up to you, dear 😤
Personal notes shared for informational purposes only, not investment advice. #US stocks AI sector trends diverge: cloud service providers strengthen while data cen
FOGO-3.35%
My penis says Jaguars take it home tn 🐆 Who you got?
post-image
AI Bubble Bursting? Nasdaq Falls More Than 5% in a Day

The U.S. stock market is best at making you feel like an investing genius one day, then making you question your life choices the next.
On Thursday, the Nasdaq fell more than 5%, and the Philadelphia Semiconductor Index dropped more than 12%, as AI and chip stocks faced a brutal sell-off. In the face of such a sharp correction, one question quickly became the market’s focus: Is the AI bubble about to burst?
Don’t rush to conclusions.
The AI industry has not stopped developing just because stocks have fallen, and companies’ demand for comp
MU-17.23%
$ETH 🔎 #ETHDrops5.5% 👀 ‌ ‌Is the 5.5% drop in ETH driven by price action alone, or is there something else at play?

While everyone in the market is talking about ETH’s 5.5% decline, the real story isn't found on the price chart; it lies in the quiet accumulation by an institutional "whale" amidst a brewing macroeconomic storm.

Over the last 24 hours, ETH has fallen sharply to the $2,252 level, resulting in the liquidation of positions held by approximately 199,000 investors. However, this decline is not merely a case of a flight to safety; it is being shaped by a combination of tightenin
ETH-1.26%
  • 6
  • 2
Which signals indicate that BTC's upward momentum is weakening as it rises?

In crypto trading, many people see BTC continually making new highs and assume the uptrend remains strong. In reality, however, rising prices do not mean upward momentum is always strong. What really matters is whether the market forces behind the price are changing.

There are four signals worth watching closely.

First, trading volume keeps shrinking. If the price continues to rise while trading volume gradually declines, the buying pressure driving further gains may be weakening.

Second, the RSI shows bearish dive
post-image
BTC-0.67%
#WCTCS9 #BTC
Bitcoin Market Analysis – November 2026 Update

Bitcoin is currently trading in the $75,800–$76,400 range after a sharp drop from levels above $80,000. As of the latest data around November 5–6, 2026, BTC sits near $76,000–$76,200, reflecting a decline of approximately 5% to 6% in a single session from highs near $80,800–$81,000. The 24-hour range has stretched from roughly $75,000–$75,600 lows to $80,800–$81,000 highs, with trading volumes elevated during the sell-off.

Market capitalization remains around $1.52–$1.53 trillion. Over the past week the move is roughly flat to mil
  • 4
$SKHY ‌Why do shares fall despite record profits?

The last two days for SK Hynix provide a clear answer to the question of why a stock might lose value even after reporting record profits.

The company announced record revenue of 104.6 trillion won and a record operating profit margin of 80% for the third quarter—surpassing the 100 trillion won threshold for the first time in its history. Yet, during the same period, its share price fell sharply, driven by concerns regarding U.S. policies on artificial intelligence.

This situation illustrates that investors are no longer focused solely on
post-image
SKHY-13.76%
  • 7
  • 2
Load More

Join 40 M users in our growing community

⚡️ Join 40 M users in the crypto craze discussion

💬 Engage with your favorite top creators

👍 See what interests you

Trending Topics

USStocksFaceHistoricSelloff

1 Views3.44k Discussing

U.S. stocks suffered a sharp selloff on Thursday, with the Nasdaq closing down more than 5% and the Philadelphia Semiconductor Index falling over 12%. AI and chip stocks including $NVDA and $AMD were hit especially hard. Markets are reassessing AI valuations, data-center spending and future returns. Is this just short-term deleveraging, or the start of a deeper correction in the AI trade? Which sectors are you watching next?

GateLaunchesPoSECProofOfSecurity

10.9k Views559 Discussing

USNonfarmPayrolls

8.57k Views3.96k Discussing

View More