Square
Following
Hot
News
Profile
Share your thoughts
placeholder
Article
🔥 WCTC S9 starts tomorrow. Just 24 hours to go!
Get ready to compete for a total prize pool of up to 6,000,000 USDT and an overall champion's gold medal valued at 30,000 USDT.
🏆 Teams: challenge three leaderboards with your squad
📈 Individuals: climb the ranks with eligible trading volume
⚔️ PK: face off in 30-minute rounds, compete on wins and earn streak bonuses
🎁 Register while logged in and get 1 free Lucky Launch
⏰ Trading begins October 23, 2026, 08:00 UTC
Only eligible data after registration and within the relevant competition period counts. Registration stays open until November 2
post-image
  • 11
  • 5
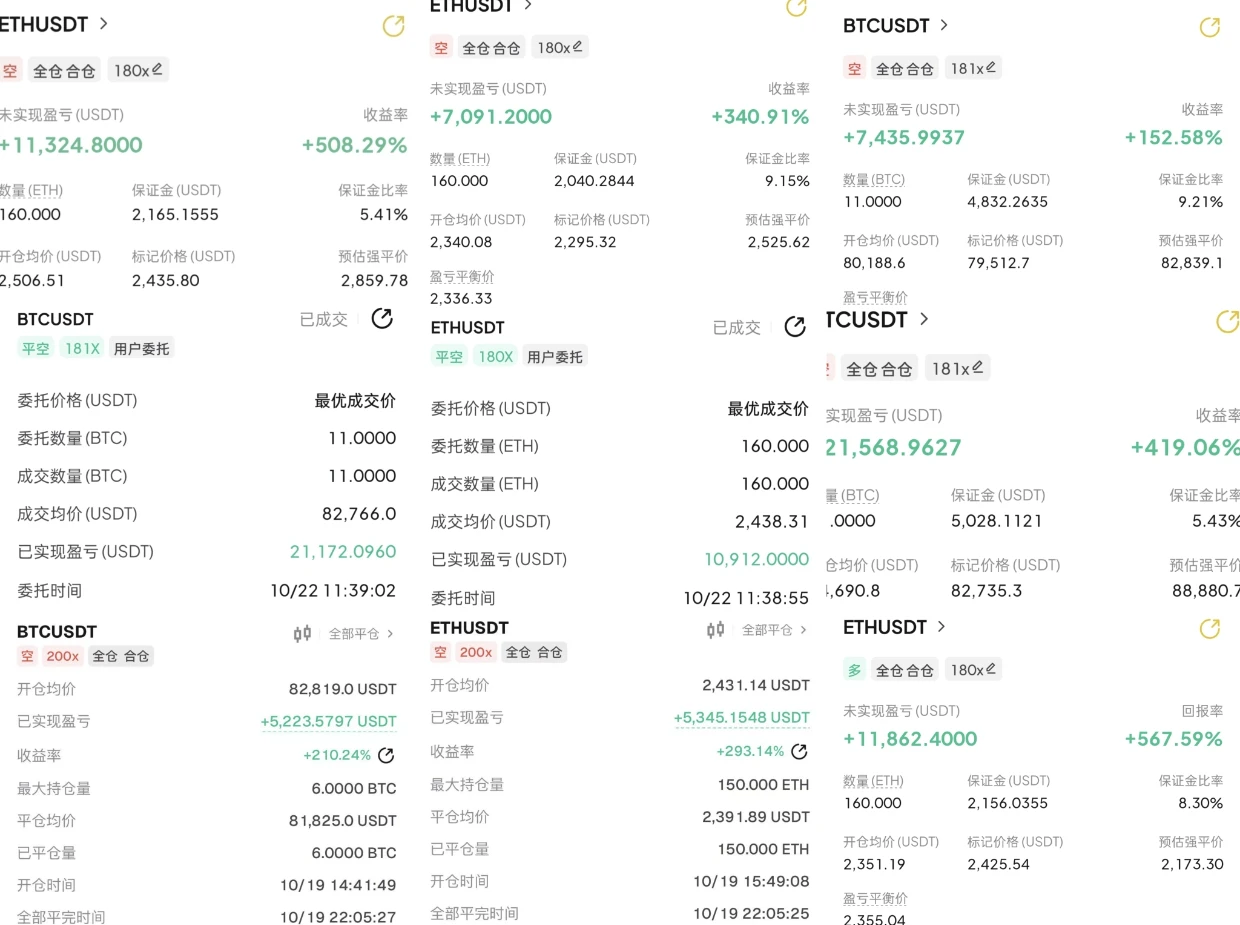
BTC 81,000 shorts cash in, ETH 2,370 shorts cash in
post-image
  • 1
Trenches
ZIG
Z
bade
b
ZIG
0x8c...1145
Market Cap
$.
Change
.
24h Vol
$.
Holders
.
CNPY
C
bade
b
CNPY
0xc6...ddd2
Market Cap
$.
Change
.
24h Vol
$.
Holders
.
STONK
S
bade
b
STONK
6GmA...UNgx
Market Cap
$.
Change
.
24h Vol
$.
Holders
.
BTC
B
bade
b
BTC
C5xp...pump
Market Cap
$.
Change
.
24h Vol
$.
Holders
.
LIGHT
L
bade
b
LIGHT
0x47...3c0e
Market Cap
$.
Change
.
24h Vol
$.
Holders
.
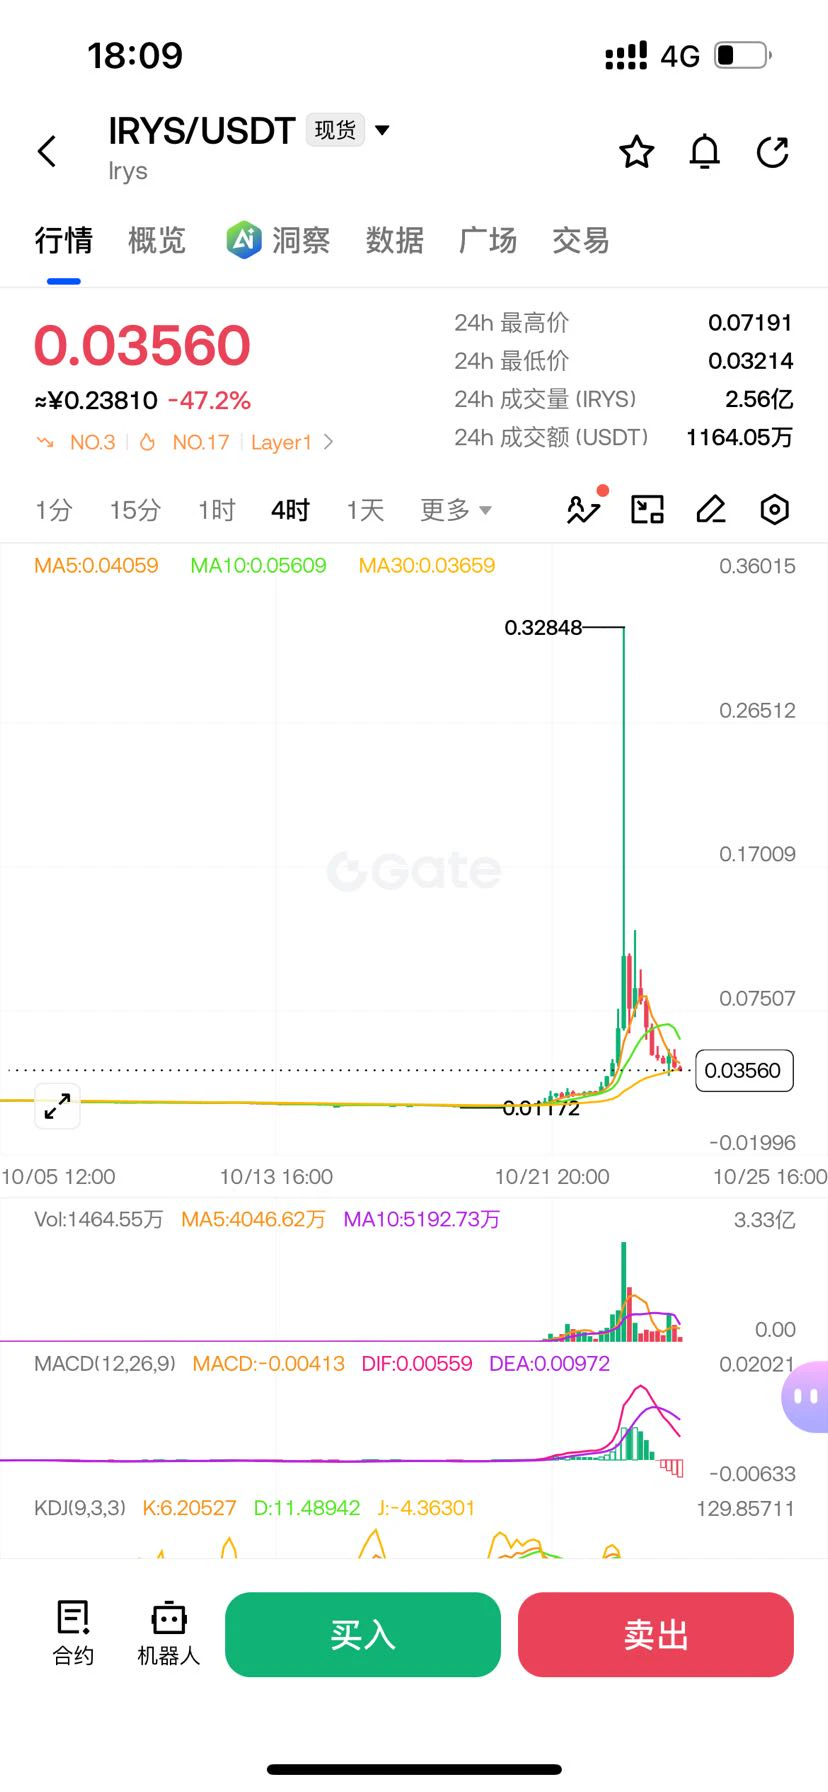
With something like $IRYS , I already went over it once at noon. Here’s another angle today: don’t watch the price, watch the people.
Someone in the group shared a screenshot, and it was at the top of the unrealized gains list. They started shifting positions around the 2200 level. I remember their exact words: “I’m not taking any more; I’m afraid I’ll get wrecked.” They’ve made it out of that cycle of going long, watching the trend flip, then turning around and going short. They’ve made money and nearly lost it all, and the first lesson they’re learning now is to protect what’s left.
I said th
post-image
IRYS-40.50%
Opened a new long position on $SAND
. Position details: Entry: 0.04773 - 0.04815 Take-profit A: 0.05016 Take-profit B: 0.05194 Stop-loss: 0.04630. Selling is still ongoing at the 24-hour low, and RSI is extremely oversold? A rebound after the bear trap is coming soon. Keep adding to the position! Try this trade here. The following assets are still on my watchlist: $SOL and $TAG .
post-image
TAG+16.36%
Seeing this is quite shocking
Dongxing dinner gathering changes, 9 years later:
----------------
Zhang Yiming 19x
Su Hua 10x
Lei Jun 3.5x
Wang Xing 3x
Shen Nanpeng 2.3x
Ma Huateng 2x
Yang Yuanqing 1.7x
Zhang Lei 50%
----------------
Cheng Wei down 30%
Liu Qiangdong down 30%
Liu Qiangdong down 25%
Yao Jinbo down 20%
post-image
$ETH , not Bitcoin, took the biggest hit from forced selling on Oct 24, with $124.0M liquidated and most of it from leveraged buyers. Recorded liquidations reached $414.6M, far above the 7 day average of $258.5M.
ETH-1.92%
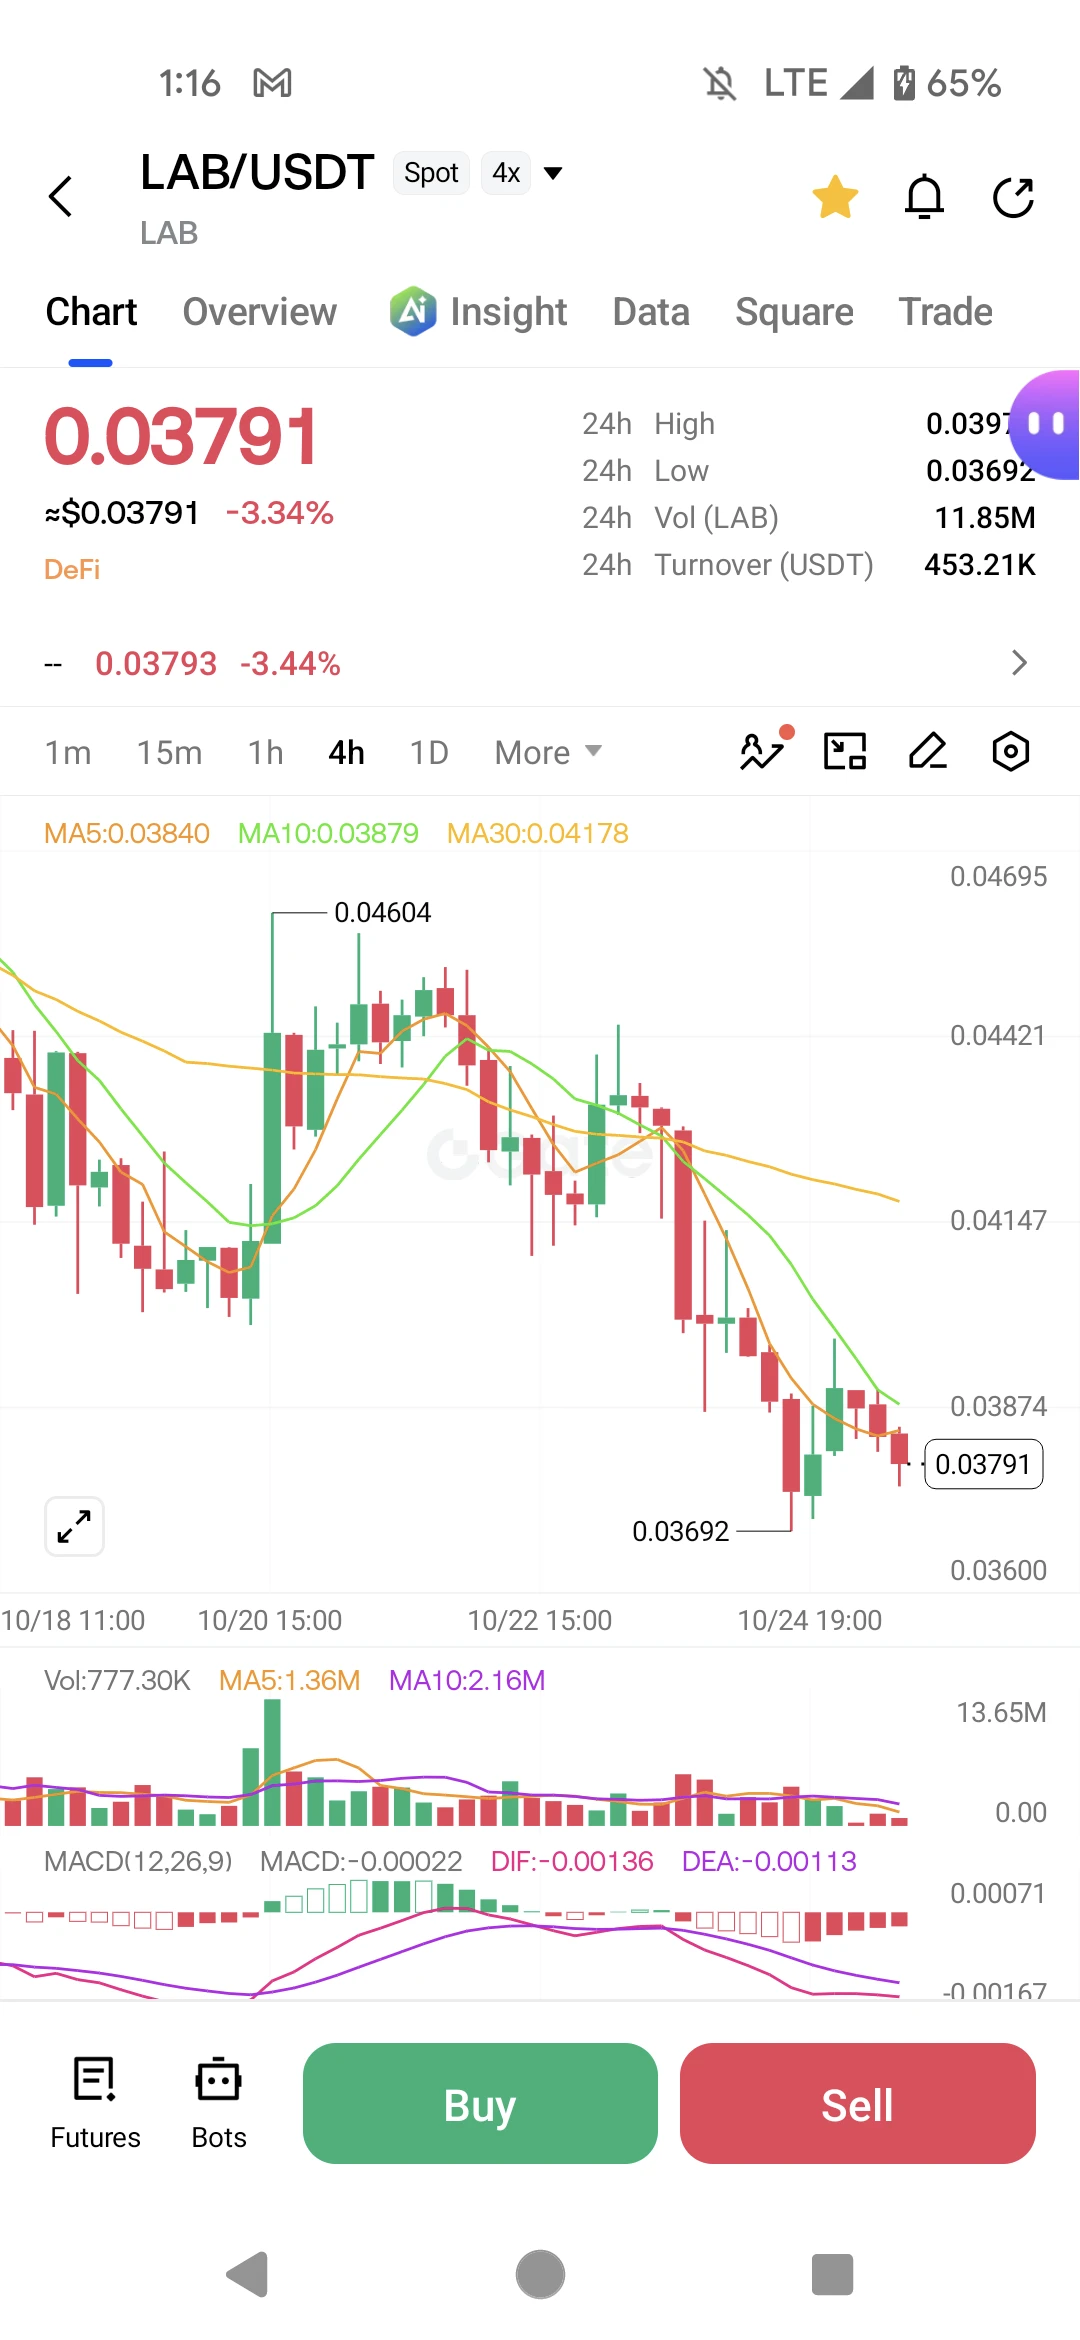
$LAB is caught in a relentless downtrend, and the chart shows no signs of a bottom as it continues to bleed out.
Trading Plan Short LAB
Entry: 0.03750 - 0.03820
SL: 0.04200
TP1: 0.03692
TP2: 0.03500
TP3: 0.03350
LAB is down 3.34% today at $0.03791, and the 4-hour chart is a clear picture of sustained selling pressure. The price is trading below all three key moving averages: MA5 at $0.03840, MA10 at $0.03879, and MA30 at $0.04178. This bearish stack confirms the bears are in full control.
The MACD is also deeply negative. The histogram is at -0.00022, and DIF at -0.00136 is sitting below DEA
post-image
LAB-4.44%
Take from Admin 2: everyone gets bullish at the top and bearish at support lol
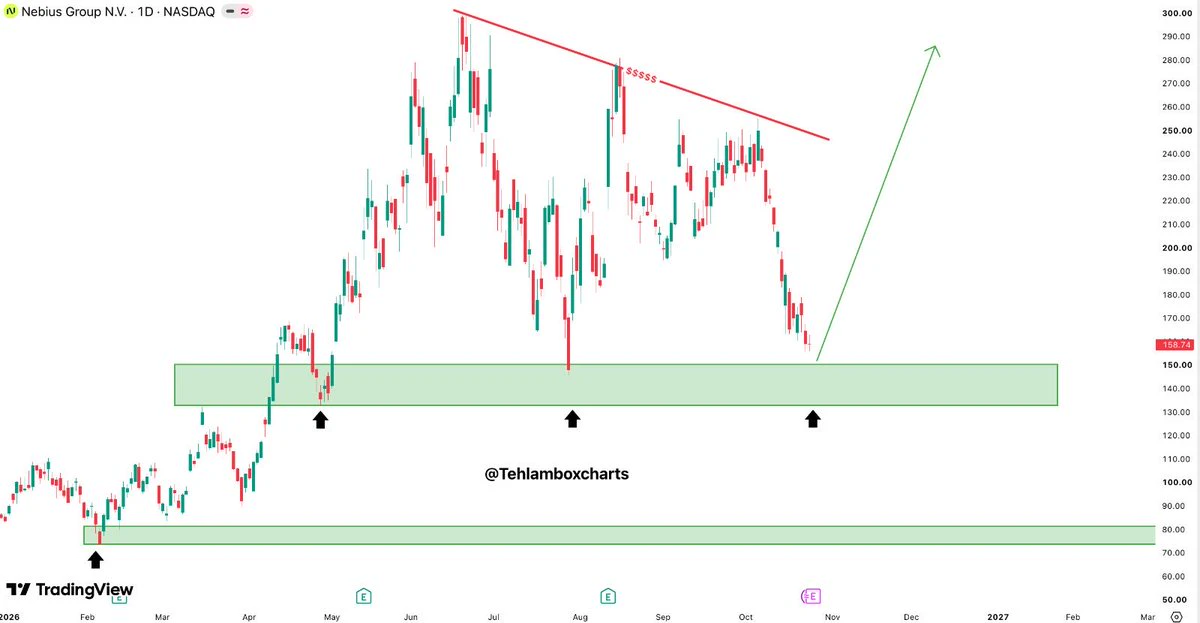
$NBIS is approaching $135–150 again
let's see if buyers defend the zone or if this dip has more pain left
post-image
NBIS-0.24%
Yesterday, $PONS recorded its lowest day of revenue, earning just $30,000.
A few months ago, it was pulling in almost $6M in a single day, and in September alone the protocol made $137M in fees.
So, the question on everyone's mind is: where exactly did all that liquidity go?
EXTRACTORS.
Last month, @WazzCrypto exposed an operation linked to 53 launches on Robinhood Chain over two months, with around $18.43M extracted.
$18M meant to circulate in the ecosystem.
$18M meant to go into the hands of true believers and committed devs.
$18M removed from Robinhood Chain forever.
They allegedly sniped
post-image
PONS-1.62%
BTCSOS just caught a new signal, reposted below:
📡 Source: AMAN Channel direction: $SUI Short entry: 0.91365Target: 0.882 / 0.863 / 0.842Stop loss: not specified
I’m just here to repost, not take sides. The stop-loss field for this signal is blank. Whether to follow it and how much to commit are up to you—short positions without a stop loss can teach you a harsh lesson when volatility picks up. The market hasn’t confirmed anything yet, so don’t treat this as a conclusion.
Personal notes shared for reference; not investment advice. #MultipleUSbanksrestrictAIAgentaccesstocustomeraccounts
SUI-4.00%
$BTC
80350 is stuck in the middle of the range. If it can't get above 80900, don't fantasize about a reversal. It's been hugging the weekly low for seven days, and the slow-bleed feeling hasn't gone away 😤 67% of people are still crowded into longs, holding on—and the longer they hold, the more they feed the shorts. Don't wait until it breaks 79180 to think about getting out; by then, it'll really be crashing 👀
post-image
BTC-0.43%
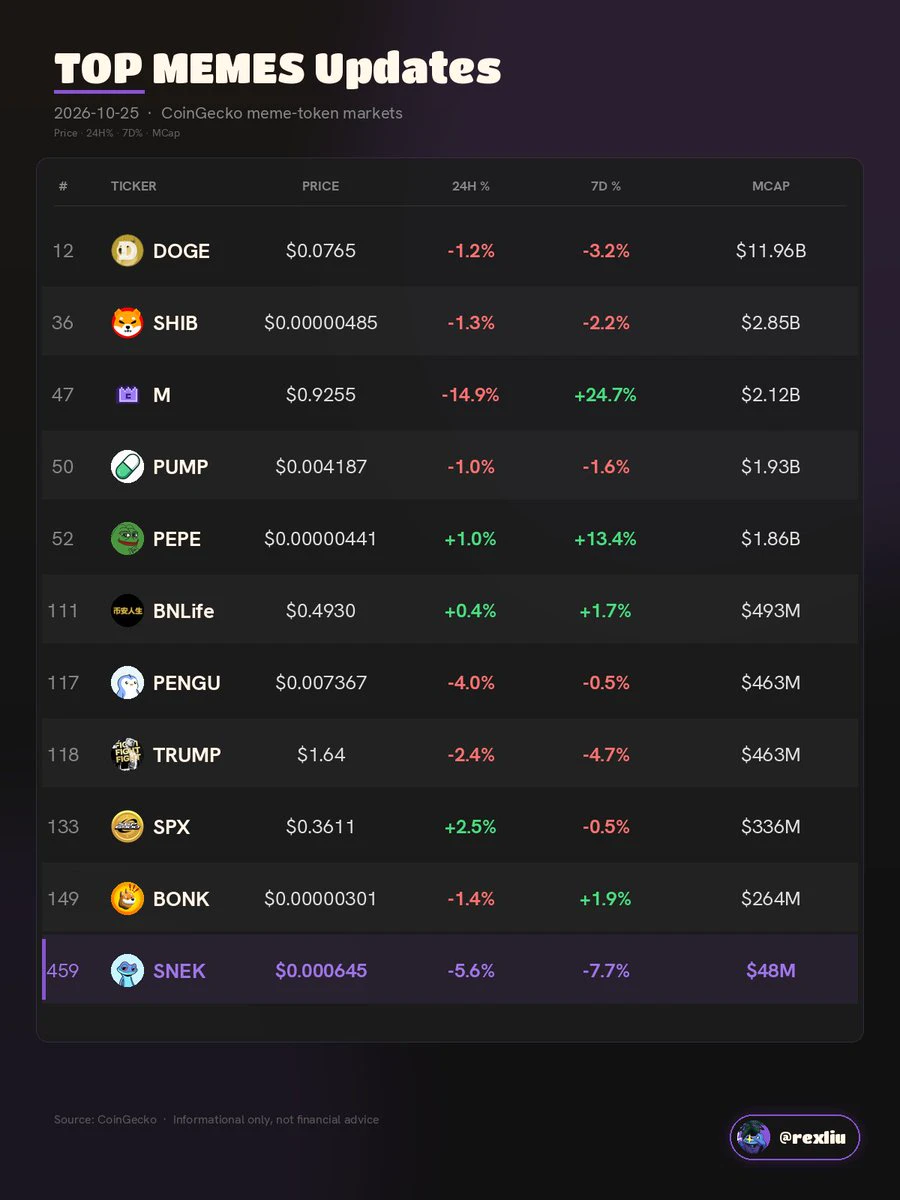
🔖Memecoin Report #21
$PEPE and $M ran while the dogs slept — and $M is still printing after a −15% day.
Over 7d CoinGecko shows $PEPE +13.4%, $M +24.7%, and $USELESS +19.5%, while $DOGE was −3.2%, $SHIB −2.2%, $WIF −10.3%, and $BTC itself −1.7% near $80.2K.
🌏Overview
This was a selective meme week, not a sector beta trade.
CoinGecko’s meme-token category sat near $28.6B on October 25 (query 18:42 Asia/Shanghai), down about 2.2% over 24h, after a midweek $PEPE spike that briefly pushed the frog back over $2B market cap on X before settling near $1.86B.
Bitcoin traded around $80.2K and lost ab
post-image
PEPE+0.63%
USELESS+5.80%
DOGE-1.35%
SHIB-1.44%
WIF-5.13%
#美股财报季 #Gate广场万圣节 AI computing power: Money is pouring in, supply can't keep up—so why did the stock price fall first?
AI computing power is still the lifeblood of the U.S. stock market—the demand is genuinely tight and money is genuinely pouring in, but stocks are no longer going up blindly. Put simply, the October pullback is about squeezing out the bubble and unwinding crowded trades, not a problem with fundamentals.

How strong is demand?
The four major cloud providers are expected to spend a combined roughly $725–730 billion on capital expenditures in 2026, nearly 80% more than last yea
NVDA-0.60%
ORCL+0.47%
CRWV-2.46%
MSFT+0.56%
AMZN-0.97%
  • 3
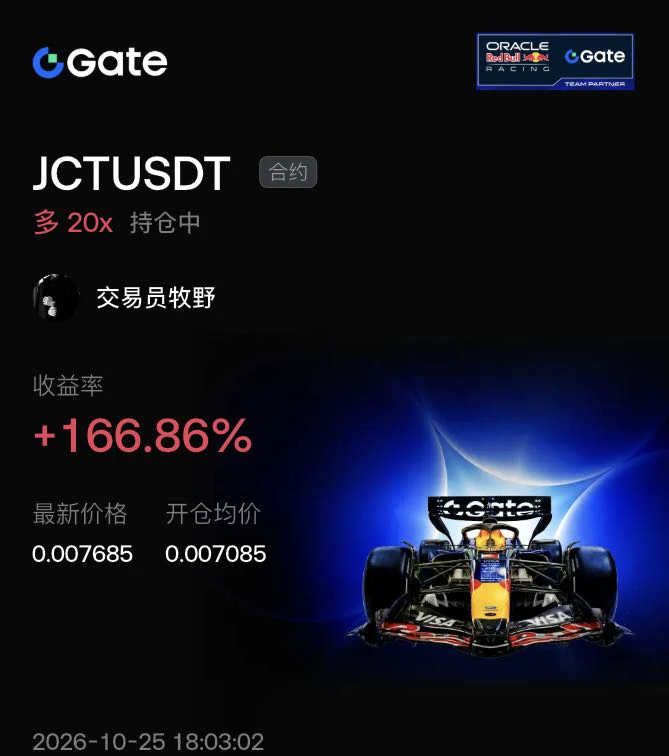
$JCT Frame it around “platform ecosystem, event warm-up, and concept hype,” benchmarking against emerging platform tokens, but it needs to prove sustained buying and practical use cases. Red Bull F1 helps accelerate🏎️
The move from 0.007085 to 0.007685 reflects early holders locking up tokens and insufficient depth. The market chose to pump it and liquidate shorts first, not sustained institutional accumulation.
The mainnet or partnerships can only serve as catalysts for short-lived spikes, but micro-cap coins often see traders buy the expectation and sell the news. A genuine trend reversal d
post-image
JCT+52.95%
BTC-0.48%
ETH-1.92%
[New Streamer] Market Prediction
live-cover
LIVE1,867
market price $xua
live-cover
LIVE1,877
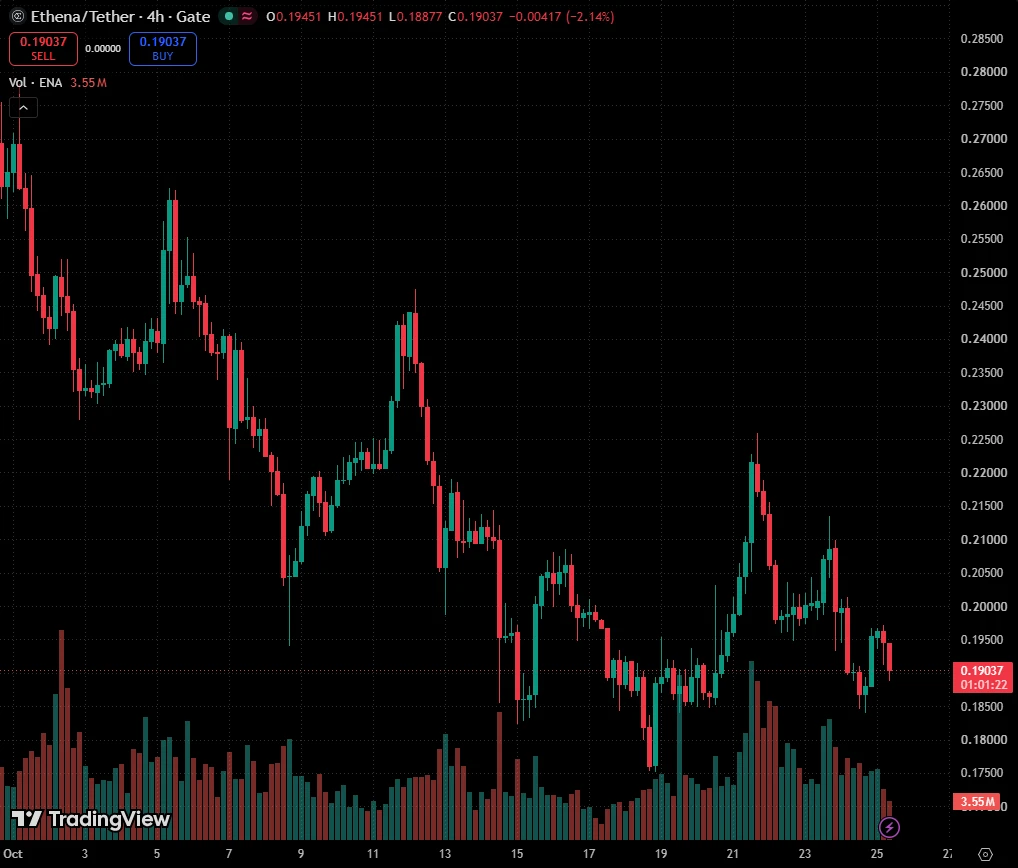
$ENA Hayes sold ENA. The floor is the problem. I sell under 0.1750
Arthur Hayes sent tokens to exchanges this weekend, 14M ENA of it (about $2.7M). That is under 3% of one day of ENA volume, so I do not think he is the problem. X is split between 'he is dumping' and 'second chance to buy'.
The chart is. Highs go 0.247 (12 Oct), 0.226, 0.214, 0.201, each one lower, and ENA sits under its 4H 200 average (0.204) and the daily 50 (0.196). The floor at 0.175 to 0.184 has been bought on five days since 15 Oct. Only about 4% of the volume since 18 Sep traded under 0.18, so there is not much to catch
post-image
ENA-0.07%
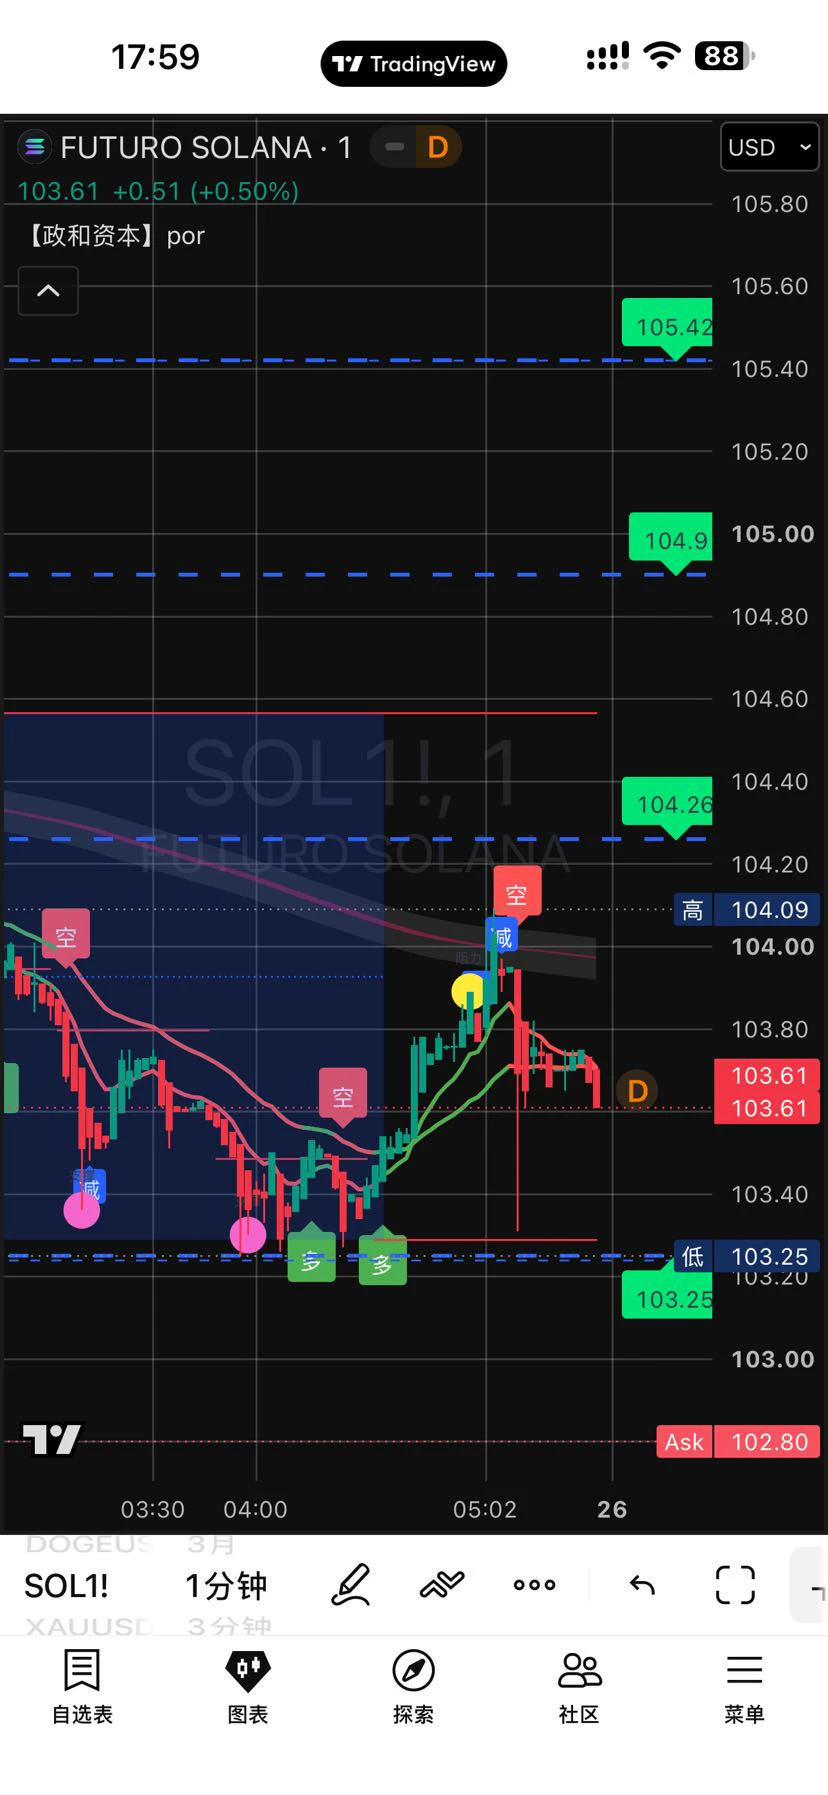
October 25, 2026 (Sunday) SOL Perpetual Futures Analysis and Strategy (as of approximately 18:03 HKT)
Current Market Overview
SOL is currently around $100.5–$102.0, down slightly by approximately 0.7–1.5% over 24 hours. On Saturday, it dipped to around $98.6–$99.5 before rebounding slightly. It is Sunday, traditional markets are closed, and liquidity in crypto markets is relatively thin, so volatility may increase.
The price has fallen below the $104–$106 range from the previous few days and is trading below most short-term moving averages. SOL has a strong correlation with BTC/ETH, and overal
post-image
SOL-1.04%
10.19-10.25 BTC and ETH Weekly Summary

BTC and ETH were highly correlated this week, riding a roller coaster as prices surged before retreating.

- BTC: Rose to 84888 before meeting resistance and sliding, hitting a low of 79192.8; currently trading sideways around 80290
​
- ETH: Turned lower after rising to 2526.64, dipping to a low of 2281.01; now consolidating around 2327.33

The moving averages for both turned downward in tandem, with prices continuing to trend lower and bears gaining the upper hand for now.
Although buying support emerged at the lows and sparked a slight rebound, neit
post-image
BTC-0.48%
ETH-1.92%
Load More

Join 40 M users in our growing community

⚡️ Join 40 M users in the crypto craze discussion

💬 Engage with your favorite top creators

👍 See what interests you

Trending Topics

USEarningsSeason

87.72k Views3.45k Discussing

The U.S. Q3 earnings season is in full swing, with major tech companies including Tesla and Meta reporting results. Market focus is shifting beyond revenue and profit toward AI spending, capital expenditure, margins and forward guidance. Which company’s earnings are you watching most closely?

GateWCTCS9GlobalTradingCompetition

684.91k Views8.01k Discussing

USConsumerSentimentNearRecordLow

9.41k Views267 Discussing

View More