Square
Following
Hot
News
Notifications
Profile
Share your thoughts
placeholder
Article
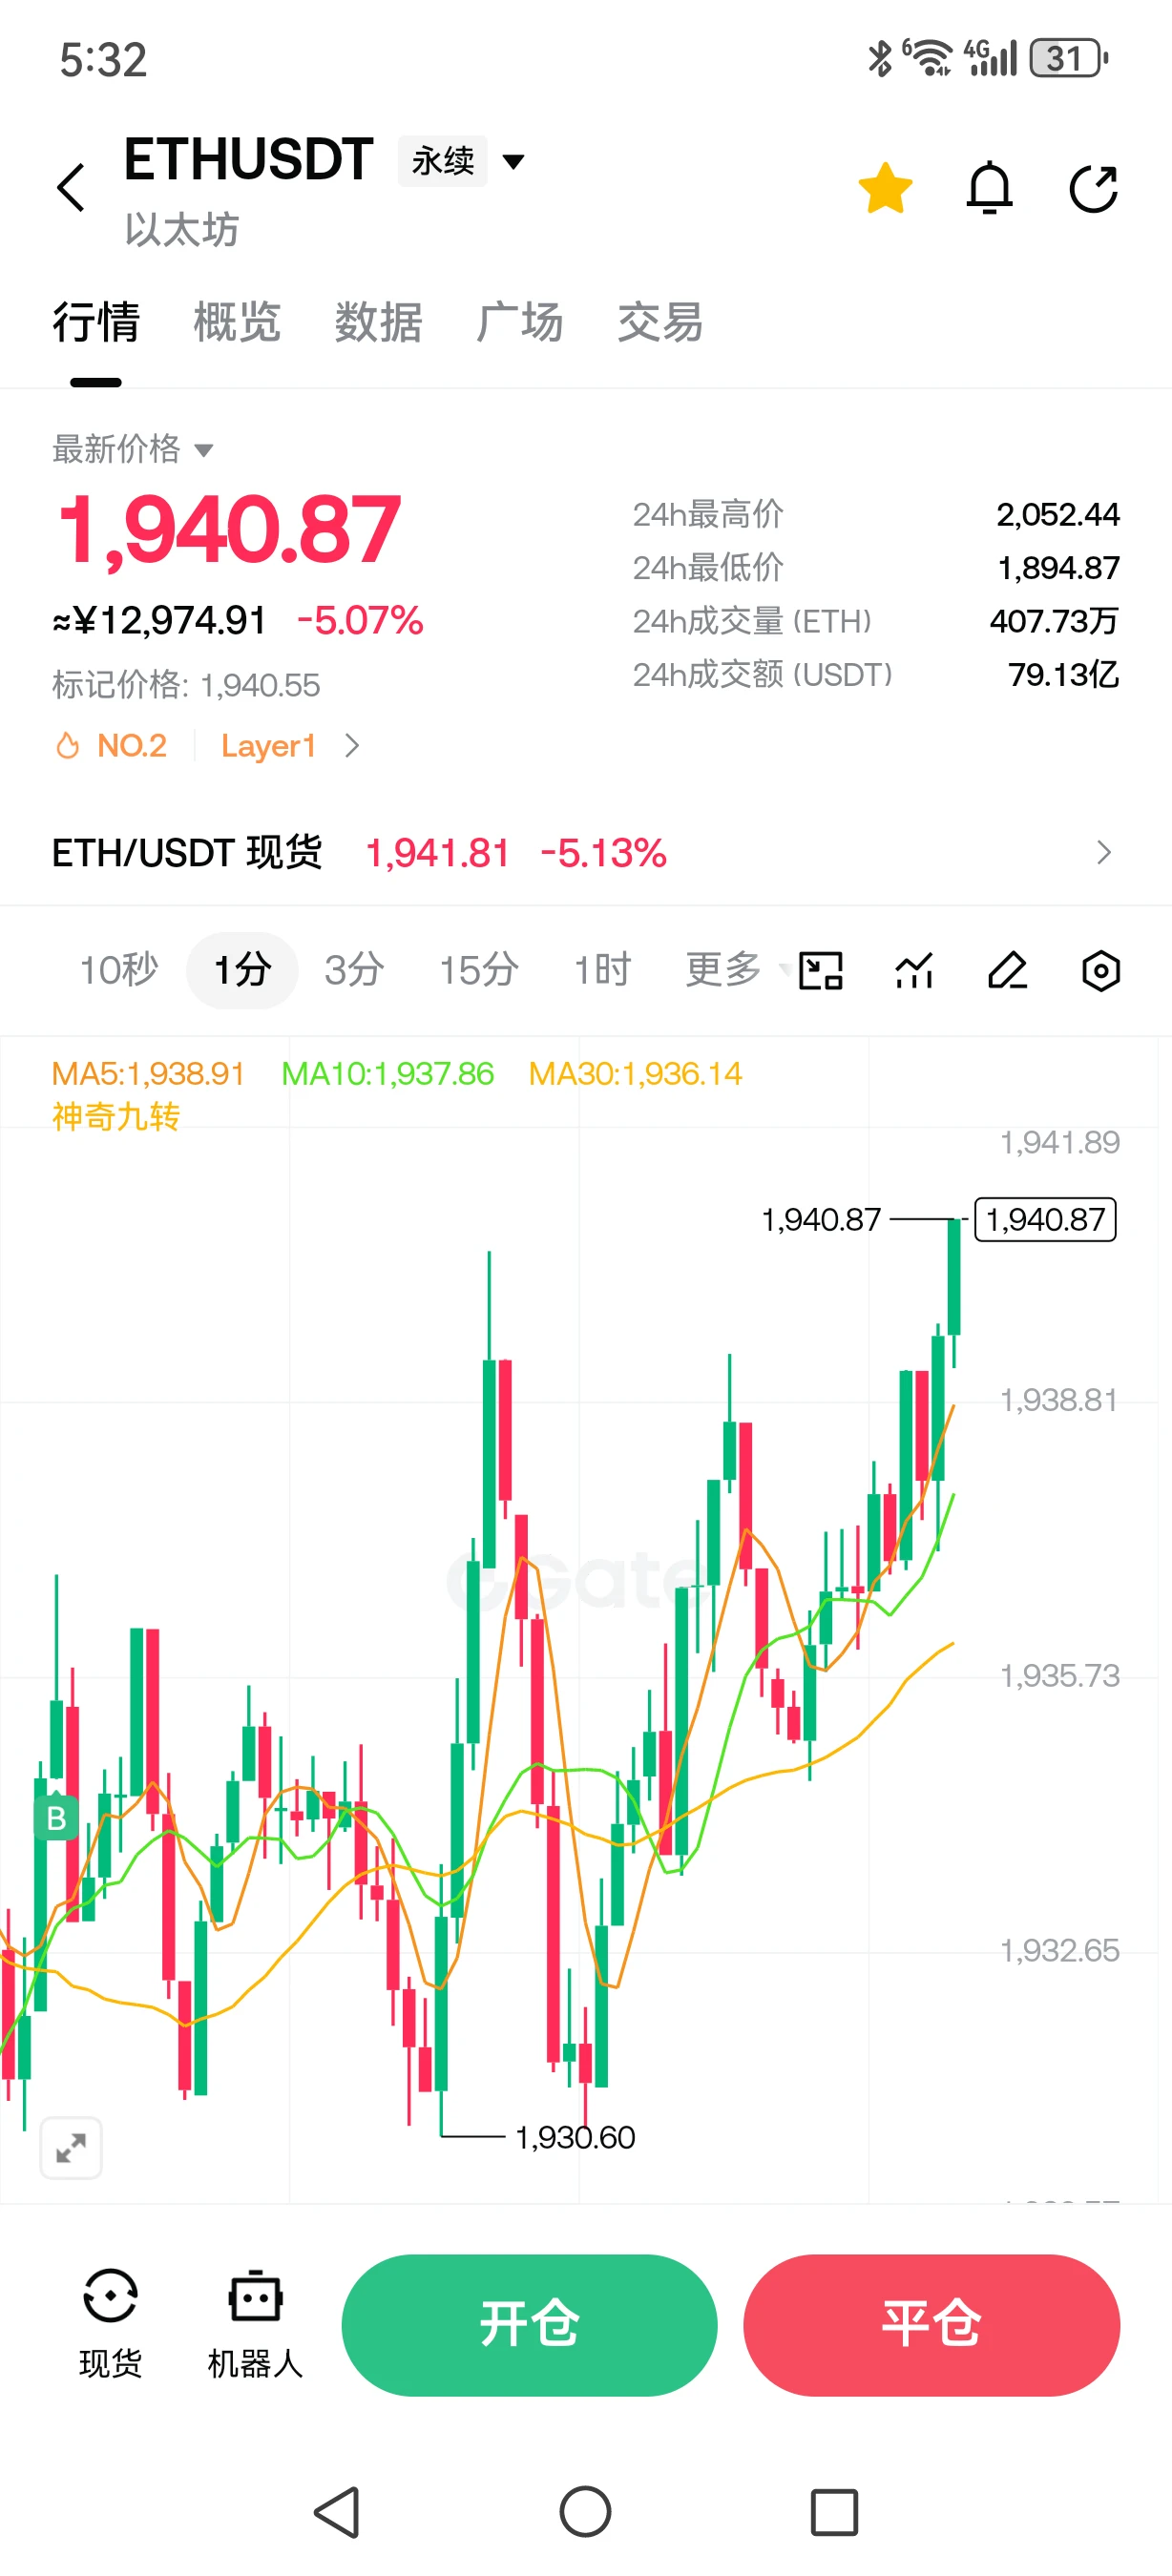
$ETH Go long around 1940, take profit at 1980–2080. Stop loss at 1910. Hold for the longer term this time. Follow me for precise strategies shared daily. I share strategies and trades in the livestream every night—go straight for the gains. Those who followed yesterday made big profits again.😀
post-image
ETH-1.26%
What Does It Mean When Price, Trading Volume, and OI All Rise?

In crypto derivatives markets, traders often watch for a particular combination: prices rise, trading volume increases, and open interest (OI) also rises.

Some see this as a sign of a strong rally, while others worry that the market is accumulating too much leverage. How should this combination be interpreted?

The key is that these data points can provide insight into market participation, but they cannot by themselves prove that prices will continue to rise.

First, what does a rising price mean?

A rising price means that the
post-image
Trenches
mihao
m
bade
b
mihao
4Cxj...pump
Market Cap
$.
Change
.
24h Vol
$.
Holders
.
AGT
A
bade
b
AGT
0x5d...e274
Market Cap
$.
Change
.
24h Vol
$.
Holders
.
FOOD
F
bade
b
FOOD
FTu5...pump
Market Cap
$.
Change
.
24h Vol
$.
Holders
.
IDOL
I
bade
b
IDOL
0x3b...ab07
Market Cap
$.
Change
.
24h Vol
$.
Holders
.
AI
A
bade
b
AI
2T56...pump
Market Cap
$.
Change
.
24h Vol
$.
Holders
.
After watching a product launch, you can now have AI create a first draft of your presentation.
Google’s newly released Gemini 4 Hydrogen was shown using a YouTube video and a template to generate Google Slides, then check whether any text overlaps.
You can try this prompt:
“Turn this video into an 8-slide presentation in Chinese, with one key point per slide. Mark key numbers with video timestamps and format it using the template I provided.”
post-image
There’s a shitcoin with trading volume lower than the trash in a garbage can.

They’re always saying how much your other coins have fallen from their highs—and that they’ve done even worse than ours—so our coin is retail investors’ chance to turn things around.

The truth is, those coins are still alive. Is yours? So love yourself and don’t buy shitcoins.
post-image
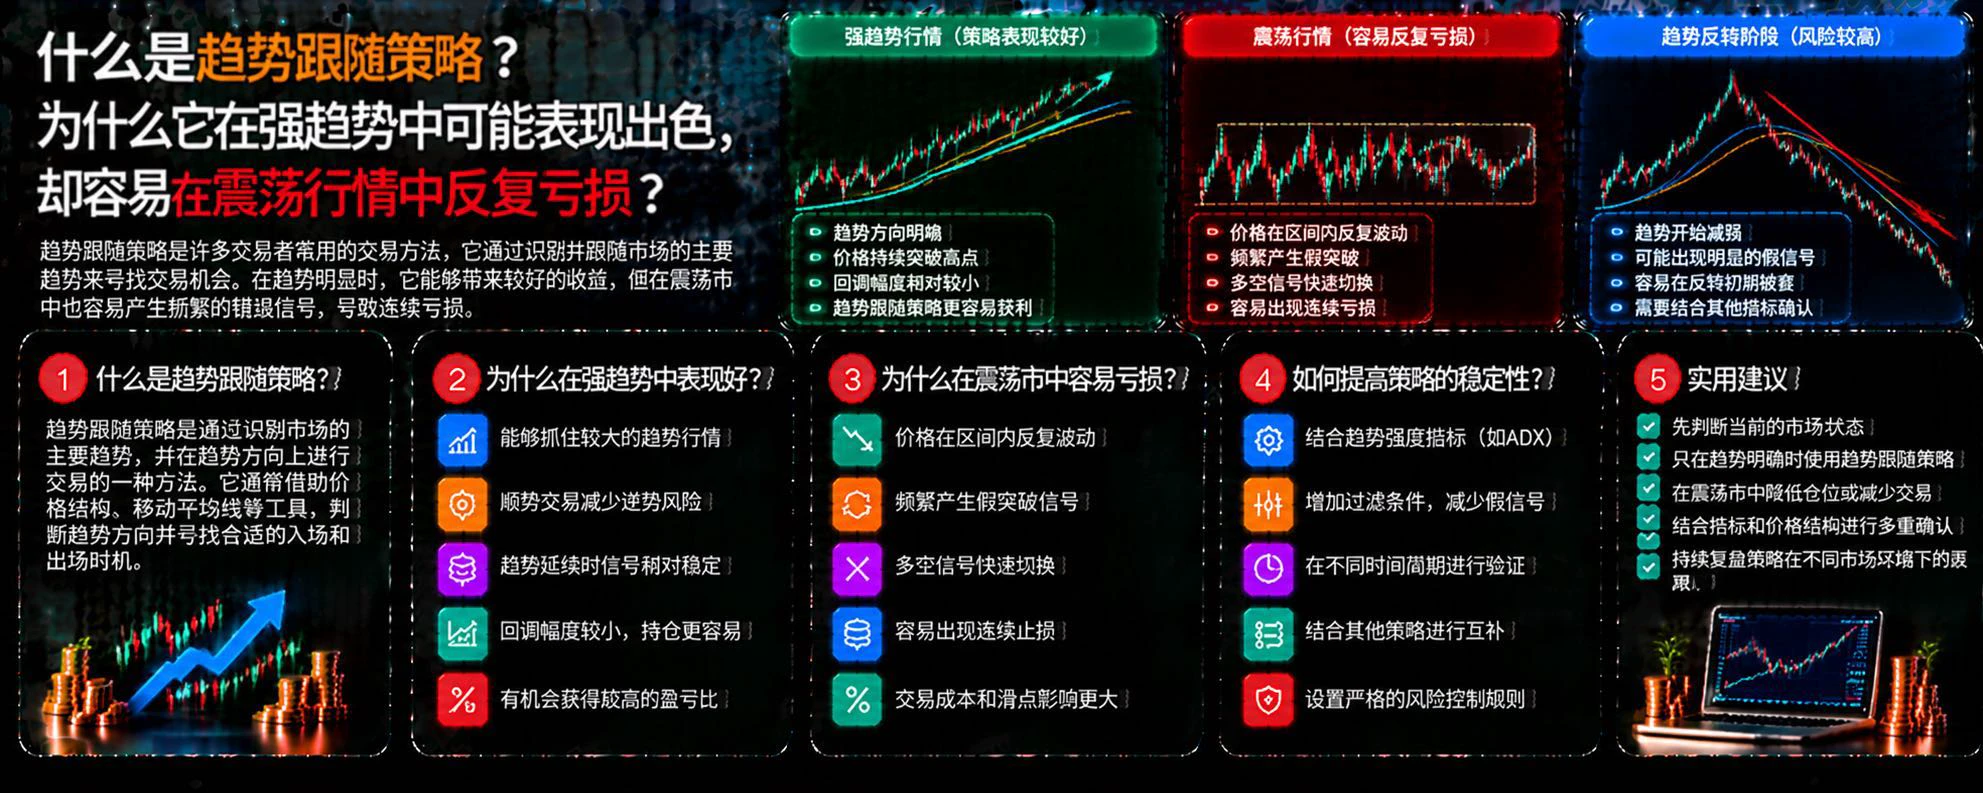
What Is a Trend-Following Strategy? Why Can It Perform Well in Strong Trends but Suffer Repeated Losses in Choppy Markets?

In cryptocurrency trading, trend-following is a common approach: instead of trying to predict tops and bottoms precisely, traders look for entry opportunities after a trend forms and try to follow it for as long as possible. But this strategy is not suited to every market environment.

First, what is a trend-following strategy?

A trend-following strategy identifies market direction through price structure, moving averages, or trend indicators, looking for opportunities t
post-image
$ARIA This crazy coin🙄 has recovered nearly 60% of yesterday’s drop. The bulls have basically been shaken out, and now it’s being pulled back up again, with a major rally ahead! ⬇️⬇️⬇️
post-image
ARIA+22.03%
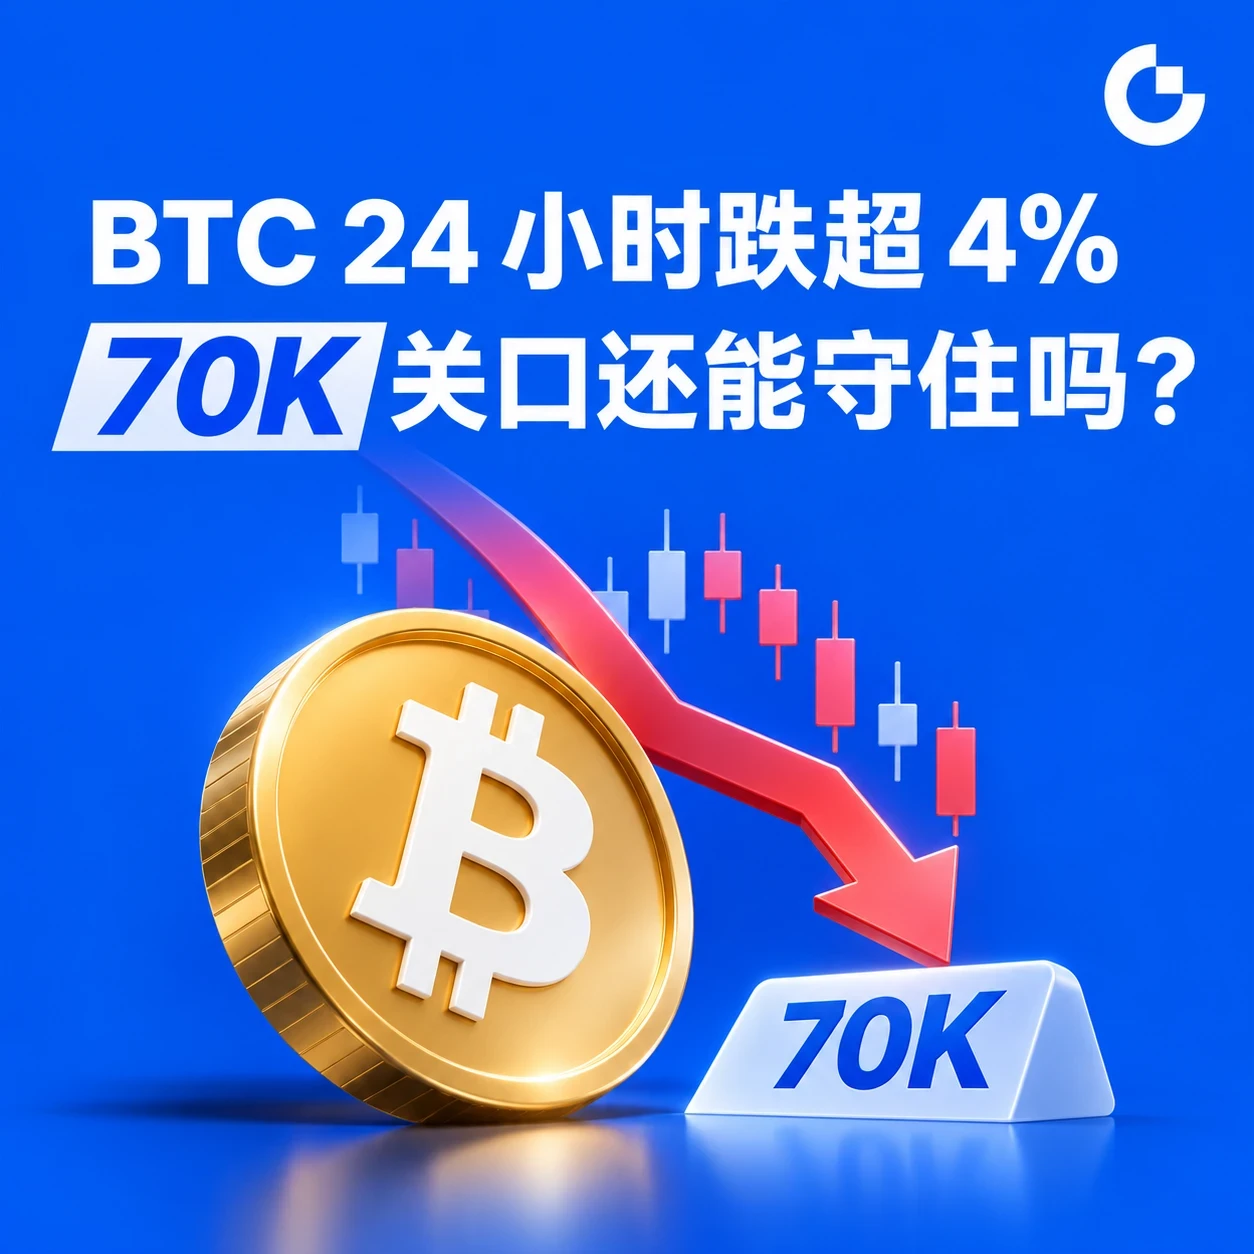
#BTCDown4%
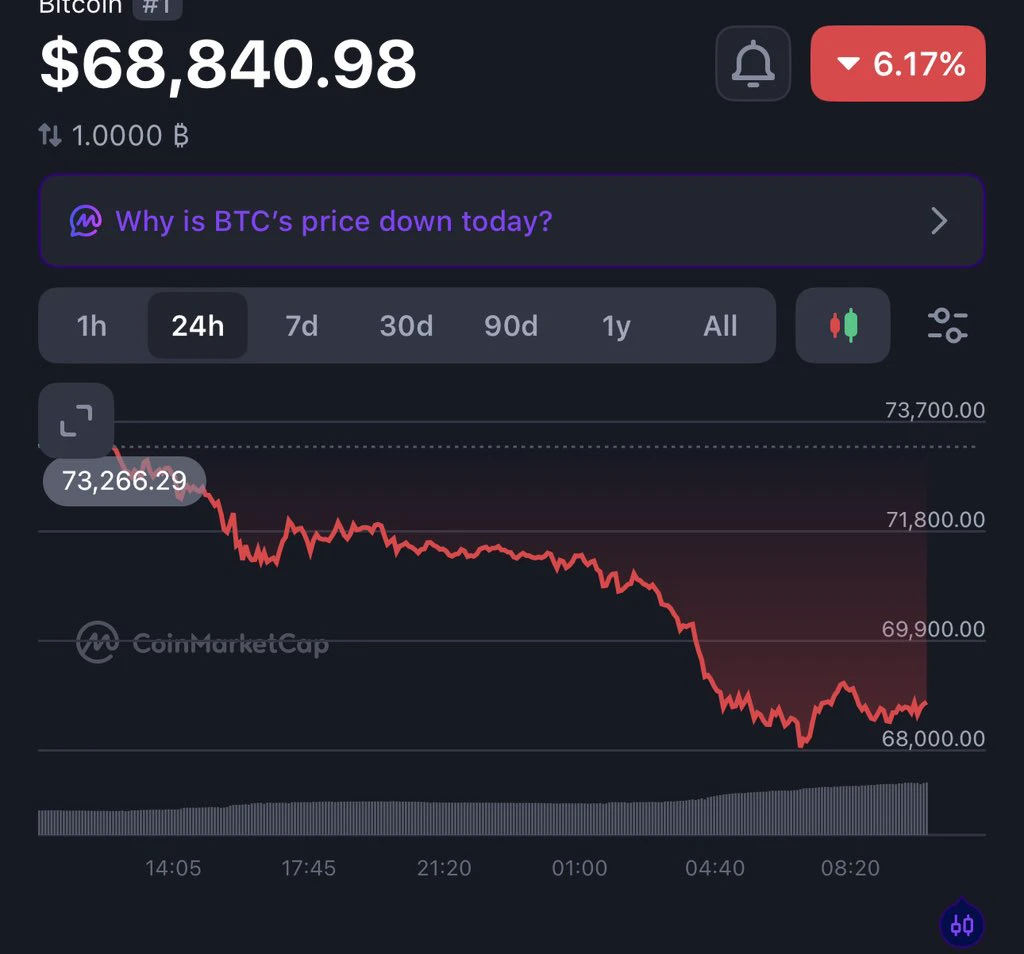
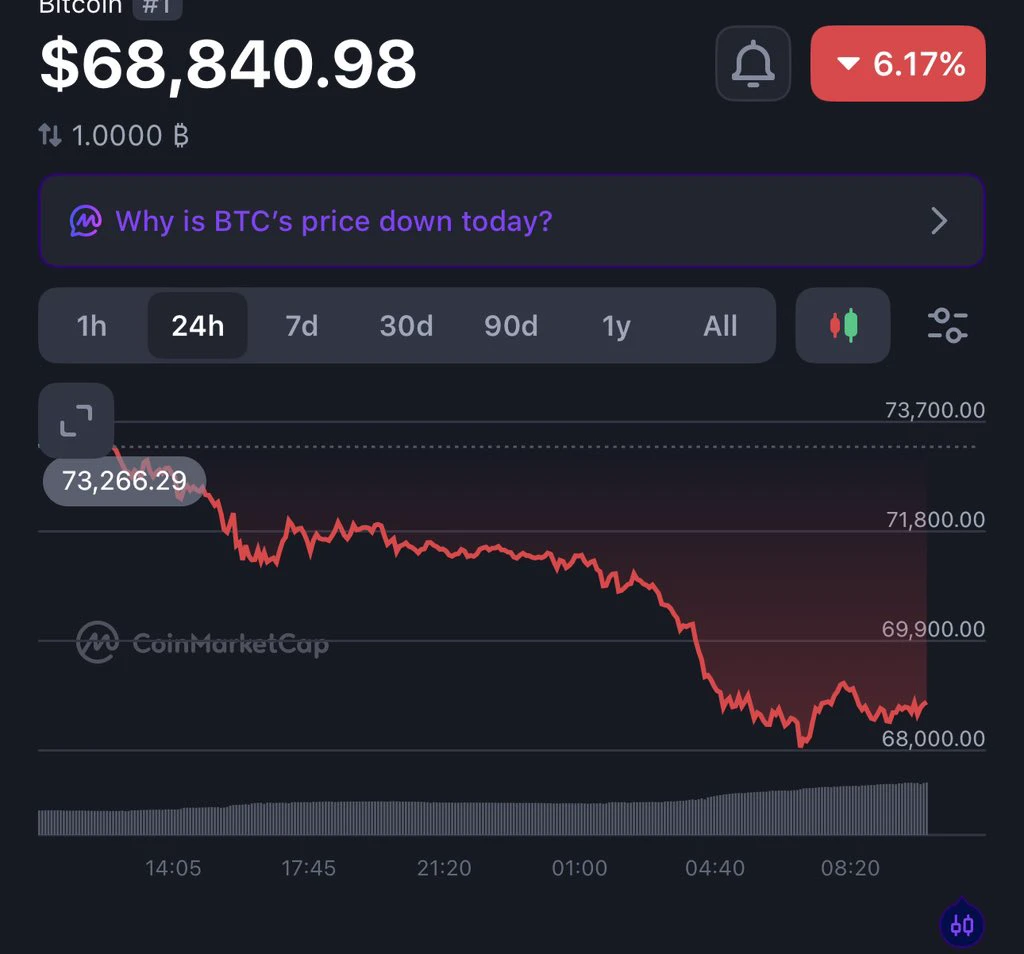
Bitcoin’s Fall Below $70,000 Signals a Deeper Shift in Market Sentiment — The Next Move Could Define Its Short-Term Direction

Bitcoin’s decline below $70,000 marks an important turning point in the current market structure. After trading considerably higher just days ago, the leading cryptocurrency is now testing price levels that could determine whether this correction develops into a deeper downturn or becomes the foundation for a recovery.

What makes this decline particularly significant is the combination of macroeconomic pressure, weakening institutional demand, and deter
post-image
BTC-0.67%
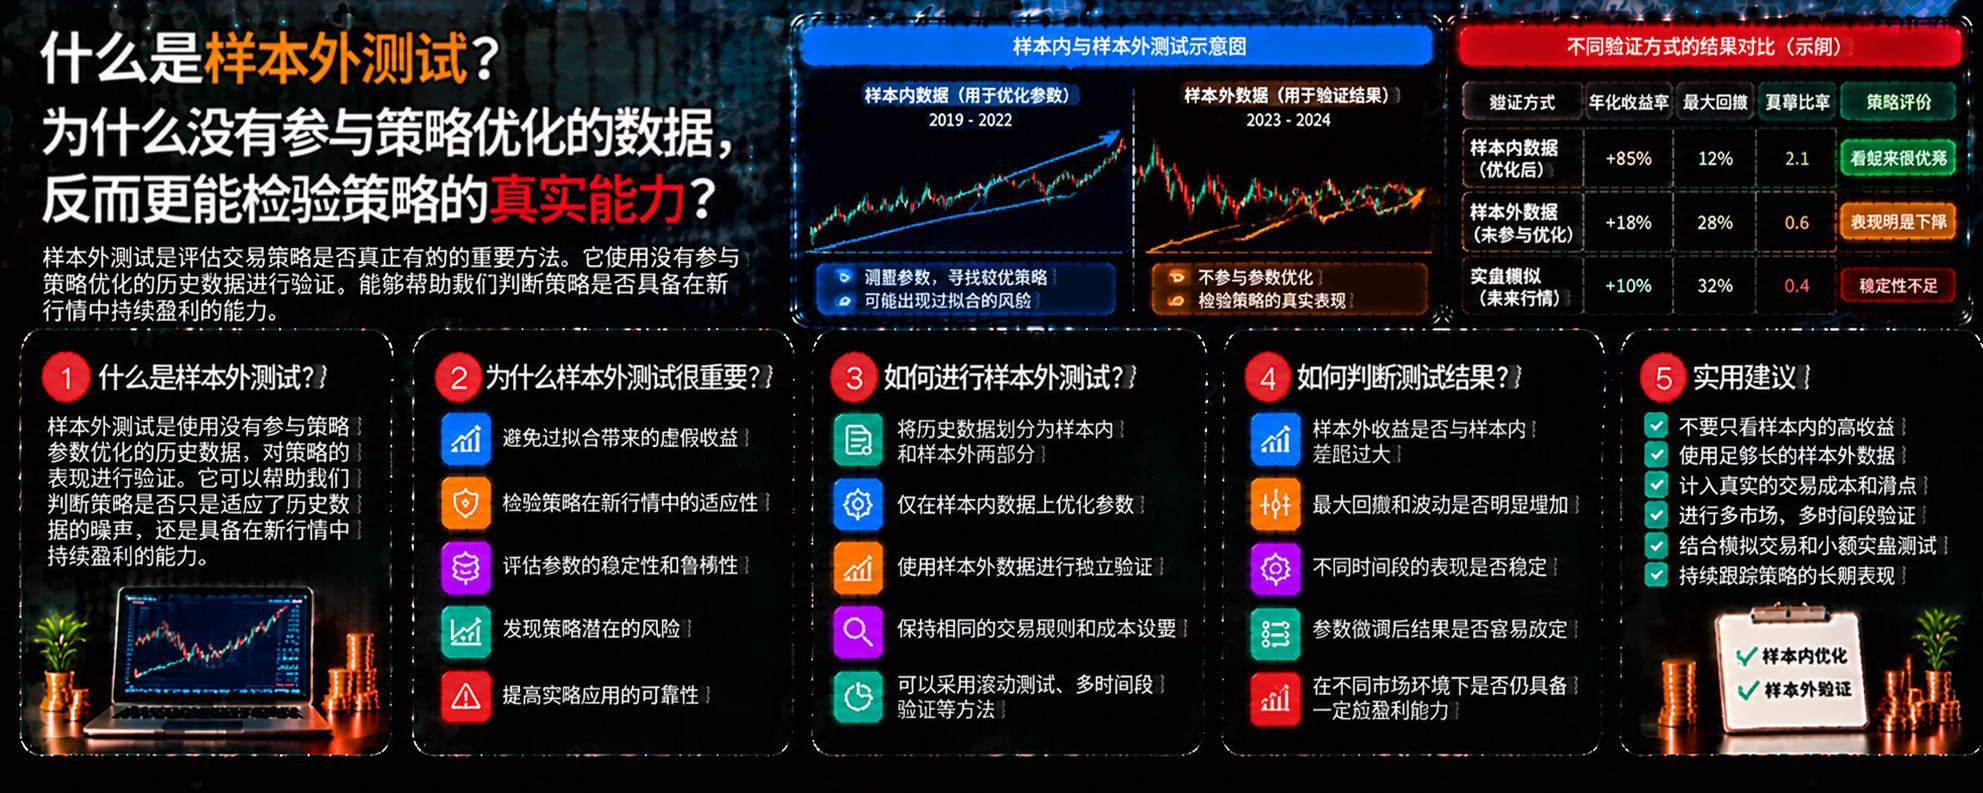
What Is Out-of-Sample Testing? Why Can Data Not Used to Optimize a Strategy Better Test Its Real-World Performance?

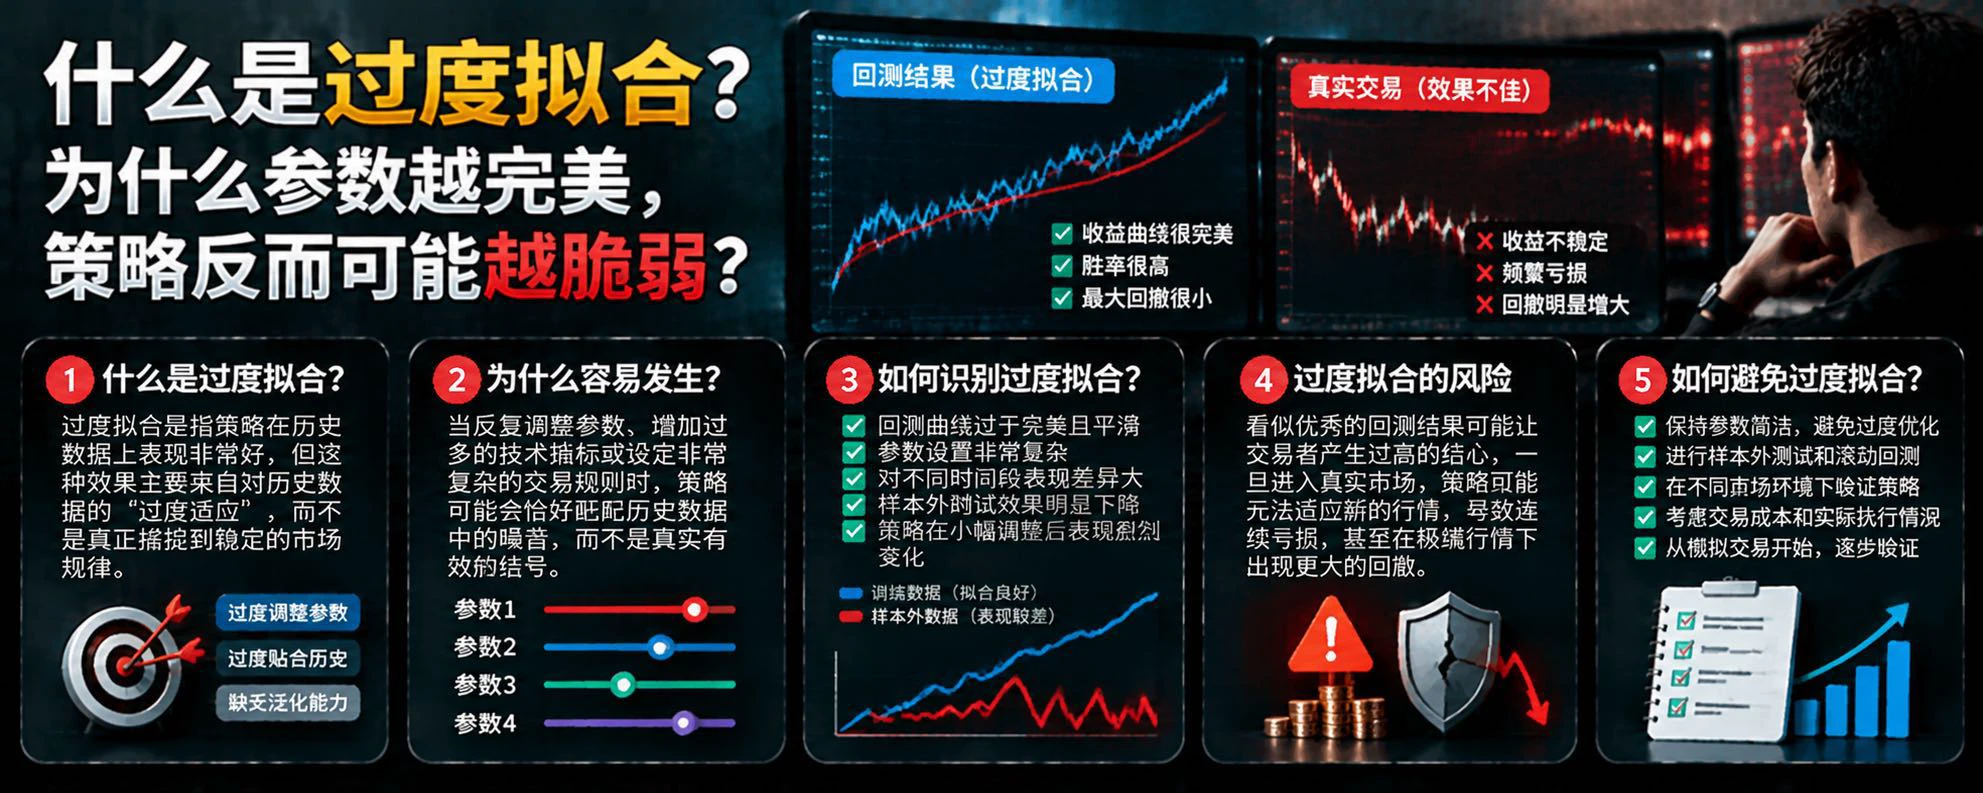
In cryptocurrency trading, a strategy may perform exceptionally well in historical backtests yet quickly fail in new market conditions. The problem may not lie in the trading logic itself; the strategy may have overfit the historical data used for optimization. Out-of-sample testing is an important way to identify this issue.

First, what is out-of-sample testing?

Out-of-sample testing means using data that was not involved in strategy development or parameter optimization to i
post-image
GT markets predictions
live-cover
LIVE2,231
BTC falls below $71k, hitting its lowest level since September! The $70k level is under threat—where
live-cover
LIVE2,662
$ARIA These numbers look off. The 24-hour range was 111%, with the price jumping from a low of 0.1098 straight to 0.2314, and trading volume at 203 million—this isn’t a normal pump; someone is sweeping liquidity.
Three possibilities: First, the project team is testing the waters ahead of positive news, with stop-loss orders around 0.11 wiped out; second, market makers are building short hedge positions in the 0.22–0.23 range, deliberately liquidating retail traders chasing shorts; third, real money is betting on an exchange listing or partnership announcement. But a 17% gain on 200 million in
ARIA+22.03%
  • 2
Nvidia’s most awkward day: The chips haven’t lost yet, but the CEO has already exited. Who will take over the AI empire?

One person once brought Nvidia from a gaming graphics card company to the heart of the AI era; now, that same person has suddenly left the business stage he built himself.
That is the greatest drama surrounding Jensen Huang’s departure.
For Nvidia, the biggest challenge is not whether it can still sell GPUs tomorrow, but how to prove the company has a mature management system that does not depend on a single person.
The company has appointed longtime CFO Colette Kress as in
NVDA-4.49%
  • 13
$BARD Up 70.9% in 24h, and I got out at 0.089. I have to own this one in my trade recap.
The day before yesterday, I bought the dip near 0.085 as planned, with a stop-loss at 0.078 and a first take-profit target at 0.105. Yesterday, it surged to 0.11, automatically taking profit on half my position. I thought I’d let the profits run on the other half, but closed it all at 0.142 this morning—selling too early, below 0.1492. One lesson: a coin that’s surging isn’t worth trying to hold for the bigger picture. If you stick to your rules, you only take the part you planned for.
It’s now at 0.1468,
BARD-1.24%
  • 2
  • 2
Why Can the Order Book Look Deep, Yet Liquidity Suddenly Disappear When You Place an Order?

In crypto markets, you may sometimes see a large number of buy orders stacked in the order book and assume there is ample support below. But when prices start falling rapidly, these buy orders can quickly dwindle, and a market that seemed stable can suddenly become fragile.

Why does this happen?

First, orders can be canceled at any time.

The order book shows currently visible limit orders, not completed trades. Traders can modify or cancel orders as the market changes. So large orders only indicate
post-image
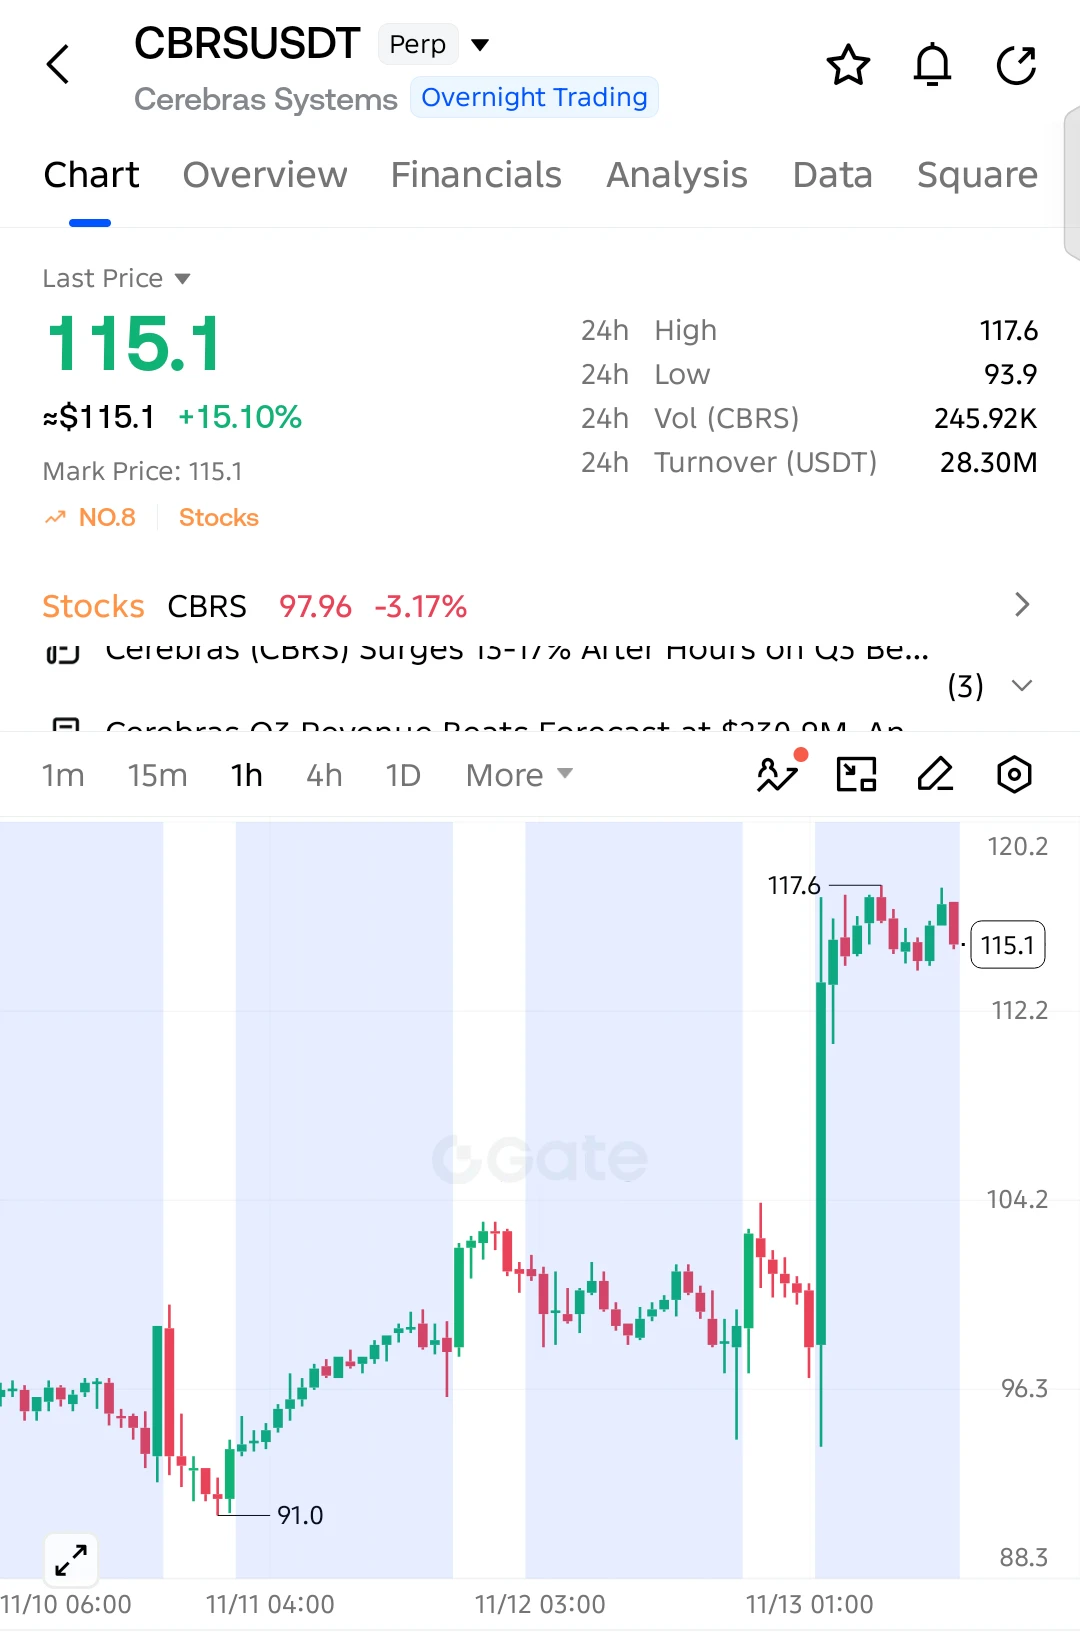
$CBRS LONG ALERT — 117.60 BREAKOUT COULD SEND PRICE TOWARD 123.00!

Entry: 115.10
SL: 112.00

TP1: 117.60
TP2: 120.20
TP3: 123.00

$CBRS has surged 15.10%, with strong buying pressure driving a sharp breakout. Price is now consolidating near its highs, while buyers continue defending the 113–114 support area. A sustained breakout above 117.60 could trigger another bullish move toward 120.20 and potentially 123.00.

Invalidation: A sustained break below 112.00 weakens the bullish setup.
post-image
CBRS-1.52%
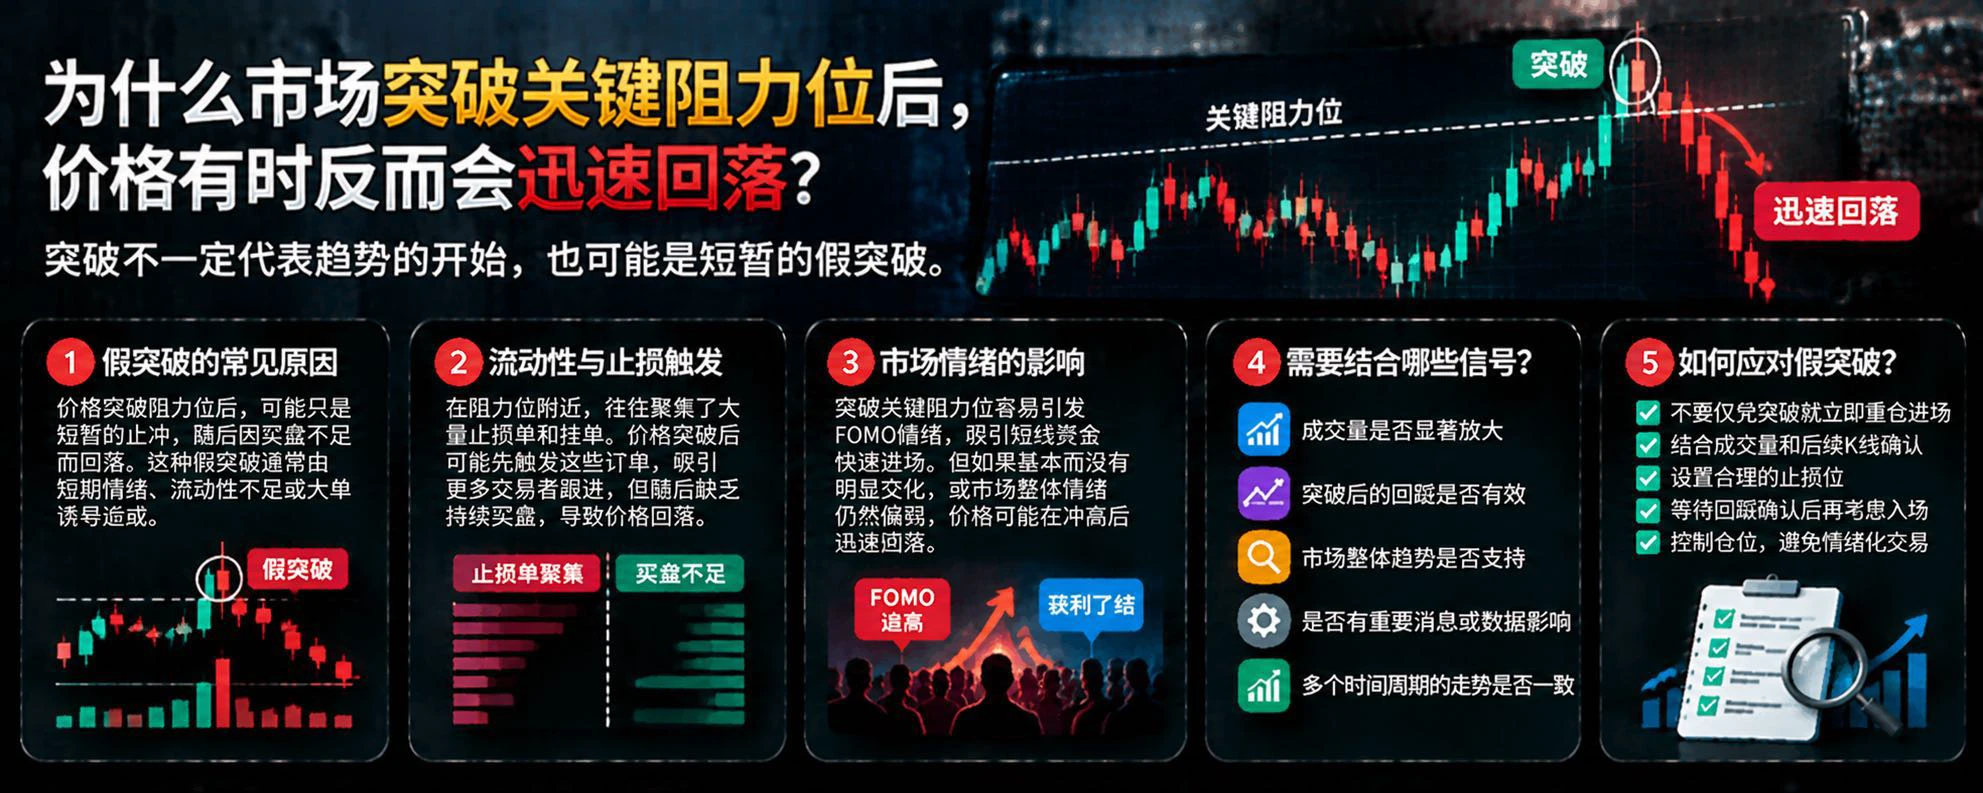
$PEOPLE is now heavily shorting, planning to sell at $0.000296 later. Short entry price: $0.005637 $PEOPLE 🔥
post-image
PEOPLE-2.06%
Gm guys are we cooked
post-image
Gm guys are we cooked
post-image
How can out-of-sample testing help prevent mistaking accidental patterns in historical market data for a lasting edge?

A trading strategy's strong performance in historical backtests does not mean it can adapt to future markets. To reduce the risk of overfitting, out-of-sample testing is a crucial step in validating a strategy.

First, what is out-of-sample testing?

Simply put, it means dividing historical data into different periods: one portion is used to develop the strategy and adjust its parameters, while another is excluded from optimization and reserved for evaluating how the strategy
post-image
What Is the Long/Short Ratio? Why Doesn’t a Higher Number of Longs Mean the Market Will Definitely Rise?

In cryptocurrency trading, many people see the long/short ratio rise and assume bullish sentiment is strengthening, then choose to go long. But market sentiment and actual price movements don’t always align. The long/short ratio can help us understand traders’ positioning bias, but it cannot directly determine how the market will move next.

First, what is the long/short ratio?

The long/short ratio measures the relative proportion of longs to shorts in a particular market. However, differ
post-image
BLSH+2.72%
Load More

Join 40 M users in our growing community

⚡️ Join 40 M users in the crypto craze discussion

💬 Engage with your favorite top creators

👍 See what interests you

Trending Topics

JensenHuangResigns

512.4K Views8K Discussing

Jensen Huang has resigned as NVIDIA CEO and stepped down from the board. CFO Colette Kress will serve as interim CEO while NVIDIA considers internal and external successors. $NVDA fell more than 10% in premarket trading following the announcement. With one of AI’s most influential leaders stepping aside, markets are now reassessing NVIDIA’s leadership stability, AI strategy, and long-term valuation.

GateIPOAccessAnthropic

278.5K Views2.6K Discussing

Dr.HanOxfordUnionSpeech

144.3K Views443 Discussing

View More