
Share your thoughts
placeholder
Article
$FET - bullish for the next day's$FET
post-image
FET+9.24%
$1000 to $100,000 Crypto Trade Challenge Today
live-cover
LIVE894
$GENIUS Current price is 0.3361, down 6.35% over 24h, with a trading volume of 26.1M USDT. The moving averages are bearishly aligned (MA5 0.33438 below MA20 0.34534), the MACD histogram remains negative at -0.001875, and RSI at 47.8 is neutral to weak; however, the funding rate remains positive at +0.0050%, indicating that longs are still paying to hold positions, while shorts have not gained an overwhelming advantage. The Fear and Greed Index is at 56, in the greed range, while the coin price is falling against the trend—a typical “sentiment holds while price gets sold first” structure. This
post-image
APT+19.18%
$btc you see it..
Mid range held..
Red line into Q4..
post-image
BTC+5.69%
Your Vice Is A Locked Room And Only I Have The Key (1972)
The markets are pumping anyway, so pump these too, boss.
$S $CHR $ARB $OP $Pyth
post-image
CHR+8.99%
ARB+21.69%
OP+13.60%
PYTH+6.55%
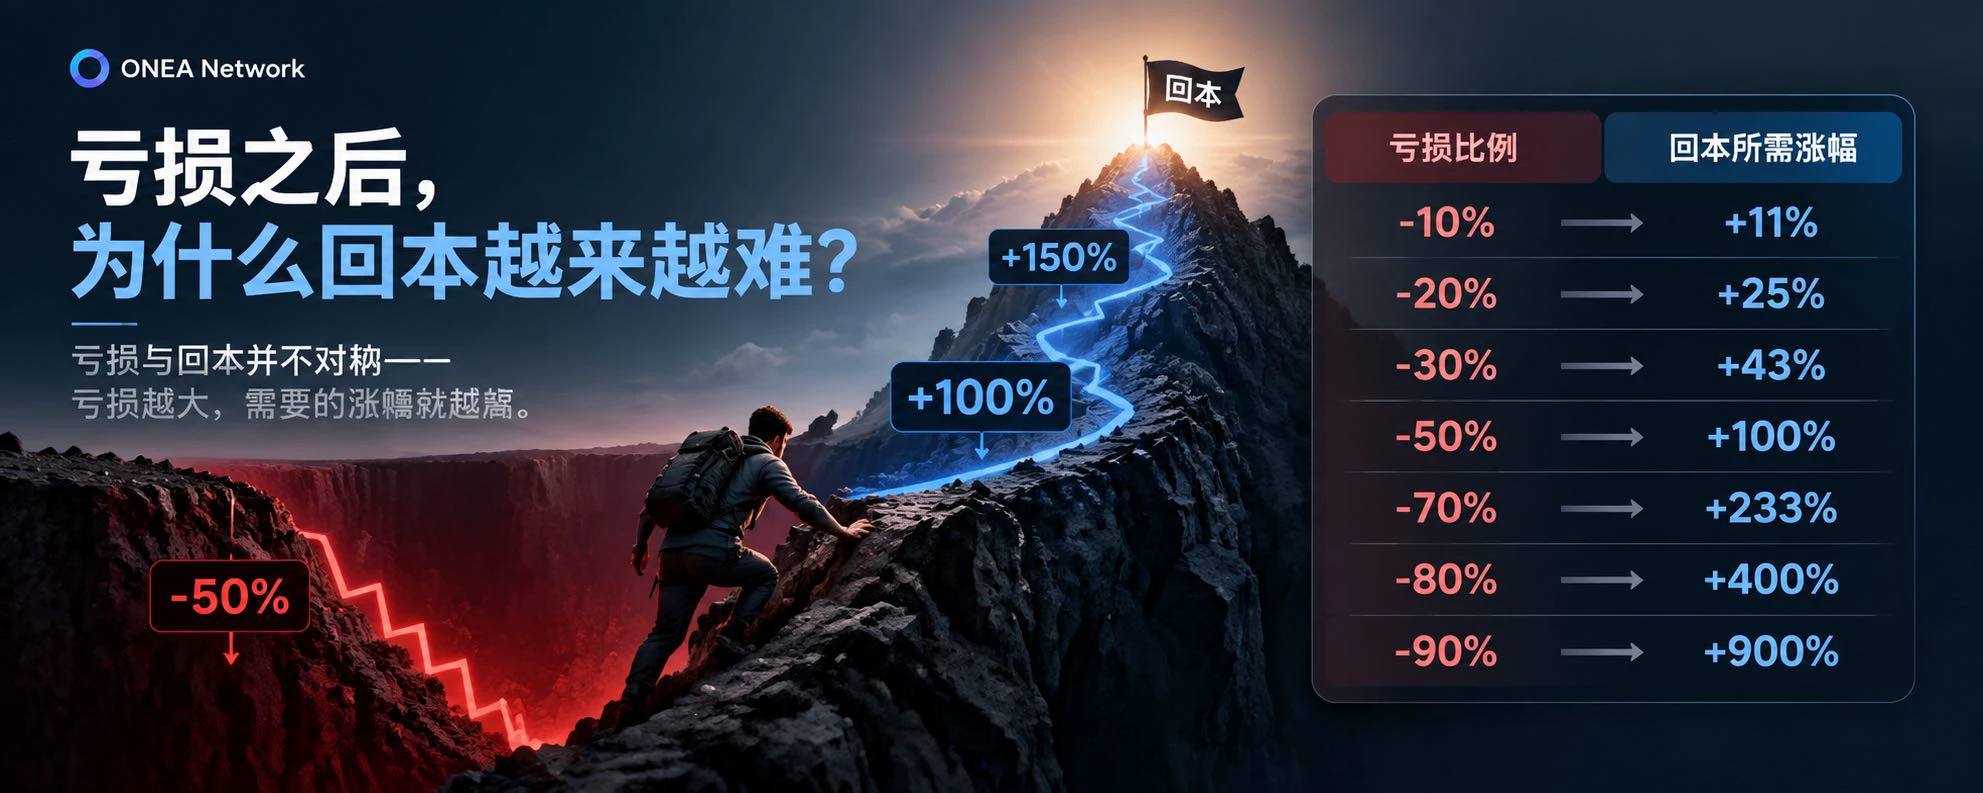
We took a loss, so we’ll own it; if we’re wrong, we’ll admit it. 🤨
#ZECKeepsRisingBreaking1500
Zcash (ZEC) has become one of the strongest stories in the crypto market, pushing through the highly watched $1,500 level and attracting renewed attention from traders, investors, and the broader privacy-focused blockchain community.
As of September 18, 2026, ZEC has traded around the $1,450–$1,480 area after reaching an intraday high above $1,530. Market data shows how quickly the move has developed: ZEC was around $1,110 on September 15, climbed above $1,330 on September 16, and then crossed $1,500 on September 17–18.
This is not simply a one-day move. Zcash has
ZEC+0.20%
🧠 THE TRADE WASN’T WRONG — FEAR MADE YOU LEAVE
Ever sold a trade because price dropped 2%… only to watch it bounce straight to your target?
It happens in real life too. Imagine buying something you believe is valuable for $100. The price drops to $90 and suddenly you panic. You sell at $90. The next day it goes back to $110.
The market didn’t suddenly become smarter. Your emotions changed the plan.
In trading, a small pullback can feel much bigger when real money is on the line. That’s why your entry, invalidation level and risk should be decided before fear takes over.
Moral:
Fear doesn’t al
post-image
BTC+5.69%
GT+6.08%
Guess what this means for your ripple:native
post-image
#日股地产电力半导体板块走强 #Gate广场中秋团圆局 Japan’s latest equity move looks broad from the index level, but the underlying data tells a much more concentrated story. The Nikkei 225 closed at 65,018.95, gaining 882.70 points or 1.38%, after reaching an intraday high of 65,436.57. That was the index’s third consecutive advance and its first close above 65,000 since September 10. Trading activity was also substantial, with approximately 2.86 billion shares changing hands and around ¥10.40 trillion in trading value on the Tokyo Stock Exchange Prime market.
But the headline Nikkei gain hides an important detail:
post-image
JPN225+0.10%
USDJPY+0.44%
#美股AI概念股全线反弹
🎁 Gate Mid-Autumn Festival is continuing with a massive 15,000 USDT reward pool, and Day 3 focuses on one of the hottest themes in global markets: US AI concept stocks.
September 17 delivered a strong recovery across Wall Street. The Nasdaq Composite jumped 1.69% to around 26,418, the S&P 500 gained 1.14% to around 7,638, and the Dow Jones Industrial Average rose 0.61% to around 51,778. The Nasdaq clearly led the major indexes, showing that risk appetite returned strongly toward technology and growth stocks.
What makes this rebound more interesting is the performance of AI-rela
I had already finished complaining to my friends about this week’s market, but now I have to take it all back. A bit awkward.
A few days ago in the afternoon, I saw $SKHYNIX hold after a pullback and buying pressure strengthen. I didn’t explain any complicated logic—just said that if you could go long, you should get in. Now it has moved from 1171.00 to 1337.18, with a return of +1007.66%. That was a satisfying bite—the action was truly sluggish at first, but once it broke out, it was truly delicious.
Take profit on 80% first, and protect the remaining 20% at the entry price. Don’t get greedy
post-image
SKHYNIX+2.58%
BNB+5.04%
ZEC+0.29%
zkSNARKs are gonna come straight out of the gate at a $5,000 fp, aren't they?
post-image
#美股AI概念股全线反弹 + #Gate广场中秋团圆局 US AI stocks are back in focus, but the real story is not simply that AI names turned green. The more important signal is where the money moved, how much volume followed the move, and whether prices actually reclaimed important technical zones. The Nasdaq jumped 1.69%, the S&P 500 gained 1.14%, and the Dow added 0.61%, creating a broad risk-on backdrop for technology and growth stocks.
① TEM — Healthcare AI takes the lead. Tempus AI ($TEM) delivered the strongest move among the highlighted names, closing at $80.36, up 14.85%, after trading as high as $81.28. Around
post-image
TEM-3.64%
SMCI-3.82%
ALAB+1.14%
ARM+1.41%
$RAY Conclusion first: Short-term longs have the edge, but the upside has entered a high-wick zone, making the risk of chasing highs greater than buying on a pullback.
From a funding perspective, $RAY 's funding rate is +0.0000%. Longs are not paying a premium, indicating that this 24h +18.80% rally was not driven by piled-up leveraged longs. Shorts have also not become crowded, making this a spot-driven rise with a solid support base still in place after a pullback. MA5=1.70278 has crossed above MA20=1.67108, confirming a bullish alignment. RSI=66.7 is strong but has not entered the overbough
post-image
RAY+16.93%
LSK+1.52%
Nobody is talking about this SYMBOL setup hiding in plain sight.

$SAMSUNG /USDT - SHORT

Trade Plan:
Entry: 187.2 – 187.8
SL: 190.4
TP1: 185.3
TP2: 183.9
TP3: 181.7

Why this setup?
Why now? The 4h structure and the daily range are setting up for a move that the 1h ATR of 1.214068 confirms is live. The 15m RSI at 59.7 shows room to run before overbought, and the entry zone at 187.5 lines up perfectly with the current 1h price. We are targeting TP1 at 185.3 and TP2 at 183.9, with the daily trend acting as the fuel. The invalidation level is 190.1, and that is the line in the sand that prote
SAMSUNG-1.41%
$HYPE HYPE 1D – Our Setup Delivers as Price Nears Final Target
Hyperliquid is trading around 91.509 on the daily timeframe, extending the breakout our setup flagged off the demand zone near 50 to 55, with price now closing in on the psychological 90 to 91 target zone we projected.
The structure here traces back to the long term ascending trendline from the February low, which caught up with price in early August right as a tight demand zone formed between 50 and 57. That confluence of trendline support and horizontal demand was exactly the setup we called, and price respected it precisely befo
post-image
HYPE+11.18%
Load More

Join 40 M users in our growing community

⚡️ Join 40 M users in the crypto craze discussion

💬 Engage with your favorite top creators

👍 See what interests you

Trending Topics

JapanRealEstatePowerChipStocksRise

58.56k Views3.54k Discussing

Japan's Nikkei extended gains on Sept 18, with real estate, power, and semiconductor sectors leading. Gate covers over 12,800 global stocks and ETFs, offering one-stop USDT trading across US, HK, Korean, and Japanese markets. [👉 Read more](https://www.odaily.news/en/newsflash/518749)

USAIConceptStocksRally

33.39k Views483 Discussing

GateTopsStockPerpetualCoverage

37.54k Views2.31k Discussing

View More