Share crypto content and earn up to 60% commissions through content mining.
placeholder
gatefun
world cup prediction
gate liveLIVE
2,041
  • Reward
  • Comment
  • Repost
  • Share
Family, who would understand this! A few days ago it was still grinding, and today it straight-up gave the answer 📉🔥—this chart is a classic case of stubbornly propping up at high levels; the longer it holds, the weaker it gets. This morning I opened the chart and that short-position profit is just so satisfying.
A few days ago, in the early morning, I was watching $CYS . I saw the overhead suppression that just wouldn’t break through, and the rebounds had no volume—every time it surged, it was one breath short 👀. I already reminded everyone then: don’t chase longs; going long or short is sm
CYS5.28%
BTC2.94%
ETH1.92%
View Original
post-image
  • Reward
  • Comment
  • Repost
  • Share
A few days ago it was still grinding, today it gives the answer directly! 📢🚀 Seriously, $WLFI this long position was really torturous earlier, but as long as you weren't shaken out, the result is very comfortable.
A few days ago, in the early morning, before the market had fully started, I was watching the bottom consolidation and key levels not breaking 📌 Selling pressure was clearly lighter, and there were always buyers below, so at that time I suggested going long, with a reference entry price of 0.05844.
Now the current price has reached 0.05874, with a return of +36.45%. This profit c
WLFI0.20%
BTC2.94%
ETH1.92%
View Original
post-image
  • Reward
  • Comment
  • Repost
  • Share
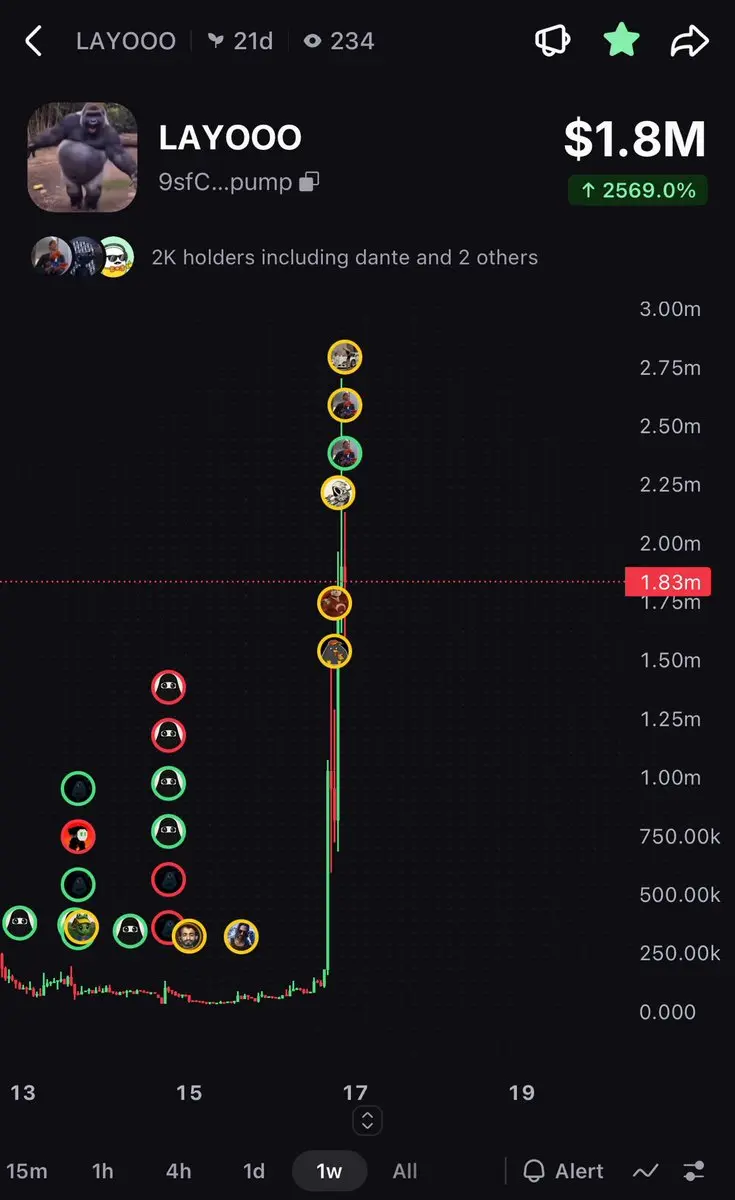
$ansem wicked to $200 million mc
Better get out before it goes to $180 million mc
#crypto #altcoins $sol
SOL1.93%
post-image
  • Reward
  • Comment
  • Repost
  • Share
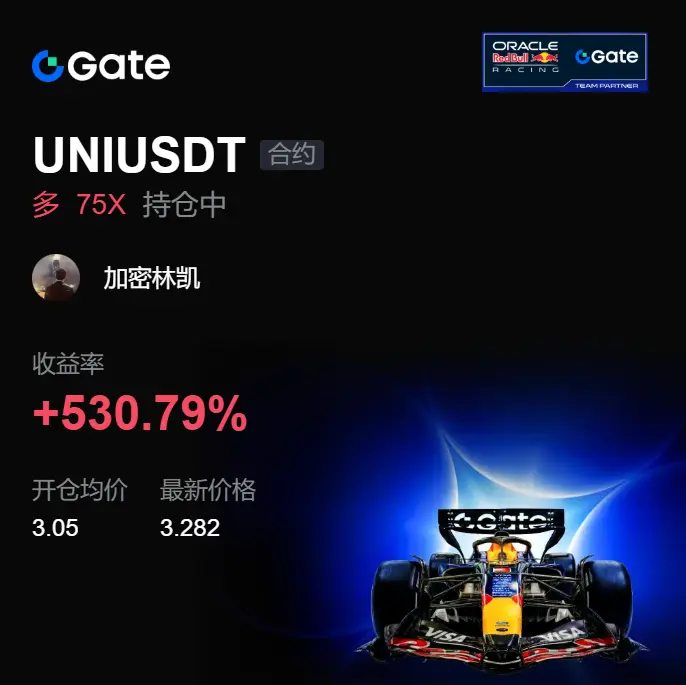
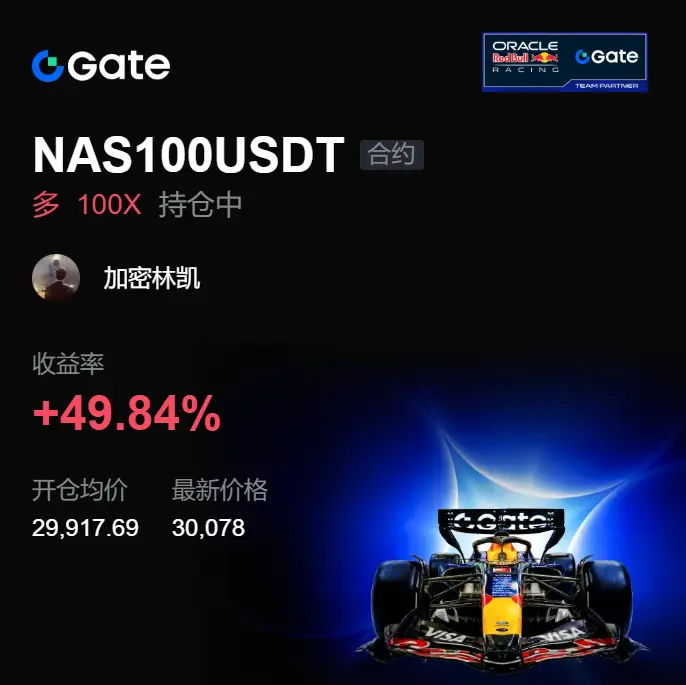
Many people were still hesitating just now, but $UNI has already pointed the direction. My long position from 3.050 to 3.423 is now up +868.36%. This is a call that played out—not chasing the candlestick chart.
I had already been watching this area beforehand. The key wasn’t how much it would rise, but that it couldn’t drop. During that sideways range, the sell orders looked aggressive, yet the price couldn’t be pushed through; instead, every pullback got met by incoming funds. In plain terms, the rhythm has changed—bears want to press down, but the order book doesn’t cooperate.
What feels tru
UNI5.84%
BTC2.94%
ETH1.92%
View Original
post-image
  • Reward
  • Comment
  • Repost
  • Share
Just a few days ago it was still grinding, and today it directly gives the answer! 🚀 The last glance before bed I was still watching $BTC , the price didn't move much, but the feeling of "can't fall anymore" on the chart was already obvious.
At that time I was watching for a pullback to hold steady, key level not broken, selling pressure lighter wave by wave 📌 While everyone was still hesitating, I suggested going long. This kind of position is not about impulsiveness, but patience.
Now from 58598.1 to 63149.9, +1346.11% realized directly 🎉📈 Got the meat that should be taken, rhythm not dis
BTC2.94%
ETH1.92%
SOL1.73%
View Original
post-image
  • Reward
  • Comment
  • Repost
  • Share
Woke up and instantly felt re-energized! 📉😎 A few days ago, the afternoon market was still pretending to be strong—when it pulled up, there was no volume. Every attempt to push higher lacked that one last push. At the time, I said don’t get carried away with this level—the “induce-long” setup had a bit too much of that bait. $PLAY At that moment, around 0.12183, I opened a long; I wasn’t watching for excitement—I was watching for insufficient follow-through and clearly visible selling pressure overhead. 👀 As it turned out, when I opened the market this morning, the current price was 0.0340
PLAY4.60%
BTC2.94%
ETH1.92%
View Original
post-image
  • Reward
  • Comment
  • Repost
  • Share
A Brief Analysis of BTC Short-Term Trends from Dow Theory, Chan Theory, Elliott Wave Theory, Volume-Price Analysis, Order Flow, and Price Action
$BTC
‌I. Dow Theory
Major Trend (1-hour level): The major downtrend from the May 6 historical high of 82,814 saw a significant turning point on July 1. The price plunged from 82,814 through the June 1 secondary high of 73,974 all the way to the July 1 low of 57,721, with a cumulative decline of 25,093. After hitting bottom on July 1, bulls launched a strong counterattack, rebounding to 64,597 on July 6, but the price fell back to 61,470 on July 7–8,
BTC2.94%
View Original
post-image
post-image
  • Reward
  • Comment
  • Repost
  • Share
$BTC Signal: Bullish pullback to the middle Bollinger Band, 1H rebound momentum building
$BTC RSI 1H at 56.58, 4H MACD histogram at 13.43 but shrinking. The 4H middle Bollinger Band at 62,937 becomes the short-term bull-bear divide. Sell-side pressure is heavier, with a Bid/Ask depth ratio of 0.33, meaning passive buying.
Funding rate at 0.0092% (normal), OI stable, no significant short accumulation. Current price 63,106 is near the 1H middle Bollinger Band, with support at the lower band 62,533.
🎯Direction: Long
⚡Entry/Limit order: 63,000 (recommended mid-range)
🛑Stop loss: 62,474.94
🚀Targ
BTC2.94%
GUSD0.11%
ETH2.00%
SOL1.93%
View Original
post-image
  • Reward
  • Comment
  • Repost
  • Share
Fed meeting minutes issue warning! Inflation and AI investment emerge as new variables—could the rat
gate liveLIVE
2,311
live-coin
  • Reward
  • Comment
  • Repost
  • Share
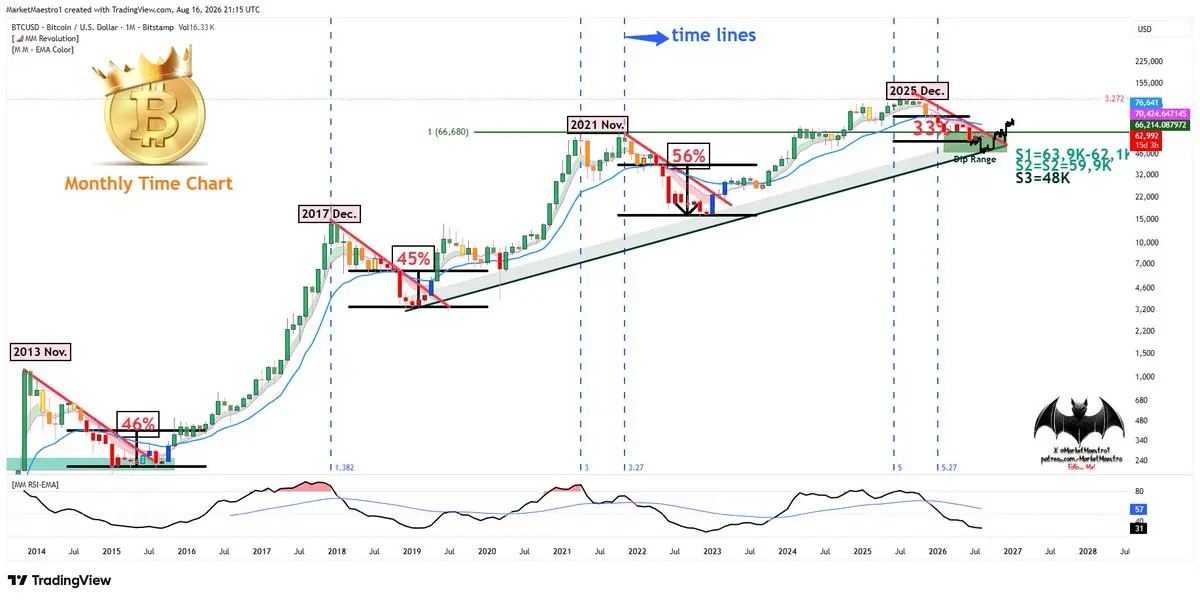
📈 Bitcoin Rebounds Well At The Trendline, But The Line Still Holds
The bulls are pushing back. After days pinned under the descending trendline, Bitcoin bounced hard off support and climbed to $63,252, up 1.6% on the day. The recovery is real, but price is now pressing right into that same diagonal from below, and it hasn't broken through yet.
📈 Where it stands:
Price: ~$63,252 (up 1.6%)
Rebounded from: the $60K to $62K support zone
Pressing into: the descending trendline and 20-day EMA
Fear and Greed: 22, still extreme fear
On the 1D, the read is a genuine recovery meeting a genuine ceiling
BTC3.00%
post-image
  • Reward
  • Comment
  • Repost
  • Share
This wave of $SOL long positions, to be honest, went more cleanly than I expected. I started watching from around 74.15, and by the time it reached 78.35, my account showed +528.15%. It's not because I'm some genius—this time I didn't get shaken out by intraday fluctuations.
Earlier, I had already noticed this level. Several pullbacks failed to break through, and instead, lower-level buying support grew stronger. A lot of people were rushing to short at that point. The key thing is, the less people believe in a rebound, the easier it is for the market to quietly shift pace.
The real change cam
SOL1.73%
BTC2.94%
ETH1.92%
View Original
post-image
  • Reward
  • Comment
  • Repost
  • Share
$PI Bros, I can't hold anymore, bought at 20 now at 0.6.
PI-2.89%
View Original
post-image
  • Reward
  • Comment
  • Repost
  • Share
Chan Theory Analysis of Overall Market Trend Structure
View Original
  • Reward
  • Comment
  • Repost
  • Share
BREAKING: KOSPI pops ~4.5% intraday as Samsung Electronics rallies over 5%, with SK Hynix also higher. This standout domestic risk-on move could tilt broader risk appetite for tech names in Asia. $KRW, $Samsung Electronics, $SK Hynix
post-image
  • Reward
  • Comment
  • Repost
  • Share
Seriously—this wave really gave face! 🚀 The last look before bed was still grinding; in the morning, when I opened the chart, it was already accelerating. $ETH After that retrace and hold a few days ago in the early hours, you could clearly feel the funds quietly moving in. 👀
Back when I entered at 1570.09, now it’s at 1740.41, with returns showing +1889.56%📈🎉 The feedback that was supposed to come has already come. Nail the timing, and it’s just different.
When it’s time to take profit, take profit.
Don’t get sentimental about profits.
Over here, first take profit on 80% and tuck it into
ETH1.92%
BTC2.94%
SOL1.73%
View Original
post-image
  • Reward
  • Comment
  • Repost
  • Share
MINIMAX CEO to forgo salary until AGI, allocating 4% of his personal shares for team incentives and 1% to an open-source fund. Could signal long-term conviction and potential alignment with developers, $MINI?
post-image
  • Reward
  • Comment
  • Repost
  • Share
Can you believe it, folks! This drop really woke me up📉🔥 A few days ago, before bed, the market was still grinding at highs. Many thought it could still push higher, but I kept watching the overhead resistance without letting up. Volume wasn't following, no buyers stepping up, and the feeling was already off.

At the time, I already warned not to chase $FET — the bounce was weak, so it's better to look for longs, with entry reference near 0.2530. The core was to wait for it to show its weakness.👀🎯

Then I opened the market in the morning and got the answer directly! Now it's at 0.159, wi
FET2.34%
BTC2.94%
ETH1.92%
View Original
post-image
  • Reward
  • Comment
  • Repost
  • Share
Good Morning, everyone 🌅
Comment “GM”
Who’s ready to make today count?
post-image
  • Reward
  • Comment
  • Repost
  • Share
SLX 4-hour bottom signal— is the whale about to pump?
$SLX /USDT - LONG
Trading Plan:
Entry: 0.15964 – 0.16265
SL: 0.14237
TP1: 0.17524
TP2: 0.18463
TP3: 0.19871
Why focus on this structure?
- RSI on the 15-minute chart is only 37—an oversold bounce is imminent
- 4-hour EMA bullish alignment; trend support at 0.16115
- Target TP1: 0.17524, with a risk-reward ratio of over 2:1
- Why now? The daily range is at its end; the LONG signal scores 77—waiting for breakout confirmation
Discussion:
Will this move first hit TP2 at 0.18463, or will it lure buyers and dump back to 0.15?
SLX-11.41%
View Original
post-image
post-image
  • Reward
  • Comment
  • Repost
  • Share
Load More

Join 40 M users in our growing community

⚡️ Join 40 M users in the crypto craze discussion
💬 Engage with your favorite top creators
👍 See what interests you
  • Pinned