Square
Following
Hot
News
Profile
Share your thoughts
placeholder
Article
$ULTIMA ‌
What is ULTIMA? Behind the Scenes of the Ecosystem
In the crypto world, the story behind a project often fades into the background while the focus remains solely on the coin's price. ULTIMA is precisely such a project: launched in March 2023, this token serves as the infrastructure asset for an ecosystem that encompasses its own Layer-1 chain (SMART Blockchain, utilizing a DPoS consensus mechanism), the SMART Wallet, a crypto card, and a marketplace. The project reports a presence in 120 countries and a community exceeding 2.8 million members. What caught my attention is their appro
ULTIMA+1.67%
  • 12
  • 3
$HYPE Bulls Gaining Momentum?
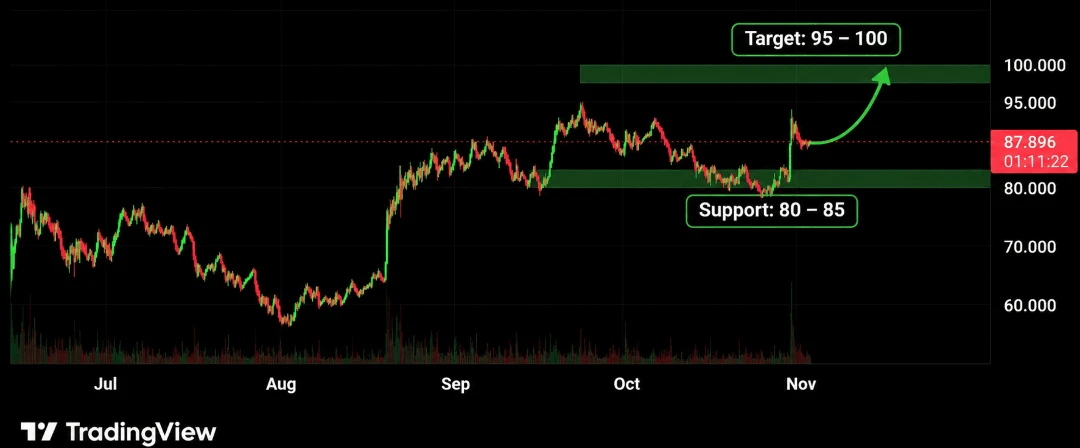
$HYPE is showing renewed strength after defending the $80–$85 support zone.
The recent bounce suggests buyers are stepping back in, but the next move needs confirmation.
Key Levels to Watch:
Support: $80–$85
Resistance: $95–$100
Bullish Scenario: A strong breakout above $100 could open the door for further upside.
My View: I'm cautiously bullish as long as HYPE holds its support zone. A clean breakout with strong volume would make this setup more convincing.
Watching closely for the next move.
$HYPE ‌#BTC大跌 #IntelBeatsEarningsButStockPlunges
post-image
HYPE+0.24%
HYPE+0.33%
Trenches
ZIG
Z
bade
b
ZIG
0x8c...1145
Market Cap
$.
Change
.
24h Vol
$.
Holders
.
KIM
K
bade
b
KIM
8pjf...pump
Market Cap
$.
Change
.
24h Vol
$.
Holders
.
Anakin
A
bade
b
Anakin
Exxz...pump
Market Cap
$.
Change
.
24h Vol
$.
Holders
.
BTC
B
bade
b
BTC
C5xp...pump
Market Cap
$.
Change
.
24h Vol
$.
Holders
.
IDOL
I
bade
b
IDOL
0x3b...ab07
Market Cap
$.
Change
.
24h Vol
$.
Holders
.
Long $DOGE $DOGE: 4-hour support is at 0.0757. Buyers need to hold this level. This is my key level. If it holds, price could rise to 0.0760–0.0764. A break below 0.0752 invalidates this view. - BTC’s short-term trend is bullish, providing a tailwind for this long position. - The 1-hour RSI is 50, indicating neutral momentum with no overextension. - The stop-loss distance is 0.63%, and TP3 is 1.0%, giving a risk-reward ratio of about 1.6R if the trade plays out. 🟢 Long entry: 0.07563–0.07571 Take profit: 0.07596 / 0.07615 / 0.07643 Stop loss: 0.07519 Not investment advice. Trade at your own ri
post-image
DOGE-0.22%
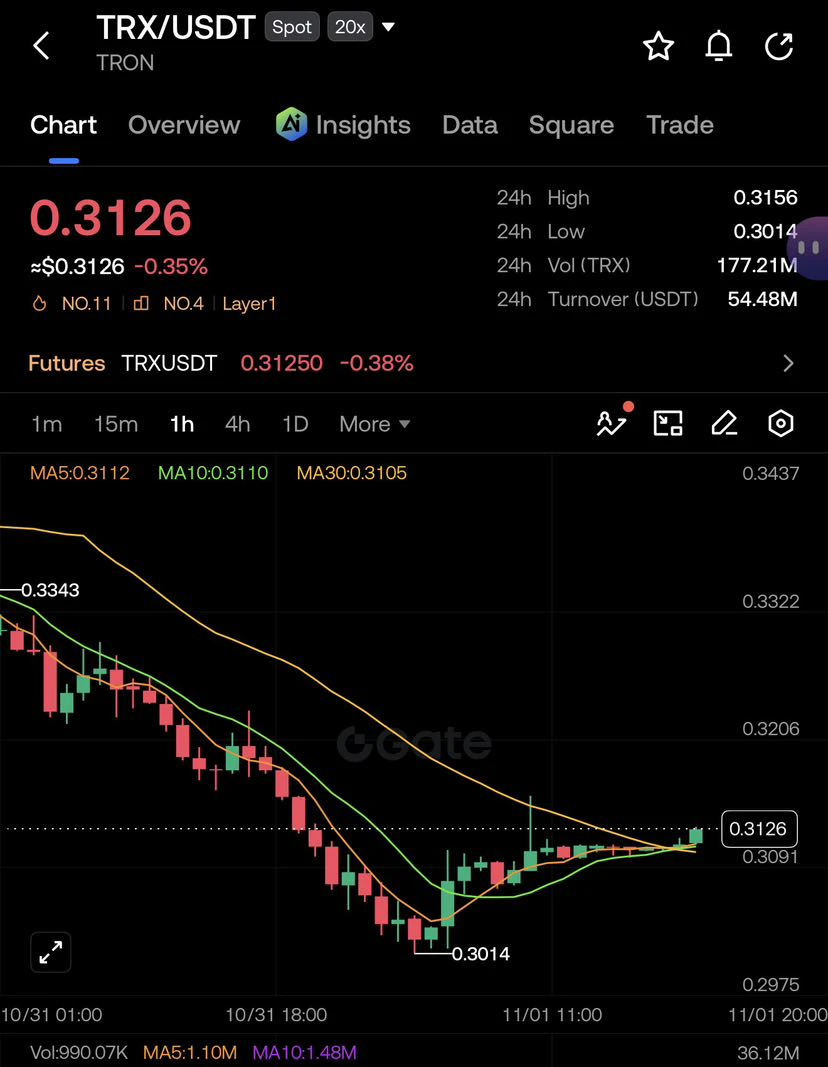
$TRX is trading at $0.3126!
TRX continues to attract market attention as traders monitor its price action. Holding key support levels could help maintain bullish momentum, while the next breakout will be crucial to watch.
post-image
TRX+0.42%
  • 8
Why build ePlayer?
When watching video tutorials, I tried a bunch of players but wasn't really satisfied with any of them. nPlayer came closest, but two things kept bothering me:
1) Fixed playback speed. Tutorials can be dull, so I usually watch at 1.5x speed. Many players only apply the setting to the current video, so I have to set it again for the next episode. It's so annoying.
2) Sleep timer. Sometimes I listen to tutorials in the background while falling asleep. YouTube's sleep timer works pretty well, but many local players don't have one at all.
So I built ePlayer myself. It works even
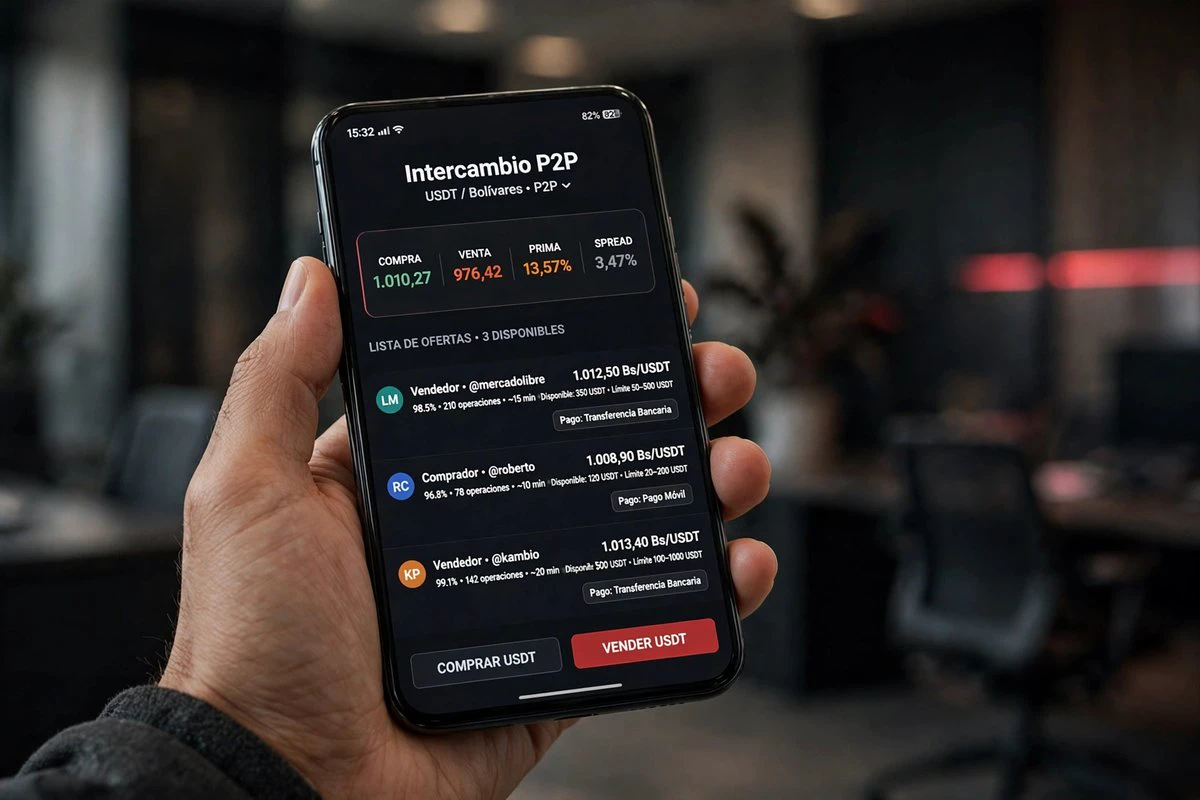
📊 The USDT P2P order book has two prices, not one. Confusing them costs money.
A guide using figures from November 1, 2026: the book shows a best ask of Bs. 991.80 and a best bid of Bs. 990.10. Mid-price: Bs. 990.95. Bid-ask spread: just Bs. 1.70, or 0.17%.
The Radar headline, by contrast, summarizes aggregated references: a buy price of Bs. 1,010.27 and a sell price of Bs. 976.42, with a spread of Bs. 33.85 (3.47%). Both figures are real, but they measure different things: one is what you can execute right now at the best price; the other is a broad market reference.
The official BCV rate: B
post-image
#ShareWeekly #INTC #WCTCS9
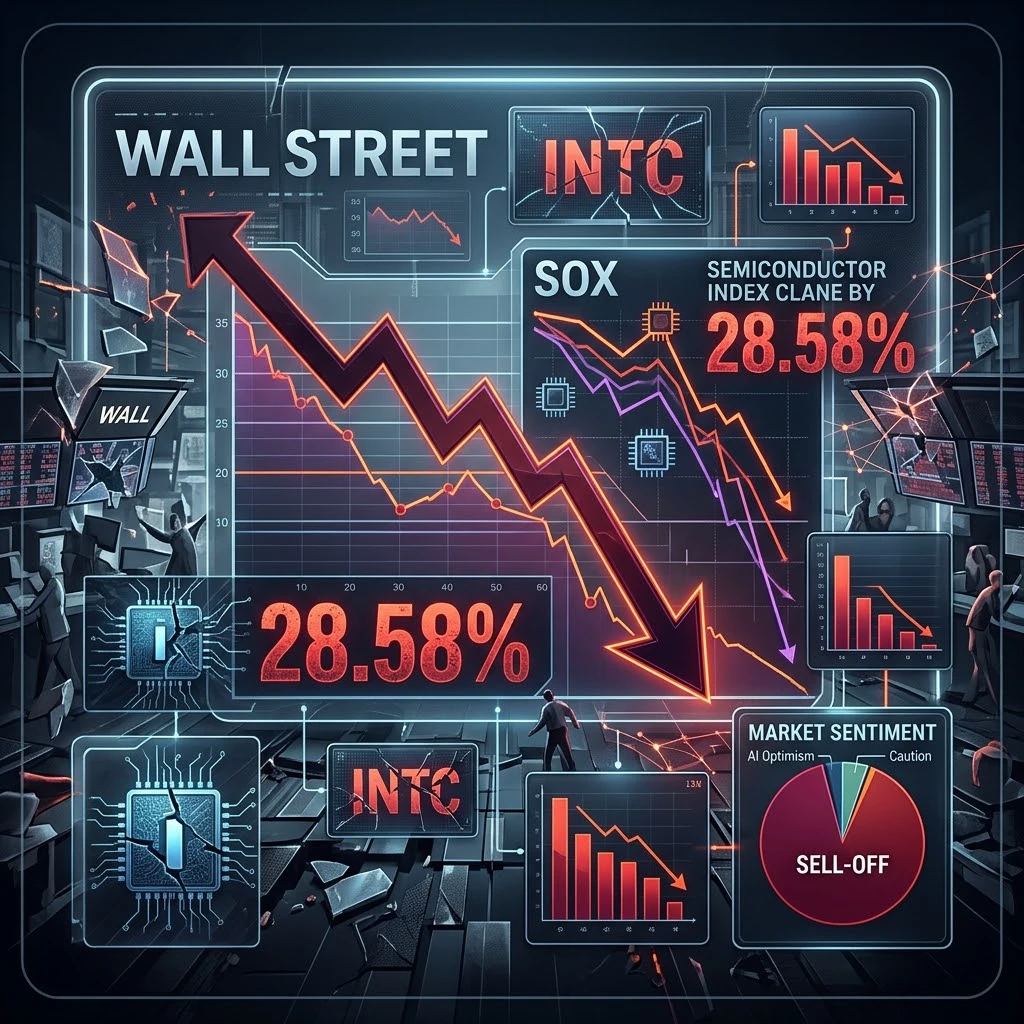
Wall Street Faces a Major Sell-Off: Semiconductor Index Drops More Than 7% as Intel Shares Crash 28.58%
The U.S. stock market ended Friday under significant selling pressure, with major American stock indices closing lower and semiconductor stocks experiencing an especially painful decline. The biggest shock came from Intel, whose shares plunged 28.58%, while the PHLX Semiconductor Sector Index (SOX) dropped more than 7%.
This was not simply another ordinary red trading session. The scale of the semiconductor sell-off highlighted growing uncertainty surrounding tech
post-image
INTC-28.49%
SPX500+0.19%
US30+0.38%
new streamer for market updates
live-cover
LIVE1,260
Reposting last night's Halloween cake 🎃
Looks absolutely stunning. Thanks to the gorgeous and generous Ms. Xiaoyu @viaoyu8888
@fourdotmemezh @Four_FORM_
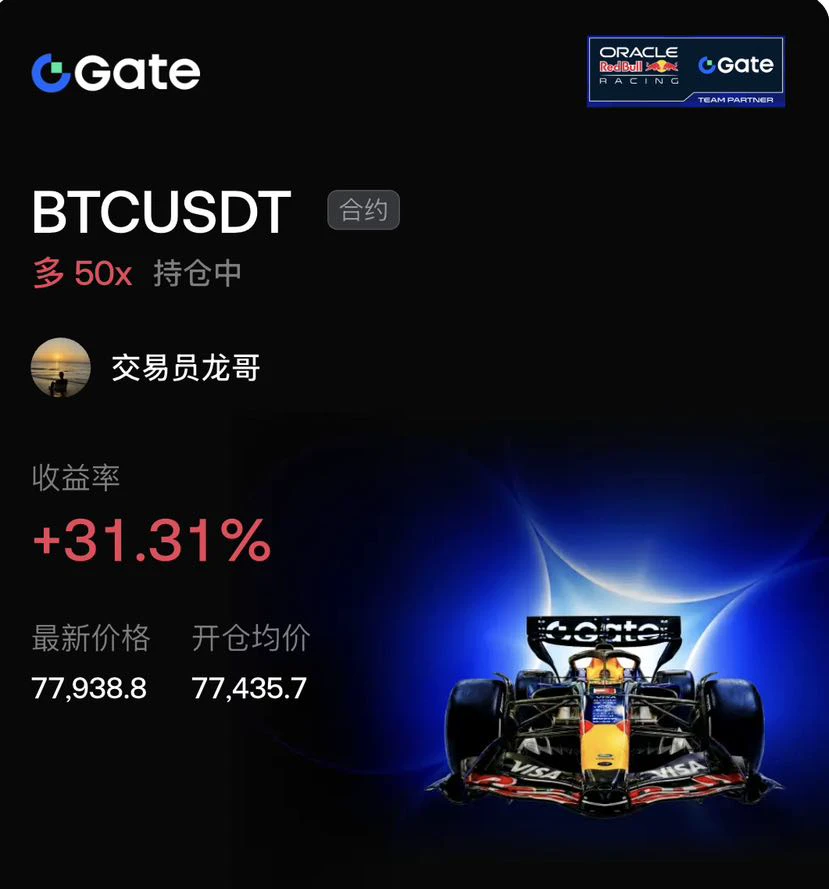
Mission confirmed. Gate platform $BTC 50x long position return: +31.31%. Lying low at 77,435.7; at the current price of 77,938.8, the target has been cleared. Destroy the communicator as soon as the trade is placed, and let the dark web keep me silent.
The market is crisscrossed with bullish intelligence networks, as buyers pour in like operatives lying in wait. As long as the 77,500 safehouse holds, any rescue by the bears is a trap.
Outlook: 79,000 is the extraction point. If the pullback holds above 77,500, keep lying low; if 77,435.7 is exposed, retreat immediately and cut losses. Withdra
post-image
BTC-0.65%
ETH-1.23%
GT-2.24%
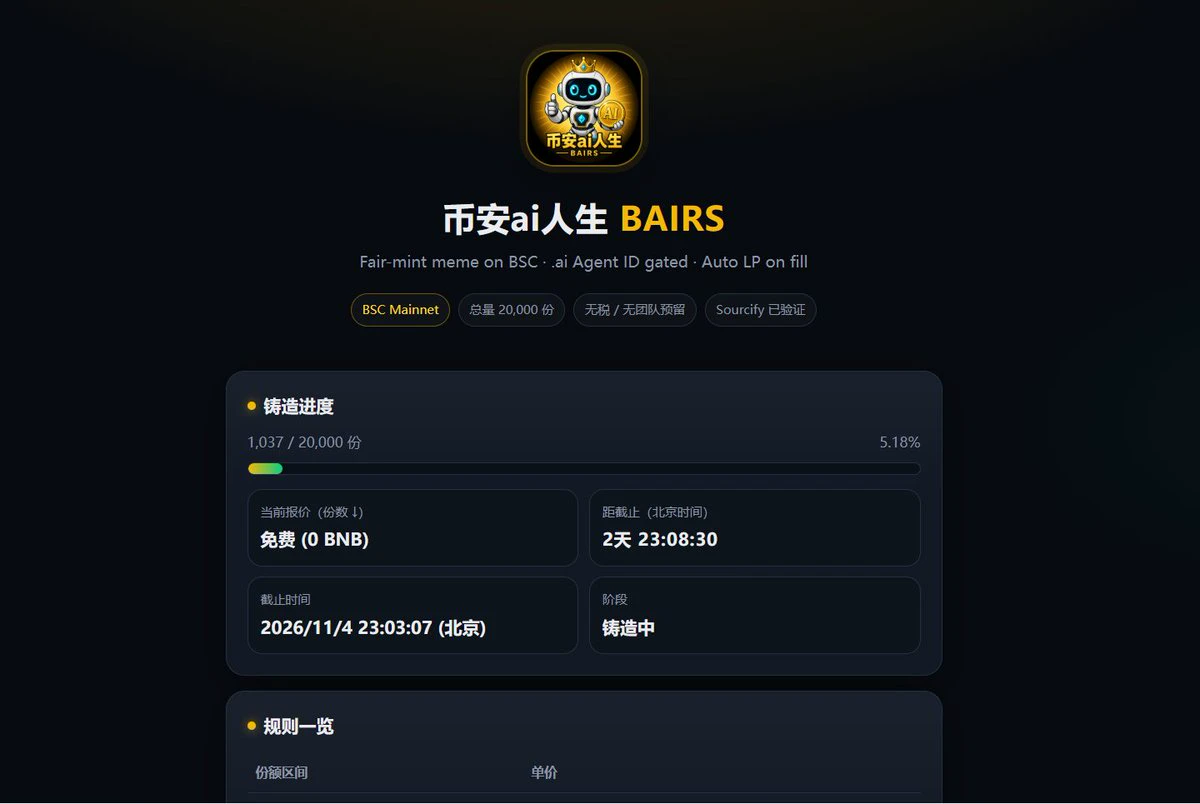
Free mint—hurry!!! Just minted a free BAIRS
The first 2,000 are free. Each ID can mint 1 for free, with a maximum of 10
Up to 10 per ID, 20,000 total
Once fully minted, LP will be added automatically + tokens burned
post-image
#StrategySTRCNears100ParValue
Strategy STRC Nears 100 Par Value - Why 100 Matters For Next BTC Buy
STRC, the variable rate Series A perpetual preferred of Strategy, trades at 99.92, 99.88, 99.95 in recent prints, just 5 to 8 cents below its 100 par. High mark is 99.36, best in about five months and first time near 100 in over 165 days. Low in June was 71.25. Quarterly gain is about 14% from late July low.
This 100 line is not cosmetic. Company policy bars new STRC issue below par. When price holds below 100, firm buys back. When price holds at or above 100, firm can sell new shares via at the
STRC-0.90%
BTC-0.67%
MSTR-7.78%
  • 13
  • 1
Tesla Holds Near $400: Can TSLA Break Above $410 and Continue Its Rally? 🚗
Tesla is approaching another important moment as its recent recovery faces a fresh test around the $400 level. On the 2-hour TradingView chart, TSLA is trading around $399.82, down approximately 0.87% at the time of the screenshot. Despite the latest pullback, the broader recovery from its July lows remains noticeable, leaving investors watching whether buyers can maintain momentum or whether sellers are preparing another correction.
Looking at the bigger picture, Tesla experienced a significant decline toward the $297
FARTSLA
FARTSLAFartsla
Pump.Fun
MC:$3.03KHolders:1
8.35%
TSLA-0.85%
  • 3
$BTC Drops Below $80K to $77,462.2: Buying Opportunity or Start of Deeper Correction?
Bitcoin has officially lost the $80K psychological level. Right now $BTC is trading at $77,462.2, down -3.27% on the day after hitting a 24h High of $81,965.5 and flushing to a 24h Low of $76,495.4. In the last 15 minutes alone it printed -0.46%. Perp is trading at $77,439.2 (-3.28%) with 19.82K BTC volume and $1.56B turnover - this is not a quiet drop, this is active selling.
The 1h chart I am watching tells the real story:
MA5: 77,661.8 / MA10: 78,012.8 / MA30: 79,140.5
We are trading BELOW all three moving
BTC-0.67%
  • 11
  • 3
Immediately open a sell (short) trade on $ESPORTS for 🚨🚨🚨ESPORTS. This coin is about to fall... don't miss out. Target: 0.01220
post-image
ESPORTS-5.30%
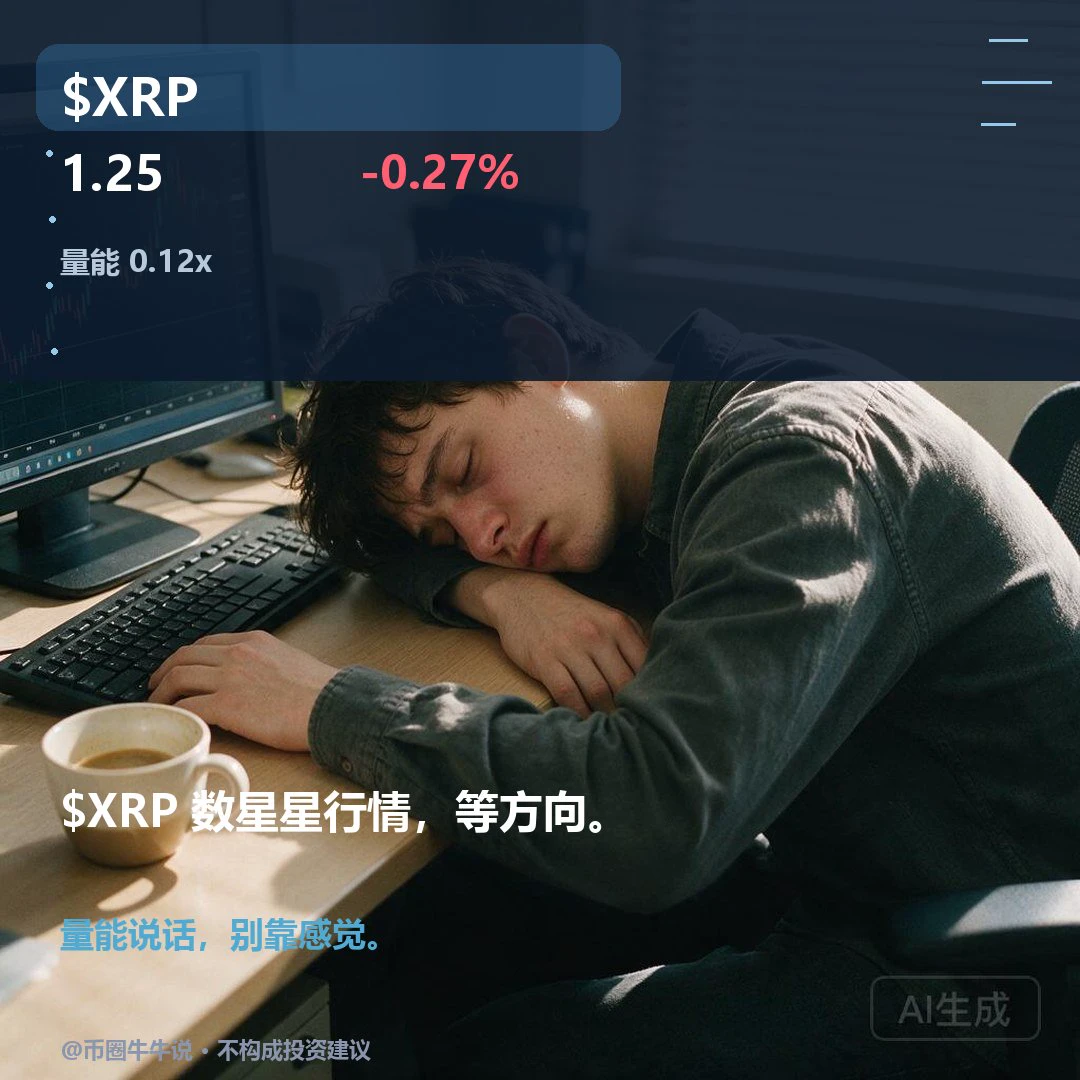
$XRP is currently at 1.2507, down 0.27% over 24 hours. Weakness on both the 1-hour (RSI 54) and 4-hour (RSI 54.4) charts points to further downside. If it holds above the 1.26 resistance level, a rebound may be worth watching for; if it breaks below the 1.246 support level, further downside is possible. Volume is insufficient. Going forward, watch whether it can hold above 1.26 and whether it can reclaim 1.246 if that support fails. Markets are volatile; for observation only.
post-image
XRP-1.15%
$XAUUSD
Gold’s indicators have entered deeply oversold territory, with bearish momentum being unleashed in force. Oversold conditions mean short-term downside momentum is exhausted, not that the trend will reverse immediately. The daily chart has formed a large bearish candle with almost no wicks, and support levels have been breached one after another, with bears dominating the market. On the 4-hour chart, a large bearish candle broke support and moved lower, stoking market panic. The slight rebound from the lows is merely a technical pause after the sharp drop. The bulls’ counterattack is l
XAUUSD-3.63%
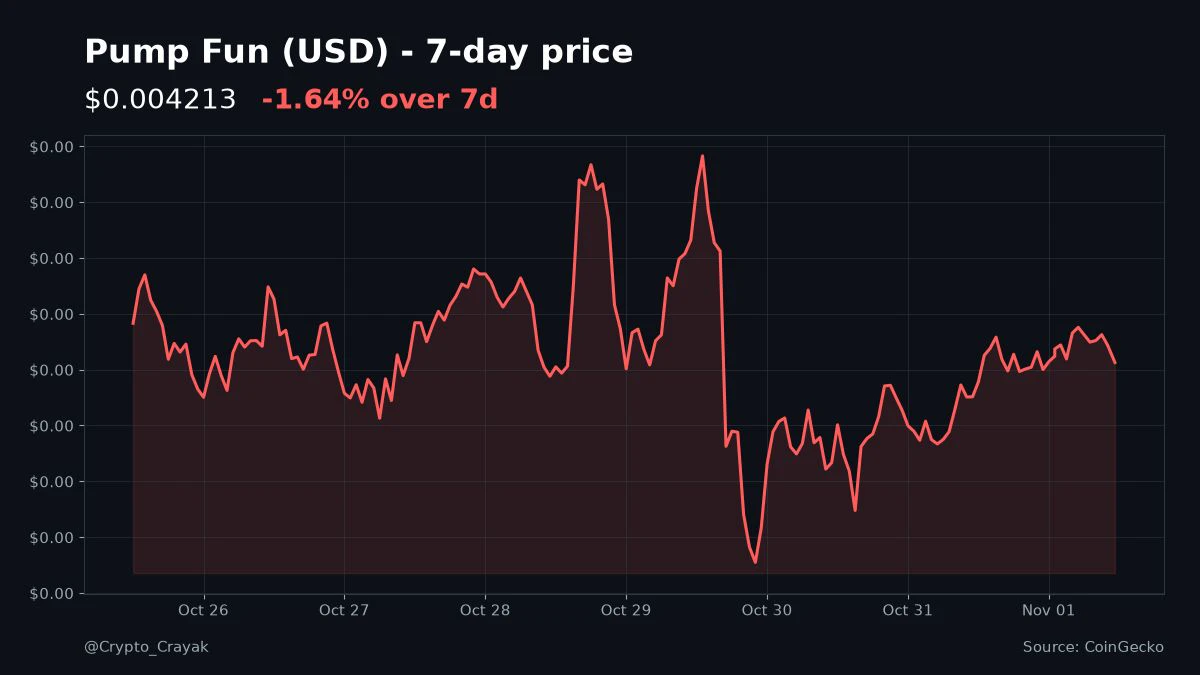
A whole week of swings on $PUMP and it's basically right back where it started, down less than 2%.
All that chop to go nowhere. Honestly that's the most crypto thing ever.
Do you sit through weeks like this or trade the range? @Pumpfun
post-image
PUMP-1.06%
As I mentioned before, @ActionModelAI has a points system, and these points convert to solana:979vfT471Y2pm4WAjq5JiasLTQmgcWK46EjphDW3pump tokens at TGE.
Let me quickly go over the ways to earn points, then I’ll tell you a super simple yet attractive method.
Main ways to earn points:
- Completing ActionFi tasks (with higher multipliers)
- Inviting others (Referral)
- Participating in campaigns and quests
- and one of the most attractive way to earn points for me is simply turning on the extension when you sit down to work and leaving it active until you’re done.
All the clicks, searches, and
SOL-0.77%
Load More

Join 40 M users in our growing community

⚡️ Join 40 M users in the crypto craze discussion

💬 Engage with your favorite top creators

👍 See what interests you

Trending Topics

BTC大跌

485.89k Views39.88k Discussing

$BTC briefly fell below $77,000 and remains under pressure around the $77K zone, with its 24-hour decline still above 4%. With risk appetite weakening and Fed uncertainty rising, where is the next key support after losing $80K?

IntelBeatsEarningsButStockPlunges

44.42k Views1.07k Discussing

StrategySTRCNears100ParValue

52.64k Views4.22k Discussing

View More