
Square
Following
Hot
News
Notifications
Profile
Share your thoughts
placeholder
Article
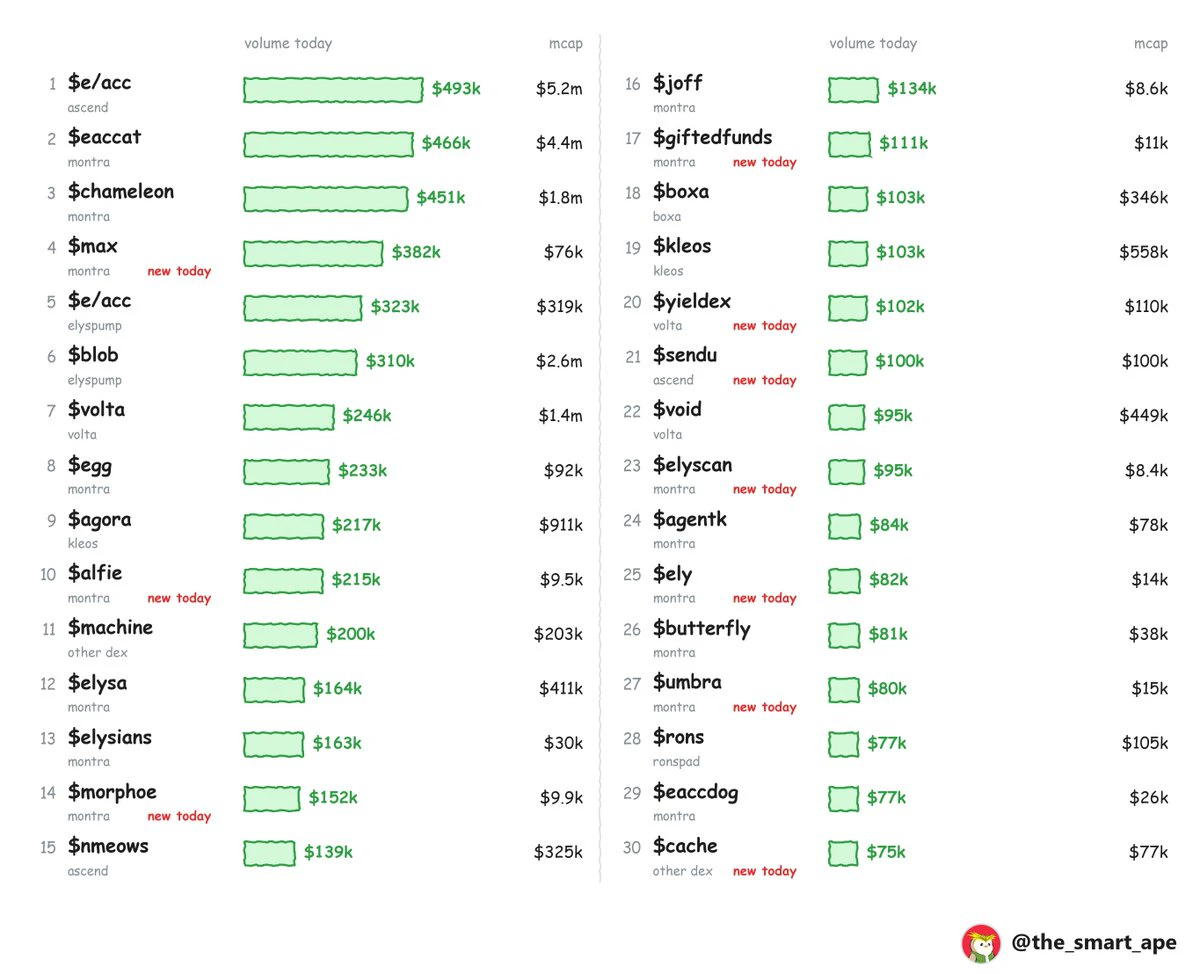
the 30 most traded coins on @Enter_Elysium today.
public mainnet is nov 9. one of these will do 100x. try to find which one.
post-image
ON+4.77%
PUBLIC-1.88%
$TRX Short, sellers need to hold 0.320 on the 4H chart. Price is right below EMA50. I’d like to see a wick that spikes up and gets rejected, rather than price slowly breaking through it. That’s the whole idea. Quick read: - Price is 0.320 on the 4H chart, below EMA50 at 0.320; sellers still control the trend - 1H RSI is 68; the hourly timeframe is overheated - The daily price is below EMA200 at 0.326; the higher timeframe also supports this view. Short 0.3202–0.3204 Take profit 0.3199 / 0.3196 / 0.3192 Stop loss 0.3210 Not financial advice; do your own research.
post-image
TRX+0.42%
Trenches
ZIG
Z
bade
b
ZIG
0x8c...1145
Market Cap
$.
Change
.
24h Vol
$.
Holders
.
BTC
B
bade
b
BTC
C5xp...pump
Market Cap
$.
Change
.
24h Vol
$.
Holders
.
STONK
S
bade
b
STONK
6GmA...UNgx
Market Cap
$.
Change
.
24h Vol
$.
Holders
.
José
J
bade
b
José
87CQ...1UJT
Market Cap
$.
Change
.
24h Vol
$.
Holders
.
IDOL
I
bade
b
IDOL
0x3b...ab07
Market Cap
$.
Change
.
24h Vol
$.
Holders
.
DANGCEM
We hit a new ATH of ₦1,490/share and got a nice rejection. Right now, what I’m seeing looks like profit-taking.
What do I see on the chart? I’m watching two regions.
₦1,154.80–₦1,192.20/share. This is the first zone I’m watching. If it holds, I see it as a decent region to start building a position.
₦1,000/share. If the first zone fails to hold, the next bus stop I’m watching is the ₦1,000 psychological level. If we get there and the bulls defend it, that’s where I’ll bring out the bazookas.
Both zones look beautiful to me. After the run DANGCEM just had, I want to see where the buyers
post-image
  • 1
$ONE Now at 0.0024, up 44.64% in 24 hours, touching a high of 0.0025 and a low of 0.0016—from the bottom, it surged directly over 50%, with trading volume hitting $575 million. Retail investors couldn’t have driven this kind of volume; clearly, money is sweeping up tokens. Looking at the chart, there’s support on pullbacks in the 0.0021–0.0022 range, while 0.0025 is short-term resistance; a breakout needs to be backed by volume. As for trading, chasing at the current price is risky. Wait for a pullback near 0.0021 to try a small long position, set a stop-loss below 0.0019, and take profit at t
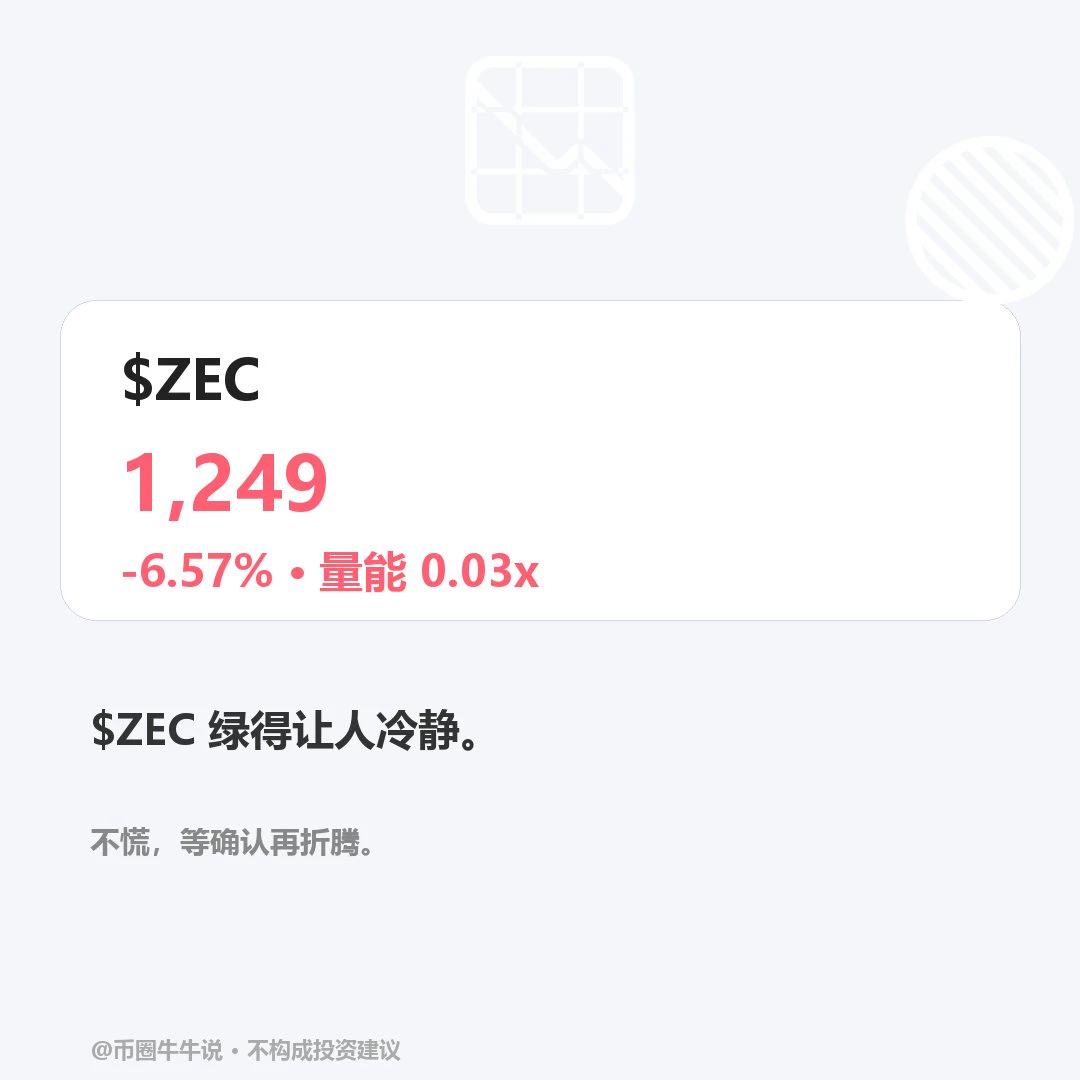
$ZEC Currently at 1248.69, 24H -6.57% (range 1236.65–1364.08). The 1H trend is weak, with RSI14.07 in oversold territory; price is below EMA20 at 1279.88, and the volume ratio is 0.03. The 4H trend is weak, with RSI51.89; price is below EMA20 at 1283.09. Watch for a sustained move above the 1364.08 resistance; a break below the 1236.65 support would weaken the structure. For review, check whether price holds above 1364.08 and reclaims 1236.65; volume is only 0.03x. A low-volume hold or a breakdown that is not reclaimed would invalidate the setup. Markets are volatile; for observation only.
post-image
ZEC+1.16%
I just added another entry trade on $IDOL targeting 0.0305-0.0270
post-image
IDOL-6.71%
GN weekend crew 🌙 Quiet tape tonight.
US cash is closed, crypto just chopping. $BTC near $75.7K, $ETH around $2.23K, basically flat after Friday's dip into the mid-75s. Spot BTC ETFs saw about $1.3B leave this week, and Fear & Greed is still Extreme Fear. Thin books. I'm not forcing size.
Monday: Fed speakers (Bowman, Goolsbee, Barkin), China CPI/PPI in Asia hours. Real event is Tuesday CPI.
Weekend liquidity loves fakeouts. Leaving room for the open.
#Bitcoin #Crypto
post-image
BTC-0.67%
ETH-1.26%
Crypto market: Long-term holder supply share—are old wallets accumulating or distributing? Bull-to-bear transition: old coins stay put, or even continue accumulating. Bear-to-bull transition: old coins start moving to exchanges in large amounts. When veterans distribute, newcomers are celebrating—this is what defines a cycle top. ③ Exchange balances: falling balances = coins being withdrawn (accumulation); rising balances = preparing to sell. Note: ETF/institutional custody can distort this metric, so compare like with like. ④ Stablecoin total market cap: the market’s “ammunition reserve.” Exp
post-image
BTC-0.65%
ETH-1.23%
Notice how Protestants have no issue calling each other brothers in Christ but condemn the apostolic Churches for referring to their priests as “Father” without understanding what Jesus meant
St-Paul told the Christians in Corinth the he was “their father in Christ” - 1 Cor 4:15
post-image
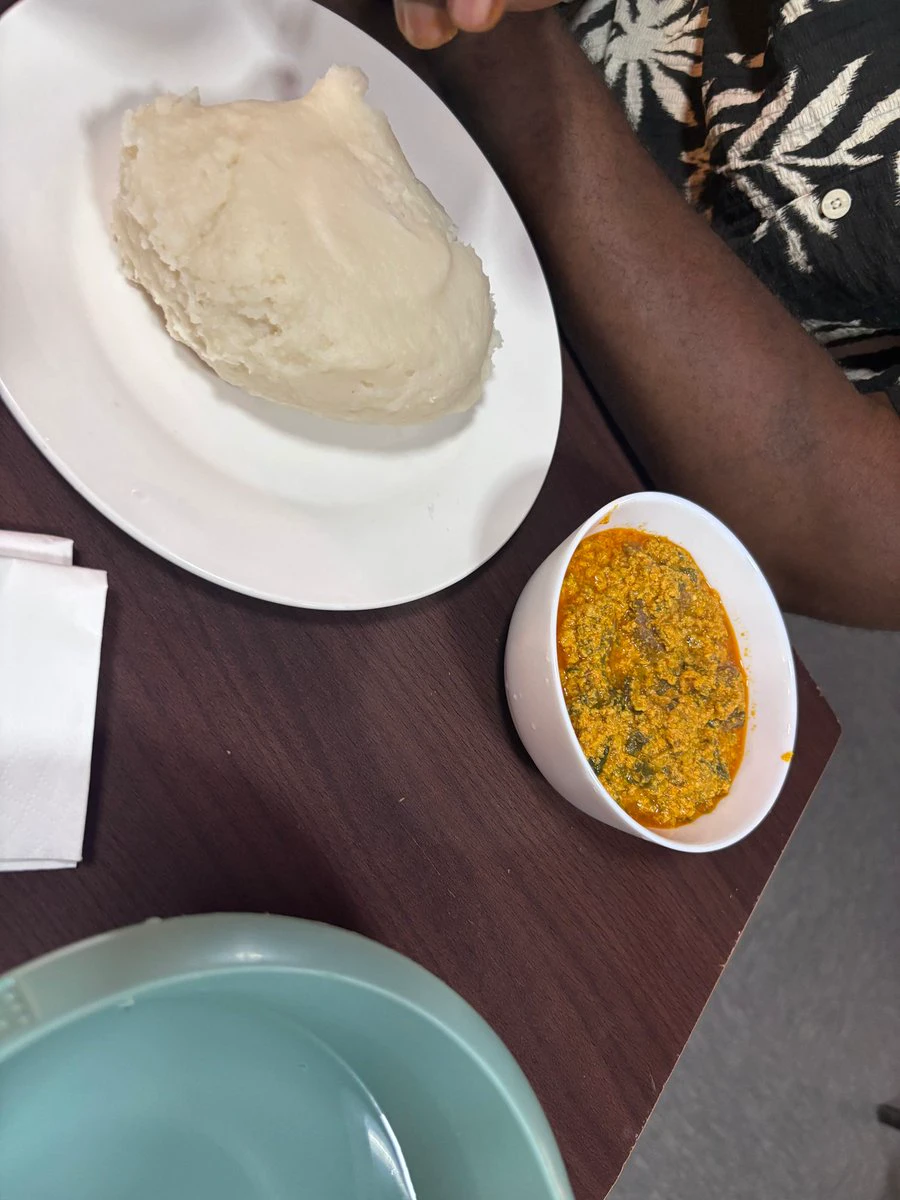
this why I wasn’t active today
Pardon the pounded yam and egusi, it was the best I could get here
post-image
NGXINDUSTR
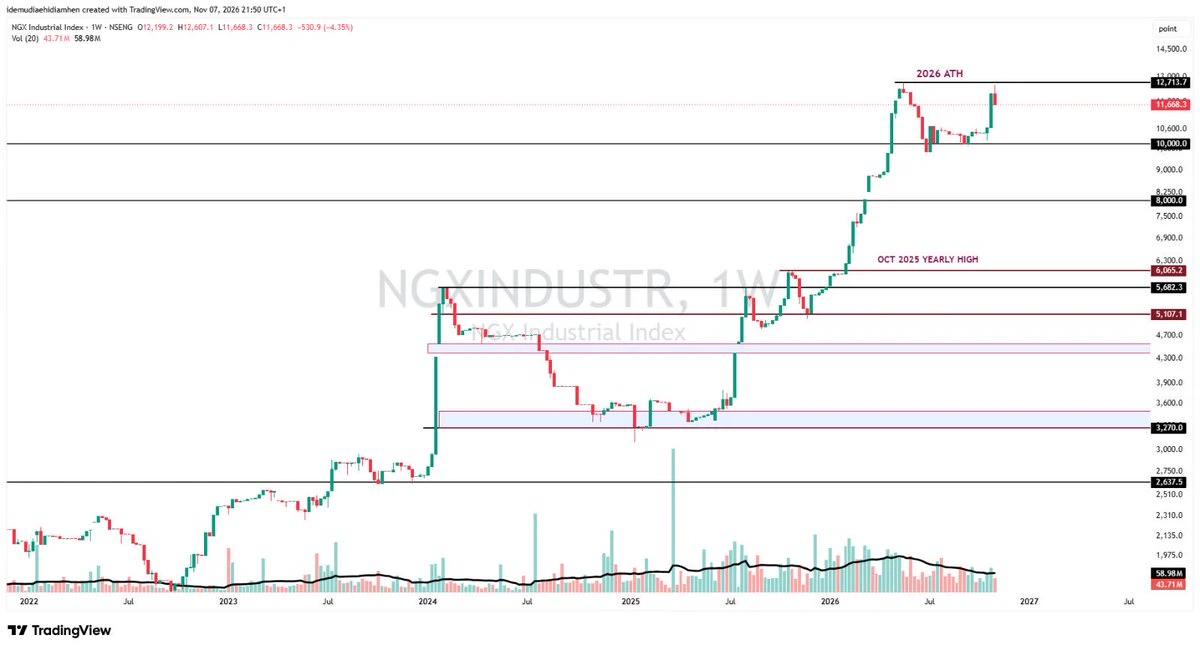
If you’ve been following Greenticker Warriors on YouTube, you’ll recall what I said three weeks ago. I expected the NGX Industrials Index to respect 10,000 points, and I said DANGCEM would be the one to drive any major run.
We nailed the call on the run. I expected the index to mint a new ATH, but we came up just 7 points shy before the market rejected that level. What we’re seeing now looks like a healthy pullback to me.
So, what do I see on the chart?
I’m still watching 10,000 points. That’s the level I want the bulls to defend, and I expect it to hold.
#NFA
post-image
INDEX+0.00%
Digging through Hyperliquid whale positions again in the early hours
The short positions are stacked pretty aggressively
BTC shorts: around $890–920 million
Longs: around $450–480 million
Shorts are roughly twice the longs
Net short: around $350–470 million
The most bearish positioning since October 2025
The largest single short is around $178.5 million
Entry price around 76390
There are also shorts of around $155 million and $101.8 million
Quite a few are above $60 million
They flipped to net short around October 27 and have kept adding since
BTC perpetual open interest on the platform is aro
post-image
BTC-0.65%
  • 1
Not even the s&p can keep this floater down
post-image
SPX+0.33%
Don’t guess the timing; check whether all four “engines” have ignited at once. A bull market launch isn’t a price phenomenon—it’s a capital phenomenon. It only counts as a launch when all four dimensions line up.

① Capital: Where is the new money coming from? The total stablecoin market cap expands for 4 consecutive weeks (the most honest indicator: money arrives before prices rise); BTC balances on exchanges continue to see net outflows; ETFs and institutional products see net inflows for more than 20 consecutive trading days; funding rates turn moderately positive (not extremely high—extrem
post-image
BTC-0.65%
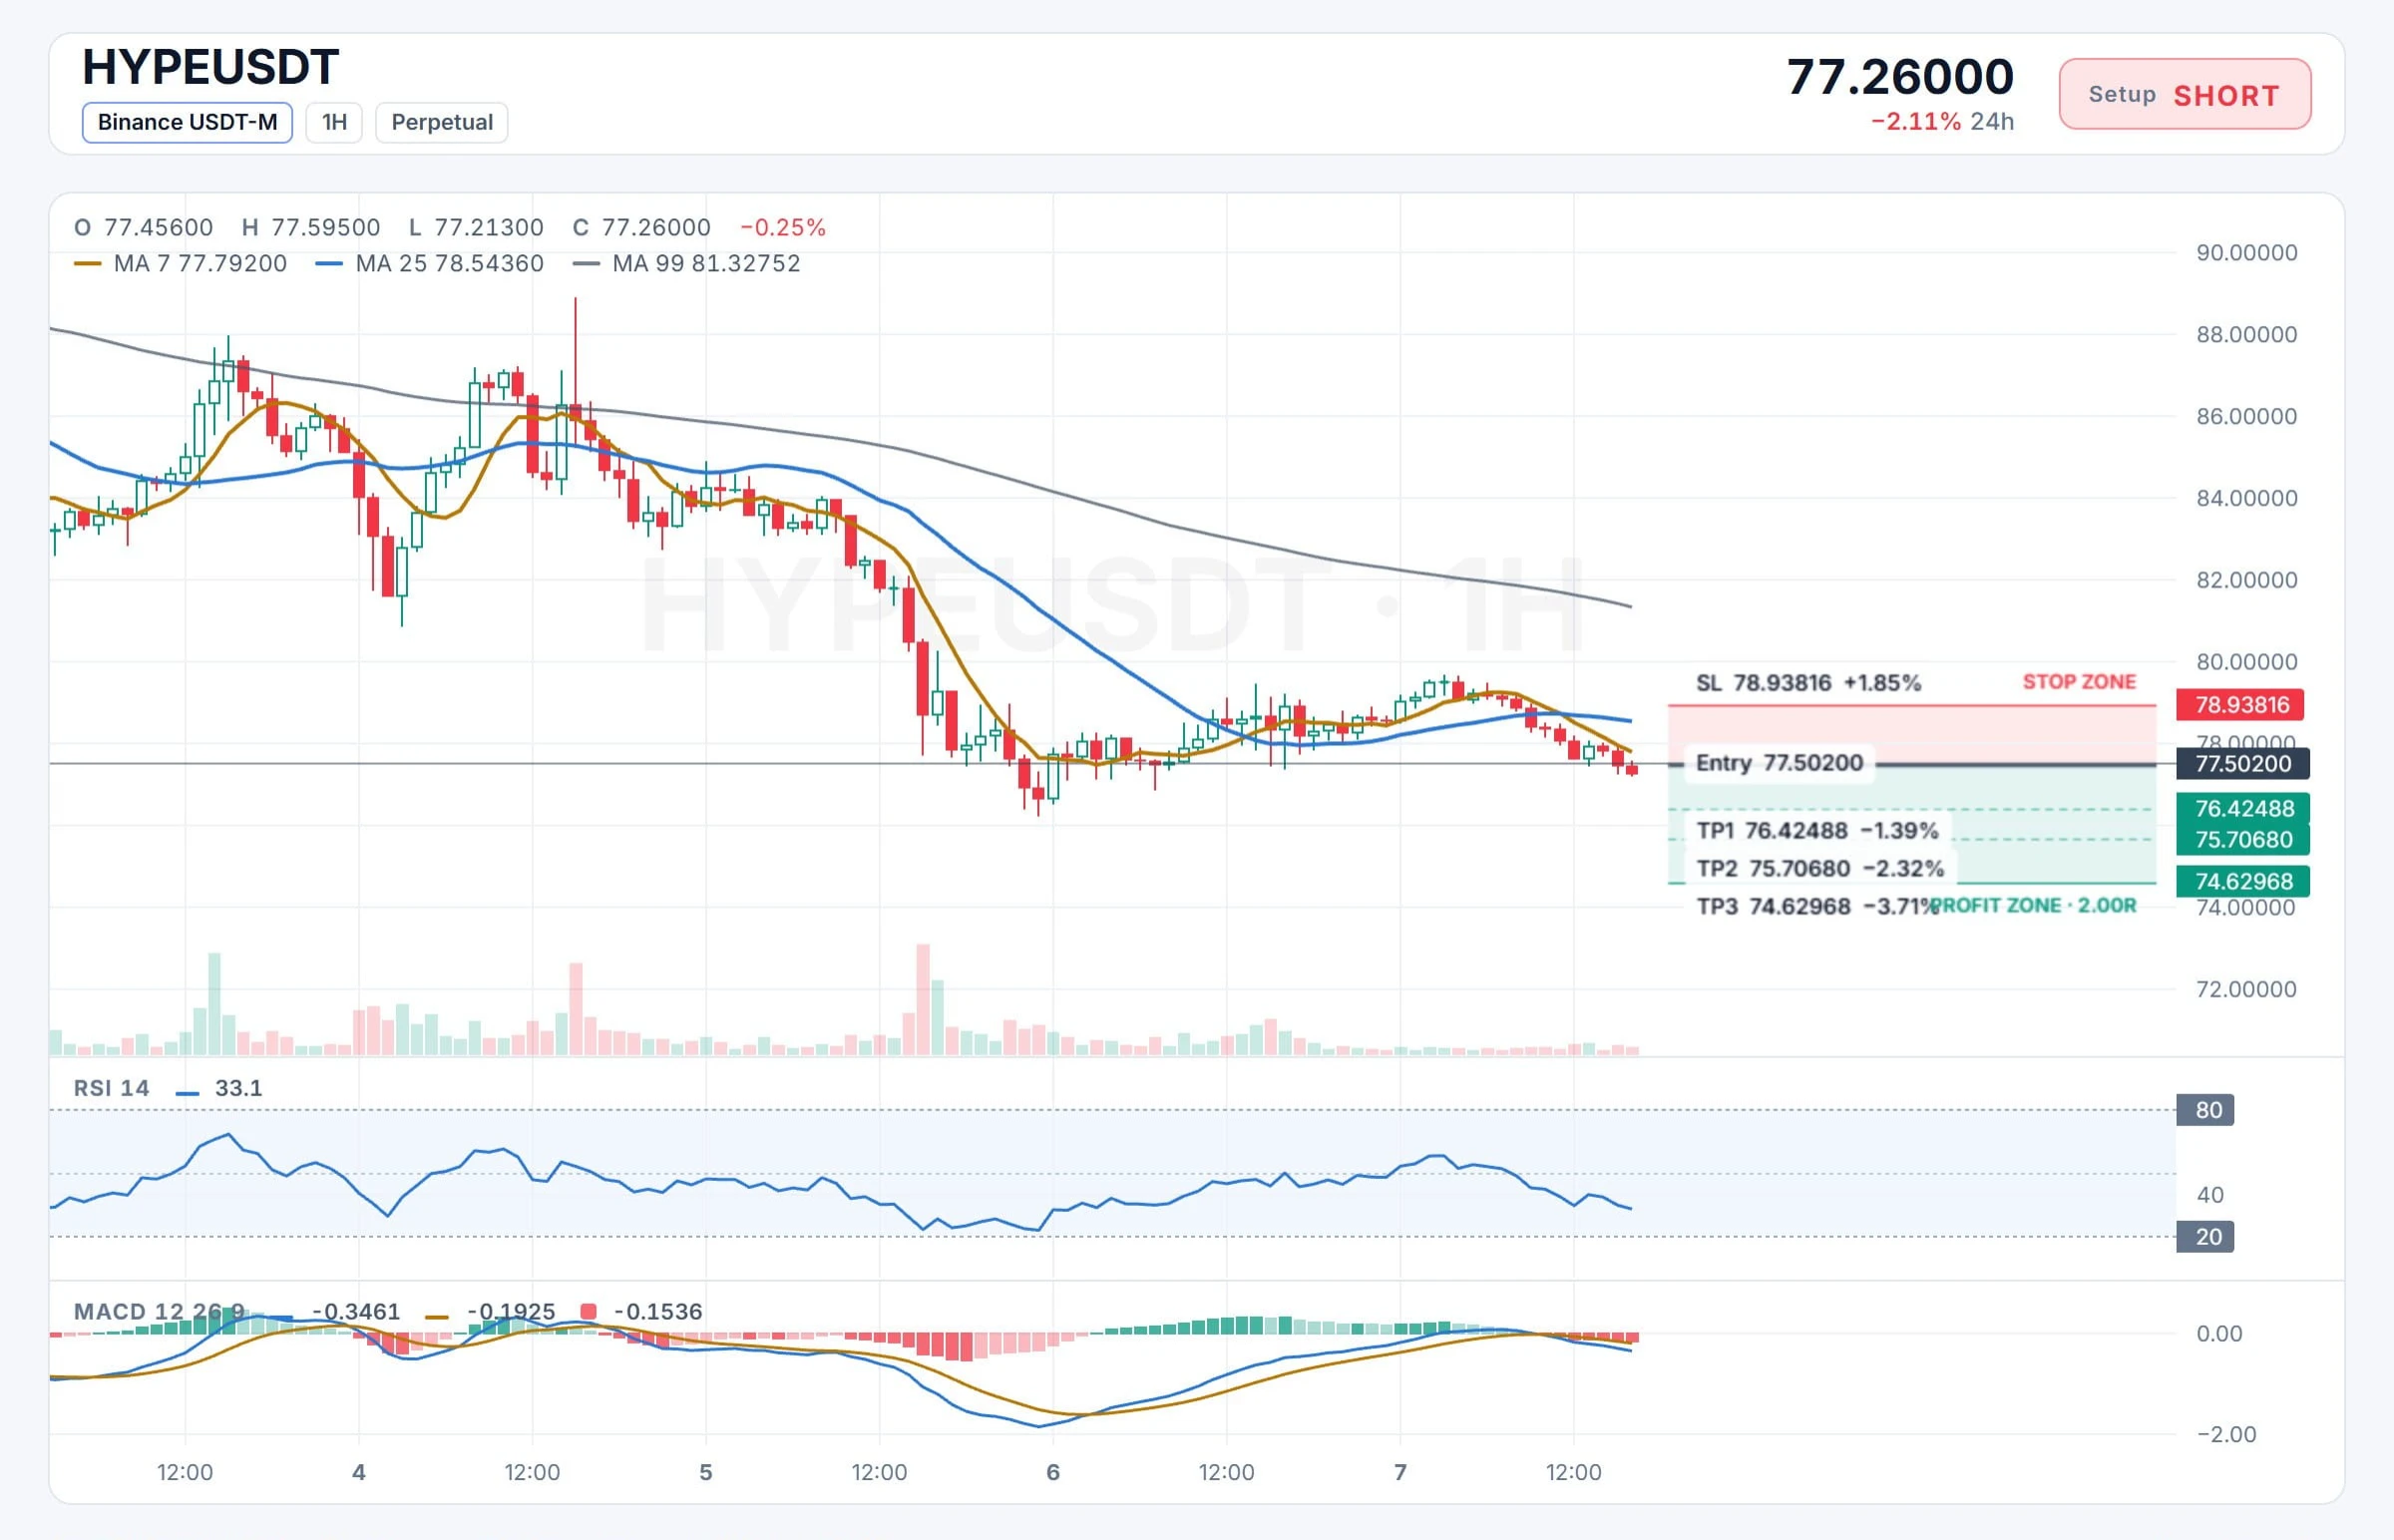
BULLS CAUGHT $HYPE USDT Short Trade Ready to Go

$HYPE /USDT

Trade Direction: SHORT

Entry Price Zone: 77.50200

Take-Profit Levels:
🔹 TP1: 76.42488
🔹 TP2: 75.70680
🔹 TP3: 74.62968

🛑 Stop-Loss Level: 78.93816

$HYPE ‌
post-image
HYPE+0.33%
Crypto Trade Now
live-cover
LIVE706
[NEWSTREAMER]market update
live-cover
LIVE35
$STONK Watching the order book this time made it pretty obvious to me: three wallets sold off almost back-to-back within the same time window, dumping nearly $300,000 worth of tokens in a few minutes. The market cap fell from around $70 million to $60 million, a short-term drop of about 14%. A quick look at the on-chain records shows three sell orders of roughly $110,000, $100,000, and a little over $80,000, placed less than five minutes apart. The selling pace looks a lot like the same group of funds reducing their positions all at once. As someone who just got in, I’m baffled: are several wh
post-image
STONK+11.55%
BTC-0.67%
ETH-1.26%
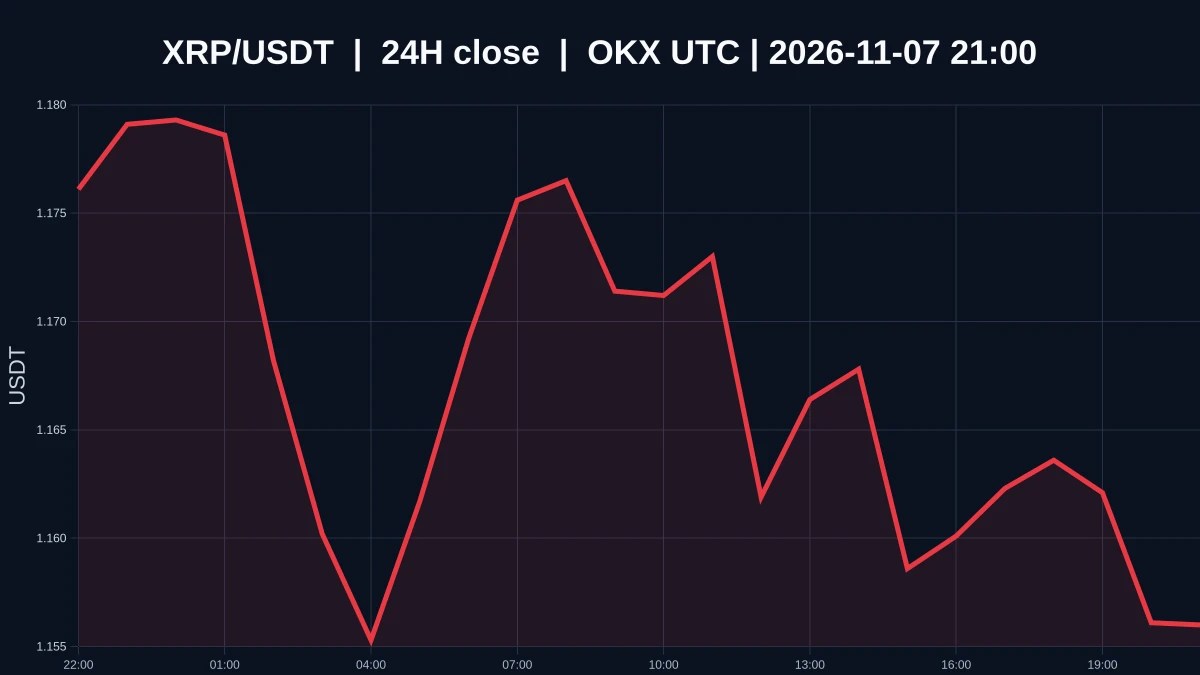
$XRP Is Weak on Low Volume at 1.1567. What’s Still Missing Between Oversold and a Bottom?
$XRP is currently priced at 1.1567, down about 1.44% over the past 24 hours, with an intraday low of 1.151 and high of 1.1853. The 1-hour and 4-hour trends are both weak, and the volume ratio is around 0.0429, indicating low market participation. Oversold describes a condition; a bottom is a confirmed outcome. A steep decline only shows that selling pressure has occurred. It does not automatically mean the price is cheap, much less prove that buyers are actually defending the area around 1.151. Demand for
post-image
XRP-1.15%
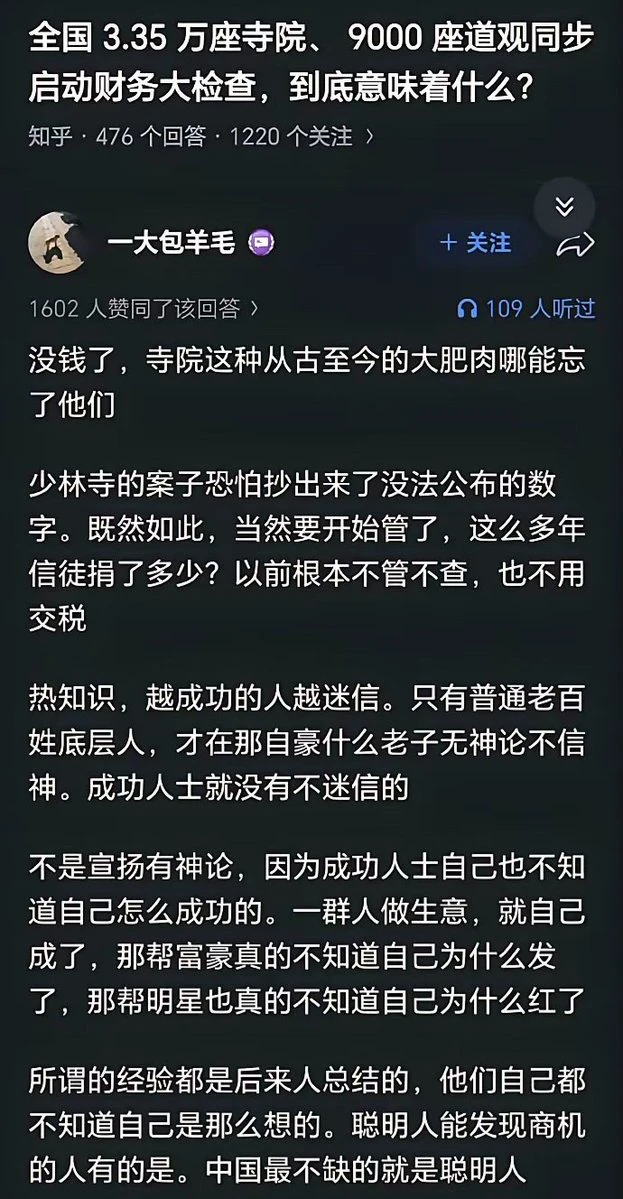
If burning incense and praying to Buddha worked,
ordinary people might not even be able to get through the temple doors.
post-image
Load More

Join 40 M users in our growing community

⚡️ Join 40 M users in the crypto craze discussion

💬 Engage with your favorite top creators

👍 See what interests you

Trending Topics

USAIStocksHitHard

21.24k Views3.67k Discussing

U.S. stocks sold off sharply on Thursday, November 5 (UTC). The Nasdaq closed down around 5.5%, entering correction territory, while the Philadelphia Semiconductor Index plunged roughly 12%, with chip stocks including $NVDA and $AMD posting steep losses. Beyond profit-taking, investors are growing concerned about the pace of AI data center construction, capital spending, and future returns on investment. The key question now is whether the AI sector’s lofty growth expectations need to be repriced. Where do you think the next opportunities will emerge: chip stocks, tech giants, or other sectors?

USNonfarmPayrolls

34.98k Views4.34k Discussing

StakeOnLaunchpoolToShare450KVLX

10.25k Views829 Discussing

View More