



Square
Following
Hot
News
Profile
Share your thoughts
placeholder
Article
#美国9月PPI大超预期 #美国9月CPI超预期 The Federal Reserve, Inflation, and Employment: How Ordinary People Can Understand U.S. Macroeconomic Indicators
Don’t confuse CPI, PCE, and PPI
CPI: Price changes on the consumer sideCPI, the Consumer Price Index, measures the average change in the prices of a basket of goods and services purchased by urban consumers, including food, housing, transportation, and medical care. Every household has a different consumption structure, so personal experiences and the index average may differ. The “core CPI” often mentioned in the news excludes food and energy. This does not
XAU+0.52%
#USSeptemberPPIBeatsExpectations
📊 CPI yesterday, PPI today— inflation has repeatedly exceeded expectations. How will the market respond?
U.S. PPI rose to 6.3% year-on-year in September and increased 1.3% month-on-month, once again surpassing market expectations.
Combined with the previously stronger-than-expected CPI data, inflationary pressure has once again become the market’s focus.
But interestingly, the market has not moved in a single direction:
📉 BTC has pulled back to around $80,000, putting bulls to the test
📊 U.S. tech stocks are under pressure as funds begin reassessing risk
🥇
post-image
BTC+1.15%
Currently opened high and pulled back; waiting for stabilization
post-image
Came across Tesla and Xiaomi at the same time😂😂
One is flying, while the other is testing whether the suitcase is closed
post-image
solana:6sEf597zqUxoJeW1znjtx8MUPsXFFF7zjjH2KSG8zF9y
6sEf597zqUxoJeW1znjtx8MUPsXFFF7zjjH2KSG8zF9y
Potential to go 80%
#crypto $sol
SOL+2.86%
#美国9月PPI大超预期
U.S. September PPI Comes in Much Hotter Than Expected — What Does It Mean for the Market?
Recently, I have been paying close attention to U.S. economic data because I believe inflation is one of the biggest factors influencing the direction of financial markets. The latest September Producer Price Index (PPI) report has caught my attention, as producer prices increased much more than economists expected.
According to the reported figures, U.S. PPI rose 1.3% month over month in September, while the annual increase reached 6.3%. The monthly increase was the largest since March 202
Alt coins will go parabolic like this
post-image
#USSeptemberCPITopsEstimates 5 Numbers That Tell the Real Story
The headline from Wednesday's inflation report was simple: prices rose faster than expected. But the numbers underneath are what really matter. Here are the five I kept coming back to.
1. 3.7%: the headline
Consumer prices rose 0.6% in September from the month before, taking the annual inflation rate to 3.7%, up from 3.4% in August and above economists' expectations of 3.6%. It's the second straight month of acceleration, and the pace is moving further from the Fed's 2% goal.
2. 9.1%: gasoline
Fuel did most of the heavy lifting. M
GAS-0.59%
US500+0.25%
life isn’t a race. do things at your own pace.
some years ago, when i was still living in the hood, i saw a lot of young boys getting involved in fraudulent activities and all sorts of things just to make money.
at the time, their lifestyle was something else.
they had money to spend, expensive clothes, flashy cars, and the kind of lifestyle that could make an average young person feel like they were missing out on life.
everywhere you turned, someone was showing off something new.
and honestly, it was tempting.
there were moments i almost felt like i was moving too slowly.
i started wondering
post-image
[New Streamer] Whales Moves in Sync!
live-cover
LIVE2,443
10.16 Morning ZEC Public Strategy
Short Strategy $ZEC
  Entry zone: Light short near the area above 1240-1260 after a pullback
  Stop-loss defense: around 1300 (execute planB after breakout)
Take-profit levels
  First take profit: around 1220
  Second take profit: around 1180 (middle-band level)
Third take profit: around 1140 (dense trading zone)
Fourth target: below 1090 (lower-band support)
Operational factors: The current price is above the Bollinger middle band; the Bollinger Bands show signs of narrowing while moving upward. This rebound has continued with rising
ZEC+10.24%
Semiconductors completely wrecked my trades—they somehow turned A-shares’ T+1 into T+0.
post-image
#韩股大跌你会抄底吗
South Korean Stocks Are Plunging — Would You Buy the Dip?
The South Korean stock market is facing renewed selling pressure, raising an important question for investors: Is this the right time to buy the dip, or is it better to wait for more stability?
Why Is the Market Falling?
A sharp decline in South Korean equities can reflect several factors, including global economic uncertainty, changing interest-rate expectations, profit-taking, and weakness in technology and semiconductor stocks. Since South Korea's market has significant exposure to global technology demand, movements in
post-image
Every time $BTC drops, there’s suddenly a reason not to buy.
In a bull market, bad news is deliberately amplified to scare people out of their positions.
Scared money doesn’t make money.
Greed can stay elevated for months while the market keeps pushing higher. Study.
post-image
BTC+1.15%
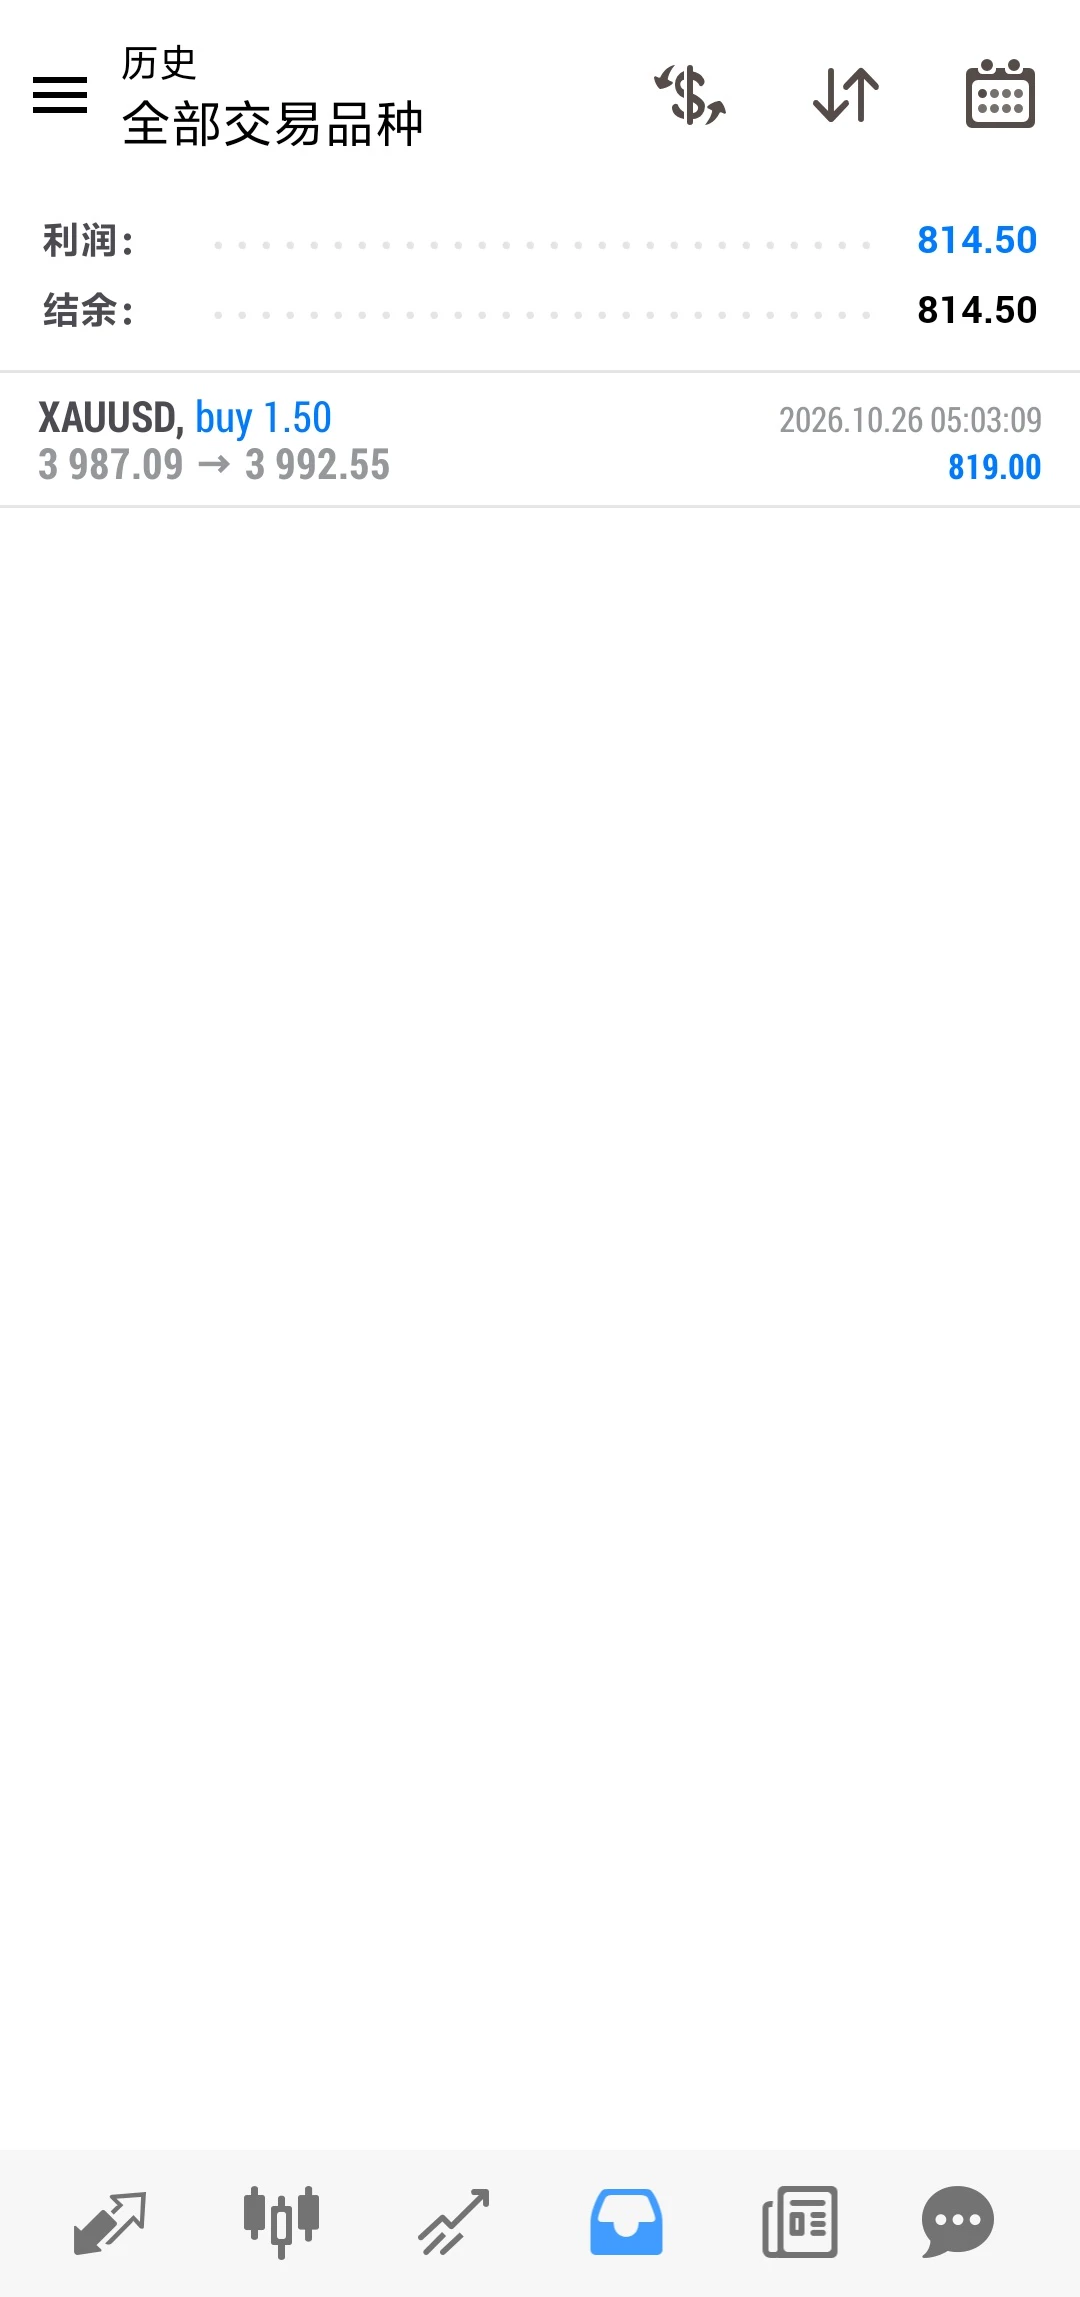
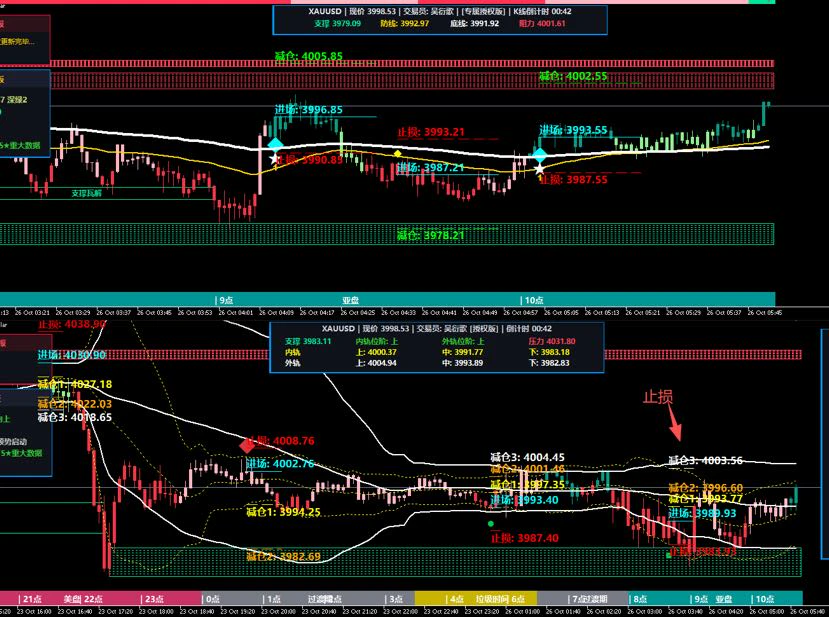
Today's gold: KPI two deals completed, making money is as easy as drinking water! ✊🏻✊🏻✊🏻
GLDX+0.43%
PAXG+0.46%
Hi lawyers!
Just conducting some business transactions 👀
post-image
$TRX TRX at End of Multi-Year Correction, Could go to $55+
TRX has spent months in an extremely tight range within what I’m counting as wave-e of E. My volatility-compression indicator is showing extreme, persistent readings, with the current stretch approaching its historical duration record.
I’ve labeled the potential 2018–2026 correction as a triangle, although other interpretations remain possible. The more immediate focus is the contracting structure developing from the 2024 high. If this triangle is completing, the count favors an upward thrust.
The bigger question is what that triangle
post-image
TRX+1.37%
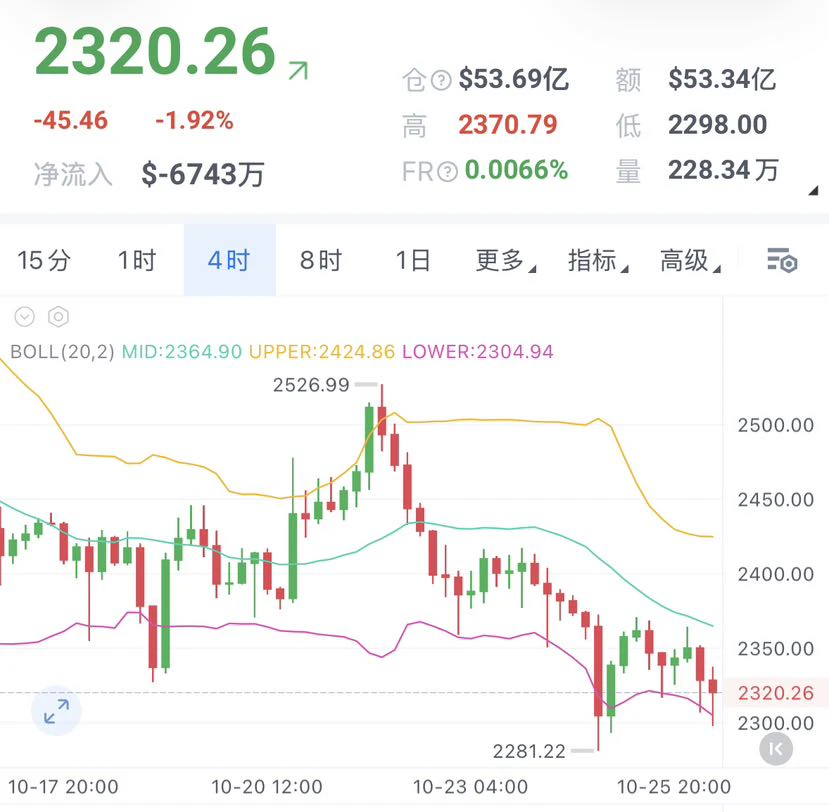
261016 Bitcoin follows weekly line 2. Those who took a half position for the long term yesterday should fill it up before next week depending on market conditions; hold other long-term positions firmly, and use stop-losses for short-term trades! BTC resistance levels: 83725/85206/86357. BTC support levels: 80765/79284/78133. Ethereum resistance levels: 2486/2530/2564. Ethereum support levels: 2398/2354/2320. Place the stop-loss slightly beyond the third price level. Intraday trades should not exceed 5% of the position. Live streams are available in the afternoon and evening; follow the profile
post-image
BTC+1.15%
Load More

Join 40 M users in our growing community

⚡️ Join 40 M users in the crypto craze discussion

💬 Engage with your favorite top creators

👍 See what interests you

Trending Topics

USSeptemberPPIBeatsExpectations

91.35k Views1.9k Discussing

US September PPI came in at 6.3% YoY, well above the 5.3% market expectation, pointing to renewed producer-side inflation pressure. Weekly jobless claims were 199K, broadly in line with forecasts. Could hotter inflation further reduce room for rate cuts, and what does it mean for $BTC, US stocks, and gold?

GateWCTCS9GlobalTradingCompetition

37.87k Views6.41k Discussing

WarshIMFSpeech

62.4k Views749 Discussing

View More