Share your thoughts
placeholder
Article
A few days ago, my hand trembled slightly while setting the stop-loss; this morning, I realized that was unnecessary filial piety.
During the repeated intraday swings, $BEAT was pushed back every time it rebounded to around 0.1339, increasingly looking like the bulls were running out of steam. Support above was too weak, and volume failed to follow, so I went short with the trend, set the stop-loss, and went to sleep.
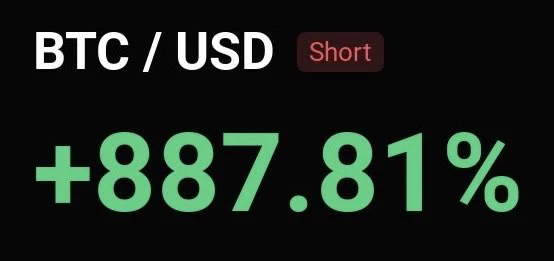
When I opened the chart this morning, it had dropped straight to 0.1233, +152.93%. That sleep was worth it—I didn’t stay up for nothing. The short position had exactly the tempe
post-image
BEAT-0.56%
DOGE+7.01%
BTC+0.03%
Everyone’s staring at H/USDT’s bounce—but the 4H tape just whispered a secret that 95% of traders will ignore.

H/USDT - SHORT

Trade Plan:
Entry: 0.07631 – 0.07705
SL: 0.08024
TP1: 0.07401
TP2: 0.07222
TP3: 0.06955

Why this setup?
- RSI (15m) is pinned at 33.52—weak momentum, not oversold enough to reverse a bearish 1D trend.
- ATR (1h) at 0.001485 means volatility is contracting—perfect setup for a liquidity sweep below 0.07631.
- With TP1 at 0.07401 and TP2 at 0.07222, the path of least resistance is down, not up.
- Why now? The 0.07960 invalidation is miles away, giving shorts ro
This move doesn't even require me to think—the account is dancing on its own. When the screen was all green, everyone was selling at a loss, but I didn't panic watching the market. It was bottoming without breaking support, while funds quietly entered—the signal worked better than any analysis.

$SNDK $LAB
post-image
SNDK+1.88%
LAB+2.32%
Awaiting the next shot.

$BNB $SNDK
post-image
BNB+7.27%
SNDK+1.88%
I don’t have the big-picture view and can’t hold on, but these profits are as thin as paper—and I love it. When I opened the chart this morning, the short position was still alive, and the price once again opened lower at a level that even surprised me a little.
Actually, entering this trade was quite straightforward: when the price rebounded to around 0.015588 a few days ago, there was no follow-through on the upside. It spent two hours grinding without breaking that high, while trading volume kept shrinking. This was an obvious key level; I would have been wasting the opportunity if I hadn’t
post-image
BTC+0.03%
ETH+1.02%
Everyone’s watching the 1D trend—but 95% confidence shorts on $LAB /USDT are the quiet exit liquidity.

$LAB /USDT - SHORT

Trade Plan:
Entry: 0.07491 – 0.07539
SL: 0.07742
TP1: 0.07345
TP2: 0.07232
TP3: 0.07062

Why this setup?
Why now? The 4h structure is breaking, and the 1D trend is already bearish—this isn’t a guess.
- RSI 15m at 58.79 shows a weak bounce, not a reversal.
- Entry zone 0.07515–0.07539 aligns with the last defense before TP1 at 0.07345.
- ATR 1h (0.000944) says volatility is compressing—breakouts punish late longs.

Debate:
If the 1D trend is bearish and confidenc
LAB+2.32%
Leverage magic unfolds, with $AKE long-position returns exceeding 11x.
The logic stems from an oversold rebound in early September; accumulation at 0.013 was followed by trend continuation as risk appetite recovered.
Technically, the price broke above its previous high, while the RSI is overbought. The 0.0189 support level is crucial in the short term, so chasing the rally is advised against. $ETH
AKE+43.30%
ETH+1.02%
🚀 NVDA Tokenized Stock: The AI Super-Cycle Continues! Are We Gearing Up for a New ATH? 🚀
Nvidia (NVDA) is showing incredible resilience, and the charts are printing exactly what bulls want to see. Trading at $230.40 (+0.87%), NVDA has staged a massive recovery. Let’s dive into the technicals across multiple timeframes to see where this AI giant is heading next on Gate.io!
📈 1-Day Chart Analysis:
The Ultimate Bounce
The daily chart is a masterclass in trend recovery. After tapping the $190 support level in late July/early August, NVDA has executed a te
NVDA+0.87%
  • 5
  • 2
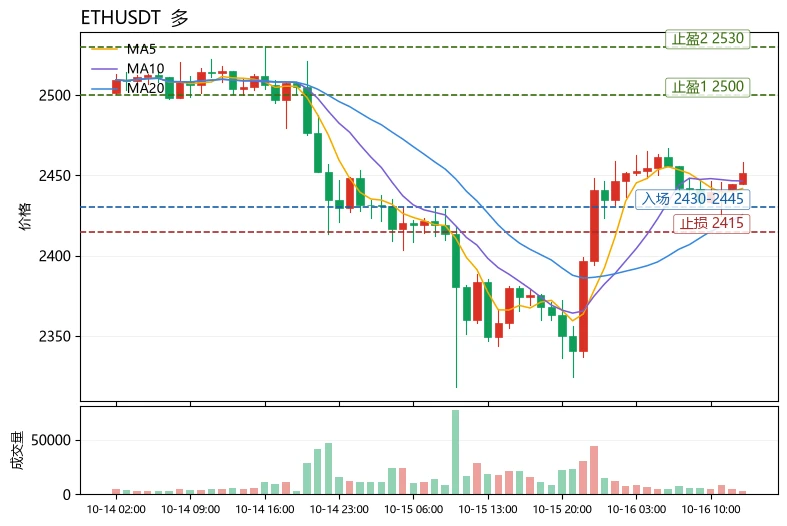
$ETH Signal】1H momentum expansion + order book divergence, go long with the trend
$ETH The 1H MACD histogram at 3.87 continues to expand, with price rising to 2482.53. After the 4H MACD bullish crossover, the histogram is at 0.47, with overall momentum moving upward. Order book depth imbalance is -17.45%, with relatively thick sell-side orders, but price has not pulled back and is tracking the upper Bollinger band at 2481.6. The 1H RSI is 64.05, not yet extremely overbought, while the 4H RSI is 56.8, leaving room to rise. The funding rate is 0.0051%, so the trade is not crowded. The current r
post-image
ETH+1.02%
BTC+0.05%
SOL+1.57%
The most comfortable stage for shorting is when the market enters a one-way decline immediately after placing the order. With this kind of move, there is no need to keep watching the market—you can simply hold. For this move, $FLORK I waited until it rebounded to 0.028294 before entering, because it had previously broken below a short-term consolidation platform, and after a rebound confirmed the key level, it was more likely to develop into a trending move. After entry, the price did not give me many surprises, gradually declining all the way to around the current price of 0.023933, with unr
post-image
FLORK+8.15%
LAB+2.32%
SOL+1.57%
While everyone else is fighting for space in the hot-coin pond, I set up a net in the obscure corners of $BULLA USDT. With 10x leverage, an entry price of 0.028293, and the latest price at 0.087742, the return soared to an astonishing +2085.54%!
I didn’t dare use 50x this time—I was afraid I’d need heart bypass surgery—but 10x still sent me to the moon! BULLA had been playing dead for a while, trading sideways like a rock and shaking out countless impatient retail traders. I crouched in the corner silently reciting Wyckoff, while secretly panicking like crazy.
Livermore once said that money is
post-image
BULLA+210.57%
BTC+0.03%
ETH+1.02%
Crypto Signals and Trding Insights
live-cover
LIVE1,005
Once the market starts rising, the price action becomes restless, especially for those watching the price climb all the way up without holding a position—their mindset is most likely to become unbalanced. After taking this $ARB trade today, I think the most valuable point to review is not that I got the direction right, but that I knew where I should exit.

When I entered, the price was still chopping back and forth within the range. The idea was simple: if the pullback held above the key level, look for an opportunity to go long. So I opened a position near 0.13805 and waited for the market
post-image
ARB+22.73%
LAB+2.32%
XRP+1.09%
  • 2
Everyone’s long $CL /USDT at 91.78—except the 4h tape just whispered a secret.

$CL /USDT - SHORT

Trade Plan:
Entry: 91.69 – 91.87
SL: 92.60
TP1: 91.17
TP2: 90.76
TP3: 90.14

Why this setup?
Why now?
- 1D is range-bound, so no breakout fuel—only mean reversion.
- 15m RSI at 60.4 is fading; momentum is stalling right at resistance.
- ATR (1h) at 0.34 means tight stops—but TP1 at 91.17 is a 0.6% drop that respects the range floor.
- Confidence is weak (55), so this is a scalp, not a saga.

Debate:
Are you fading the 91.78 pop for TP1, or does the range fake you out into 92.39 first?
CL+0.88%
$PENGU : Breakout Retest Under Pressure
PENGU broke above descending resistance and reached near $0.0090, but is now testing the $0.0082–$0.0084 breakout zone.
Key levels: • $0.0082–$0.0084 — support
• $0.0090–$0.0095 — resistance
• $0.0100–$0.0102 — confirmation
Daily short-sale volume has cooled below 1M, while reported short positioning remains above 11M.
The key: holding $0.0082 keeps the breakout structure intact. Losing it weakens the setup.
No prediction — just the levels and positioning worth watching.
#PENGU #PudgyPenguins #Crypto
post-image
PENGU+3.93%
Everyone’s staring at the wrong side of NEAR while the 4H quietly flips the script.

$NEAR /USDT - LONG

Trade Plan:
Entry: 2.1670 – 2.1918
SL: 2.0599
TP1: 2.2690
TP2: 2.3287
TP3: 2.4183

Why this setup?
- My setup says LONG with 95% confidence, yet the 15m RSI is bloodied at 38.57—that’s the classic “bullish shakeout” fingerprint.
- Price is parked at 2.1794, hugging the 1H ATR (0.0497) like a coiled spring. The 1D trend is still bullish, so this dip is the invitation, not the obituary.
- Why now? The “Waiting” status is the tell—the market is loading the cannon before TP1 at 2.2690 an
NEAR+3.11%
Most traders will fade this $SLX /USDT short before the 4h close—here’s why that’s a mistake.

$SLX /USDT - SHORT

Trade Plan:
Entry: 0.06997 – 0.07029
SL: 0.07167
TP1: 0.06898
TP2: 0.06821
TP3: 0.06705

Why this setup?
- RSI 15m at 48.34 = zero momentum to push higher, just dead air.
- ATR 1h (0.000641) shows shrinking volatility—breakouts fail fast in range.
- Entry ref 0.07013 sits below 1D range mid; TP1 0.06898 is only 1.6% away.
- Why now? The “Armed” status means the trap is set before the weekend liquidity hunt.

Debate:
Are you shorting the breakdown to TP2 or waiting for a
SLX+1.84%
$ASTEROID liquidated over 600 million in long positions.
post-image
ASTEROID-13.88%
( new streamer) market overview
live-cover
LIVE65
Everyone’s chasing the next 100x, but ZEC just printed a 95% confidence LONG signal while retail is asleep.

$ZEC /USDT - LONG

Trade Plan:
Entry: 1002.66 – 1010.92
SL: 967.12
TP1: 1036.55
TP2: 1056.38
TP3: 1086.14

Why this setup?
- 4h structure aligns with the daily bullish trend, but the 15m RSI (36.18) is oversold—this is the classic "pullback in an uptrend" setup.
- Entry zone is tight (1002–1010), giving us a low-risk trigger right at the 1h pivot (1006.79).
- Why now? The ATR (16.53) suggests volatility is compressing—breakout fuel is building. Target 1 is 3% away, but TP2 (1056)
ZEC-1.52%
Load More

Join 40 M users in our growing community

⚡️ Join 40 M users in the crypto craze discussion

💬 Engage with your favorite top creators

👍 See what interests you

View More