








Square
Following
Hot
News
Profile
Share your thoughts
placeholder
Article
$TAO
We've been waiting for this to play out for the last few months and Imo, I think we're finally ready to see the break that everyone has been waiting for.
We've just filled and tested the 1W block, all timeframes from the 1H to the 1W is pointing higher.
Four digits is coming soon if this plays out how I expect.
My subs got told to buy at $160. And have their sell targets already.
post-image
TAO+9.55%
The trend is your friend.
ethereum:0x57e114b691db790c35207b2e685d4a43181e6061
post-image
ETH+3.35%
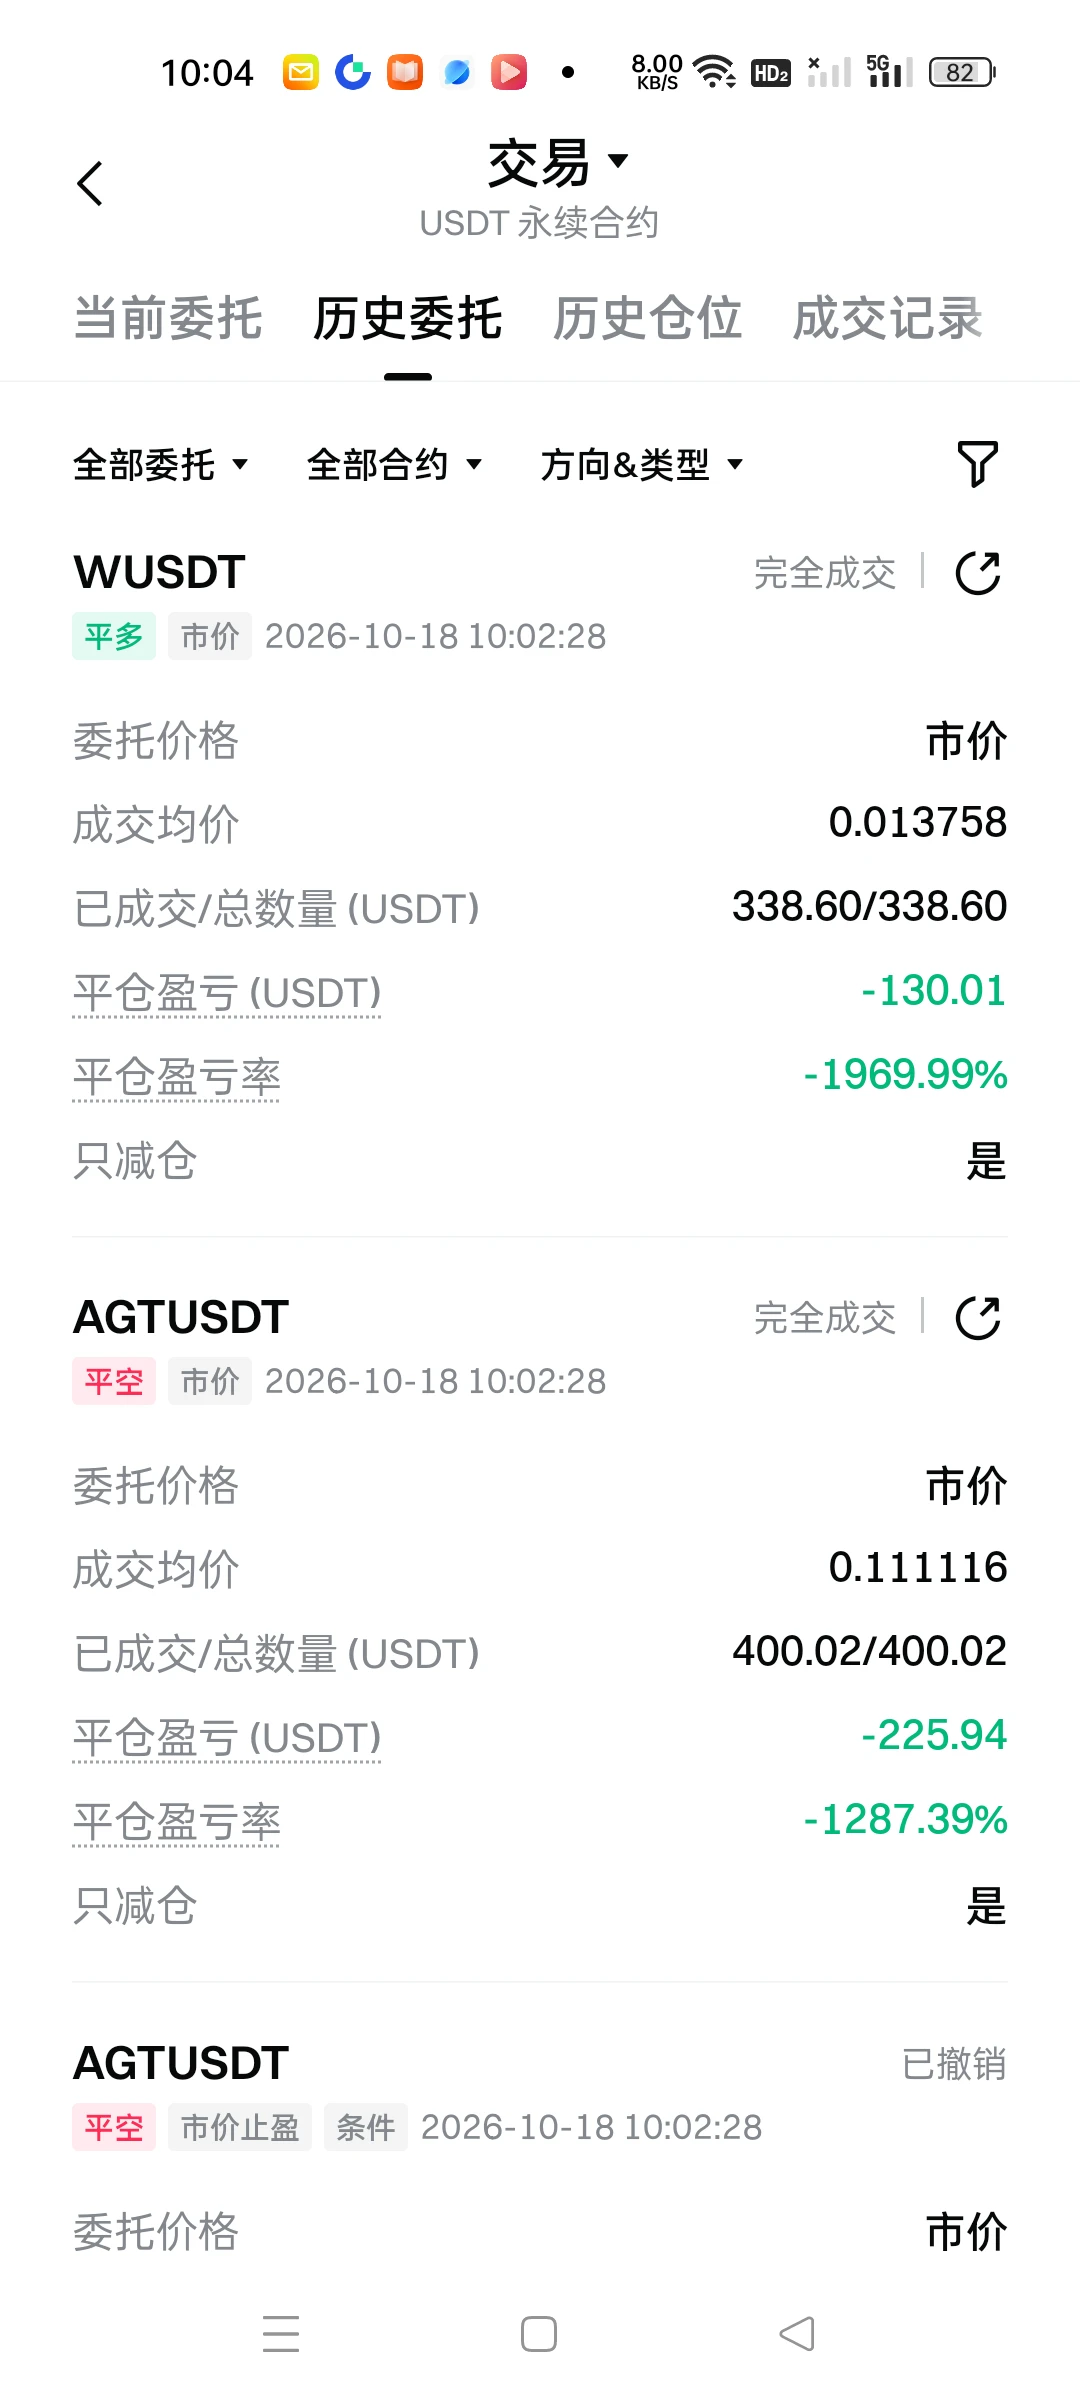
$W I went long with the 200U from the Sesame airdrop. Can you pump it for me? Wave two, start, start!$ETH
post-image
W+0.92%
ETH+3.42%
When this Plinko ball fell, the audio suddenly became entirely my voice 😂
Headphone users, sorry for your ears. @Roobet
post-image
$BTC 4Hour Very Important Area here.
High short liquidation cluster just sit around and above $84k. Saw it and labeled it with Coinglass data.
The most amount of shorts are obviously looking at $87k to get liquidated.
The trend simply looks flipped here with price currently hovering below the main Moving averages that I use. (50, 200 and 100). This doesn't mean we are bearish but is something very important to keep an eye out.
We are not far away from the trend flip so there are chances of reclaim.
If you look closely $80k was a key pivot/orderblock level from where we could have expected
post-image
BTC+1.02%
Finally, you can get through toll booths for free even on regular days!
That’s all I have to say—Musk is awesome.
BTC rebounds from the bottom, with NEAR surging nearly 10 percentage ! Altcoins recover across the
live-cover
LIVE2,336
About working in Japan
All I know is one line: “You wouldn’t want your husband to lose this job, would you?”
post-image
A 2008 Nightmare Revisited? South Korea’s Stock Market Plunges 14.5% This Week, Its Worst Weekly Drop Since the Lehman Crisis!
The latest data shows the KOSPI rebounded 2.05% today to 5,668 points, but this was merely a technical bounce after the plunge—the index fell 14.5% over the week, its biggest weekly decline since October 2008.
I believe the core driver of this sell-off is global capital systematically “de-risking,” with South Korea, as the most sensitive barometer of the AI hardware supply chain, bearing the brunt first. Samsung and SK Hynix together account for more than half of the K
post-image
MU+1.93%
  • 2
  • 1
#CryptoMarketTurnsGreedy Greedy According to Whom? Reading Four Sentiment Meters Before You Trust the Headline
Today's headline says crypto has turned greedy. It is true on one popular gauge, but the picture changes when you check others. I put the readings side by side so you can judge the mood yourself.
METER 1: THE ONE BEHIND THE HEADLINE
Coinglass data shows the Fear and Greed Index at 64 on October 16, a state of greed, up 12 points from the day before. The 7-day average is 60 and the 30-day average is 67.
Here is the swing in a single week from that same data series:
- October 12: 68
- O
post-image
BTC+1.02%
The prediction played out✅
BTC’s rebound into the 82500-83000 resistance zone was rejected as expected, and the price moved lower, reaching around 81600 and offering 900 points of room➕.
The strategy remains unchanged this afternoon; prioritize watching how the range handles resistance.
Stay in step with the structure, keep a steady pace, and hold profits with the trend.$BTC
BTC+1.09%
$AR Breaking out—can the bulls push toward $4.30?
$AR Up more than 10%, with strong buying momentum! The price just touched $4.038, and I’m watching to see if it can break above $4.05 decisively. If it clears this level, the next leg up could be worth looking forward to. Long entry: $3.98–$4.04 Take-profit 1: $4.10 Take-profit 2: $4.20 Take-profit 3: $4.30 Stop-loss: $3.88 As long as $3.90 holds, I remain bullish; but I won’t chase the price before confirmation. Please manage your risk. $AR holders, are we heading for $4.30?
post-image
$ZAMA Bottom line: Short-term bullish, but this is an opportunity to confirm a pullback within a bullish moving-average alignment, not to chase the price higher. Using a repeatable method, first check the moving-average structure, then momentum, and finally use Bollinger Bands to gauge positioning.
Moving averages are the framework for judging whether a trend is healthy. Currently, MA5=0.076386 has crossed above and is holding above MA20=0.0751855, with short- and medium-term moving averages in a bullish alignment. This means the average cost over the last 5 candlesticks is higher than over th
post-image
NIL-7.87%
I thought everyone was just like me
Turns out we’re completely different
Everyone has long been quietly making a killing with Codex and lying back to enjoy the wins
post-image
CODEX-6.93%
$BTC
82k keeps grinding against the 81890 lifeline. Bulls have retreated nearly 4 points in four days, yet the price stubbornly refuses to drop.🤣 Everyone who was going to run has already run; only the hardheaded ones are left. As long as 81890 holds, I’m leaning bullish. If the bears keep pushing lower, they’re just digging their own hole.👀
post-image
BTC+1.02%
Greed is heating up—can $APT ’s catch-up rally still be chased? My answer: yes, but wait for a pullback; don’t chase highs.
The Fear and Greed Index is at 63, putting the market in greed territory, though not at an extreme, which indicates risk appetite is still expanding. After BTC steadied the broader market, capital began rotating into higher-beta assets. $APT , up 10.90% over 24 hours with a trading volume of 11.6M USDT, is a beneficiary of this sector rotation. Technically, MA5=0.8562 has crossed above MA20=0.8334, confirming a bullish alignment; the MACD histogram at +0.002917 remains po
post-image
APT+11.41%
BTC+1.02%
DOGE+2.50%
ENA+9.63%
AI and semiconductor stocks shed over $1 trillion in a week—is this sell-off really because they rose too much, or is the AI rally starting to change?
As of October 15, the world’s 20 largest AI and semiconductor companies by market capitalization collectively shed more than $1 trillion over the four trading days this week. The Philadelphia Semiconductor Index has fallen about 12% from its early-October high, declining for seven consecutive trading days. Nvidia fell about 5% over two days, with its market cap shrinking by about $291 billion for the week
This sell-off was mainly driven by three
post-image
NVDA-1.92%
CRWV+5.95%
SK Hynix+0.79%
SKHY-0.94%
TSM-1.82%
$XAUUSD I posted the day before yesterday about buying at the lows. Wait for 4250 and manage your position, guys. Holding for the long term is far more profitable than watching the charts and scalping every day
post-image
XAUUSD+0.49%
Load More

Join 40 M users in our growing community

⚡️ Join 40 M users in the crypto craze discussion

💬 Engage with your favorite top creators

👍 See what interests you

Trending Topics

USSeptemberPPIBeatsExpectations

91.35k Views1.9k Discussing

US September PPI came in at 6.3% YoY, well above the 5.3% market expectation, pointing to renewed producer-side inflation pressure. Weekly jobless claims were 199K, broadly in line with forecasts. Could hotter inflation further reduce room for rate cuts, and what does it mean for $BTC, US stocks, and gold?

GateWCTCS9GlobalTradingCompetition

37.87k Views6.45k Discussing

GateBTCAndETHFuturesVolumeRanksTop3

53.8k Views1.6k Discussing

View More