Square
Following
Hot
News
Notifications
Profile
Share your thoughts
placeholder
Article
After weeks of a quiet, gradual erosion, the price of gold appears to have suddenly plunged off a cliff. A look at the charts reveals that the price has retreated to the $3,500 level, marking a weekly decline of approximately 9%—its worst performance in 34 weeks. Moreover, this drop is merely the latest chapter in a massive, roughly 37% meltdown that gold has experienced since reaching a historic peak of over $5,500 in January.

So, why has this "safe haven"—a place we typically turn to during times of chaos—let us down now? The answer lies in a much larger and more ruthless struggle currently
GVZ+2.87%
XAUT+0.30%
PAXG+0.37%
XAU+0.38%
XAUUSD-2.40%
  • 11
  • 3
#CookBacksFurtherRateHikes
The Fed's Hawkish Warning Could Change the Entire Market Outlook: Bitcoin, Tech Stocks and Gold Face a New Challenge

The Federal Reserve's inflation battle is entering another critical phase, and the latest comments from Governor Lisa Cook have introduced a fresh source of uncertainty across global financial markets.

On November 20, Cook questioned whether September's 25-basis-point rate increase would be sufficient to bring inflation under control. Her warning was particularly important because she highlighted the potential consequences of delaying further action
post-image
BTC-0.65%
MU-13.88%
ANT-8.68%
  • 3
  • 1
Trenches
IDOL
I
bade
b
IDOL
0x3b...ab07
Market Cap
$.
Change
.
24h Vol
$.
Holders
.
PIEVERSE
P
bade
b
PIEVERSE
0x0e...25a9
Market Cap
$.
Change
.
24h Vol
$.
Holders
.
FIONA
F
bade
b
FIONA
B34n...pump
Market Cap
$.
Change
.
24h Vol
$.
Holders
.
Singularity
S
bade
b
Singularity
7R4M...pump
Market Cap
$.
Change
.
24h Vol
$
Holders
.
CLAUDIA
C
bade
b
CLAUDIA
2j5S...W2ZM
Market Cap
$.
Change
.
24h Vol
$.
Holders
.
$NAORIS Up 15% in a day, touching a high of 0.036—is the “breakout pattern confirmed”?
There’s a widely circulated claim: once the price clears the previous high and closes green on heavy volume, the pattern is confirmed and it’ll keep moving up. Sounds convincing, but doesn’t hold up in practice. Today’s 24-hour trading volume was 13.8M. In a 15% green candle, that volume shows there was turnover, but also that selling pressure was absorbed—and being absorbed doesn’t mean it’s all been cleared. Looking at the move from 0.0296 to 0.036, the price has already covered a lot of ground. Structural
NAORIS+0.66%
  • 1
Nvidia just lost nearly $900 BILLION in one week.
And Nvidia-backed funding rounds account for 27.2% of global venture deal value this year.
It sells AI chips, funds the companies buying them, and owns stakes in their success. That's a dangerous amount of the AI economy tied to one company.
When Nvidia cracks, how much of the AI boom cracks with it?
NVDA-13.84%
NBA & NFL best week I can remember.
Is this day and age I should start charging $999.98 a month now right?
post-image
Btc market prediction update
live-cover
LIVE1,510
BTC-0.67%
ETH-1.26%
SOL-0.77%
XRP-1.15%
$IDOL A coin has reached the top area, and I've opened a short position. 🎯 Please set the take-profit below 0.035. Welcome to the short camp! 📉🔥
post-image
IDOL-6.71%
  • 1
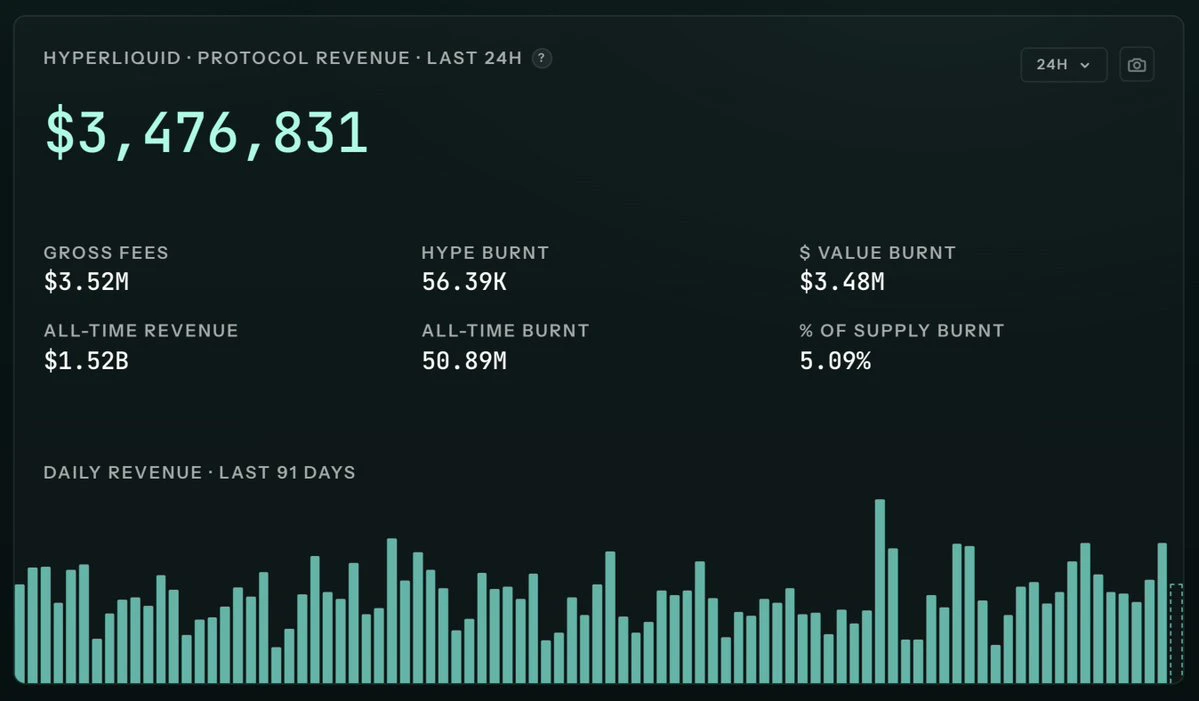
$HYPE is down 40%, but hyperliquid still makes $3M+ a day in revenue
what is zcash doing these days
post-image
HYPE+0.24%
ZEC+1.16%
Strategy stated that all 850,849 BTC in its treasury are unencumbered, meaning none are pledged as collateral for loans as Bitcoin slid toward $55,000 amid heavy market selling.
The 850,849 BTC was acquired at an average price of $75,452 (approximately $64.20 billion total cost), per Strategy's mid-November 2026 SEC filing disclosures.
MSTR shares have also faced pressure alongside Bitcoin and spot ETF outflows, with many analysts pointing to dilution from at-the-market equity issuance used to fund preferred stock (STRC) repurchases and dividends.
‍#ShareWeekly #BTC #BTCBreaksBelow60K
post-image
BTC-0.67%
MSTR-9.49%
STRC-0.90%
🔹 Fear Grips Global Markets as Wall Street Approaches a Critical Point
live-cover
LIVE2,265
BTC-0.67%
healthier than the xpl chart
post-image
XPL-0.60%
#PI News, everyone, any thoughts??
post-image
PI-0.60%
  • 1
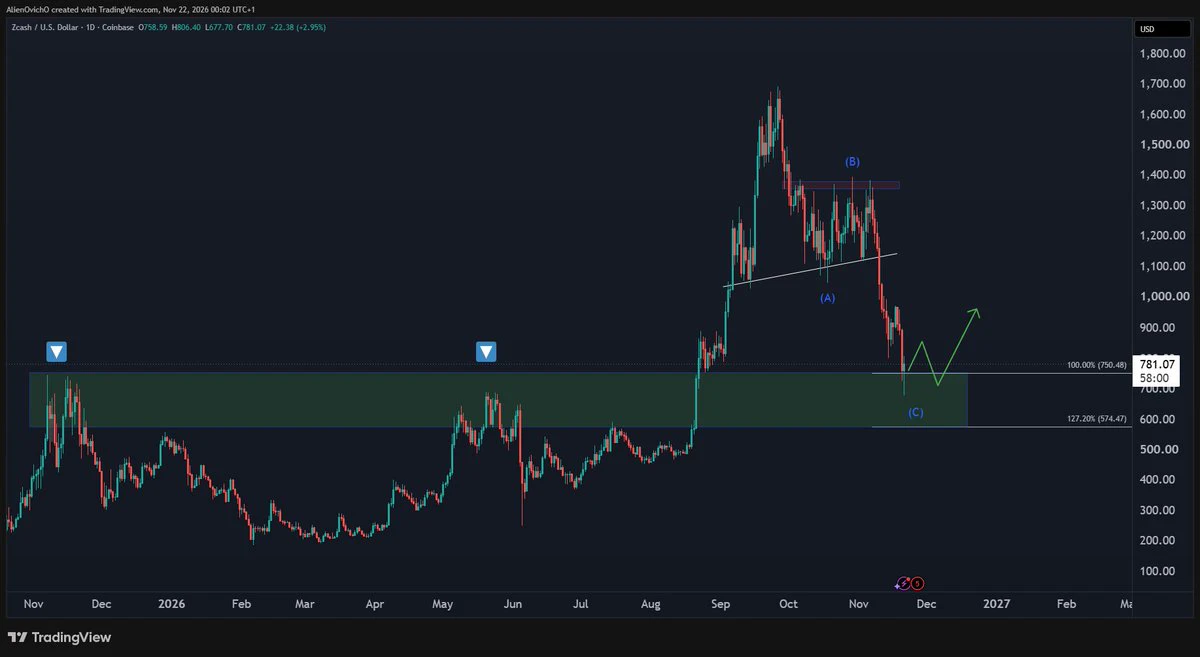
$ZEC is back inside the daily buying zone 🎯
750–575 retests both the 2025 highs and the May 2026 peak, and old resistance is now support.
I expect price to carve a bottom around this area before the 2027 rally.
Accumulating here or waiting lower?
post-image
ZEC+1.16%
JUST IN: 🇮🇷 🇺🇸 Iran says it will reopen the Strait of Hormuz if President Trump agrees to make a deal.
Telegram is literally destroying all third-party gift sales platforms!

Here's what they do:
> integrate an internal Telegram wallet for purchases and sales;
> reduce the trading fee from 10% to only 2%.
Complete domination by Telegram.
post-image
$SUI is strong on the 1-hour timeframe and weak on the 4-hour timeframe; direction remains unresolved
$SUI is currently trading at 0.6455 USDT, down 1.53% over 24 hours, with a range of 0.5882–0.6597. The 1-hour trend is strong while the 4-hour trend is weak. Should we focus on the 1-hour timeframe or wait for 4-hour confirmation?
My view: I’d rather see this as a direction that remains unconfirmed than rush to label it a rebound or a pullback.
The 1-hour support and resistance levels are 0.5882 and 0.6597, respectively, while the corresponding 4-hour boundaries are 0.5882 and 0.7392. The 1-h
post-image
SUI-1.05%
$NVDA ‌
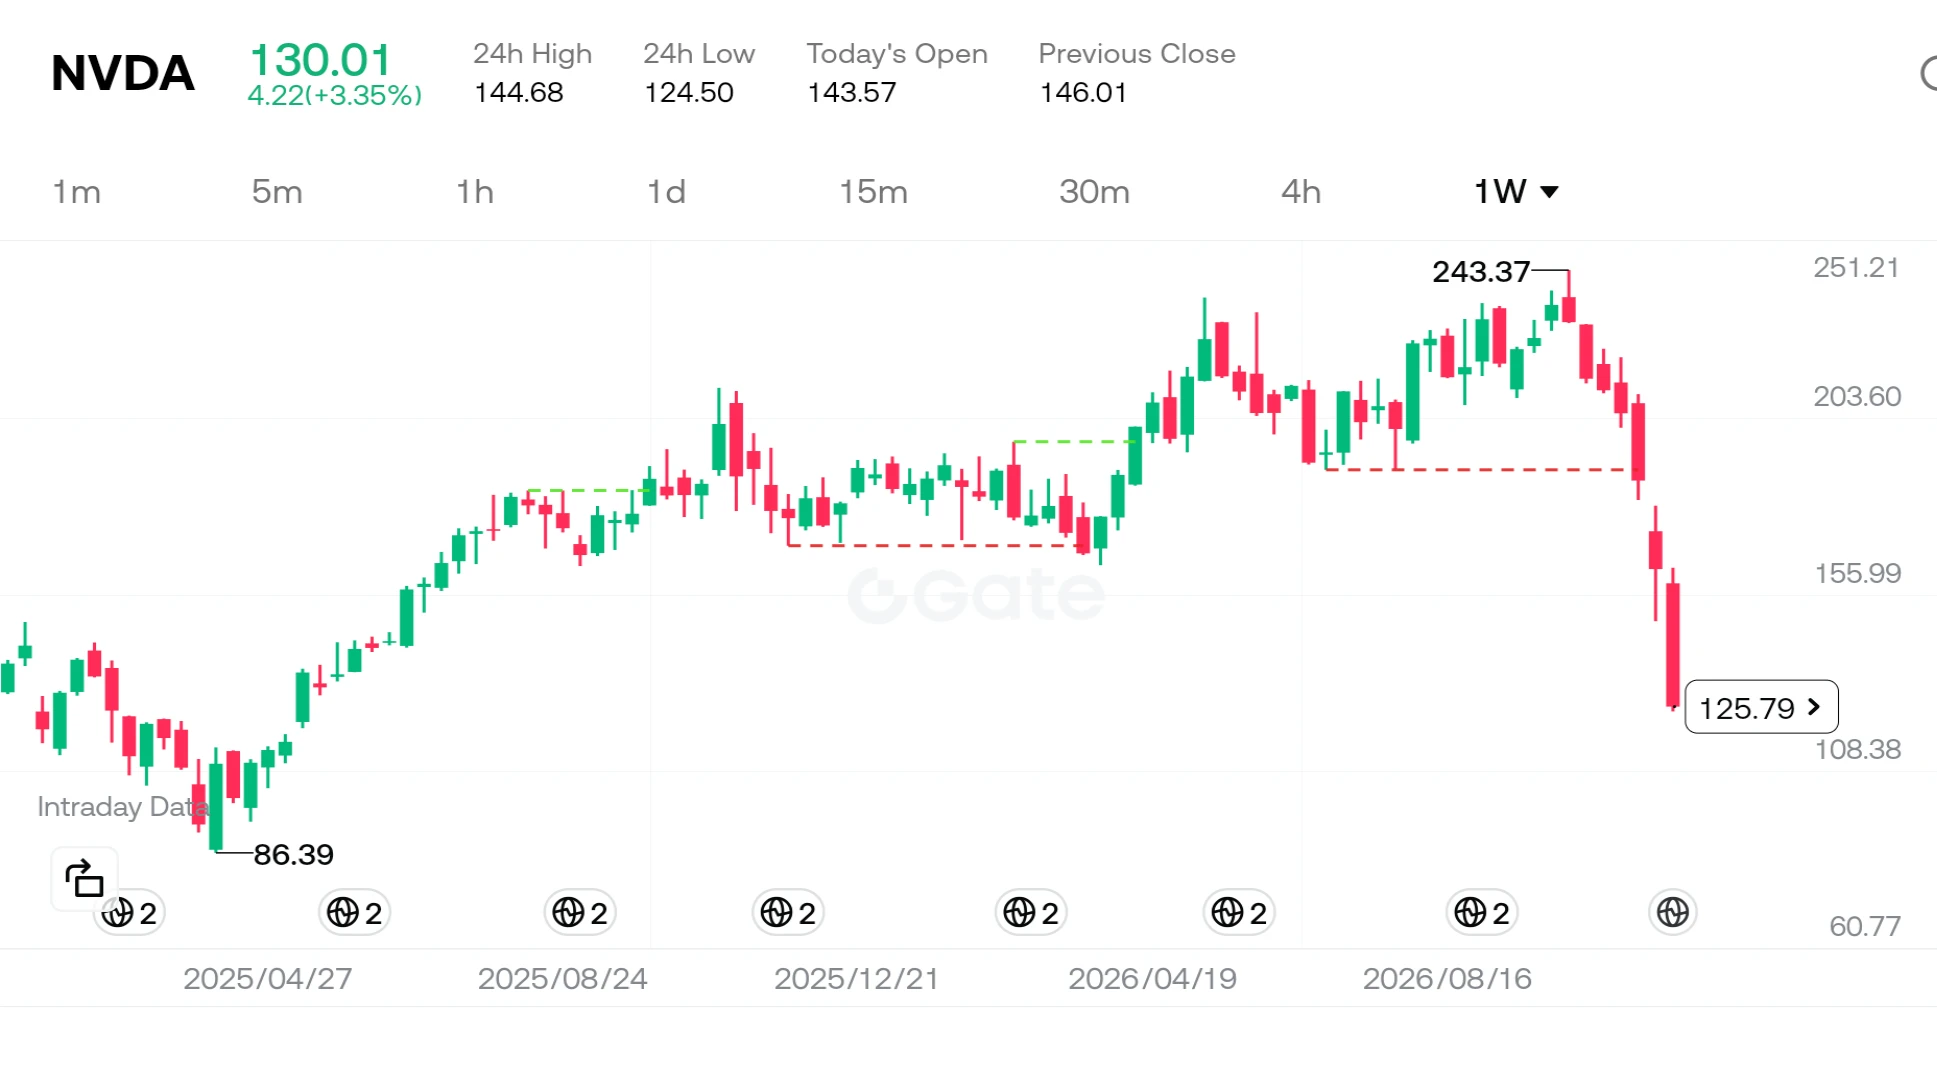
Nvidia has been losing ground for seven consecutive weeks—a trend not seen since 2008. The stock plummeted 14% last Friday alone, bringing its total decline over this seven-week period to approximately 46%. As clearly illustrated on the chart, the price has retreated from a peak of $243 to the $125 range. So, what is the story behind how this once-most-valuable company reached this point?

In reality, this is not merely a stock market correction; it is the result of three major, intersecting storms hitting the same vessel.

First, let’s look at the company’s internal dynamics. Uncerta
post-image
NVDA-13.84%
  • 7
  • 3
Log off.
Touch literally anything that isn’t a screen.
Happy Sunday ☀️
post-image
  • 1
Day four
ETH's monthly Bollinger lower band is already near 1,000! It's currently around 1,600; if it really heads lower? That's not impossible! That's a little scary!
post-image
ETH-1.26%
$XCU ‌
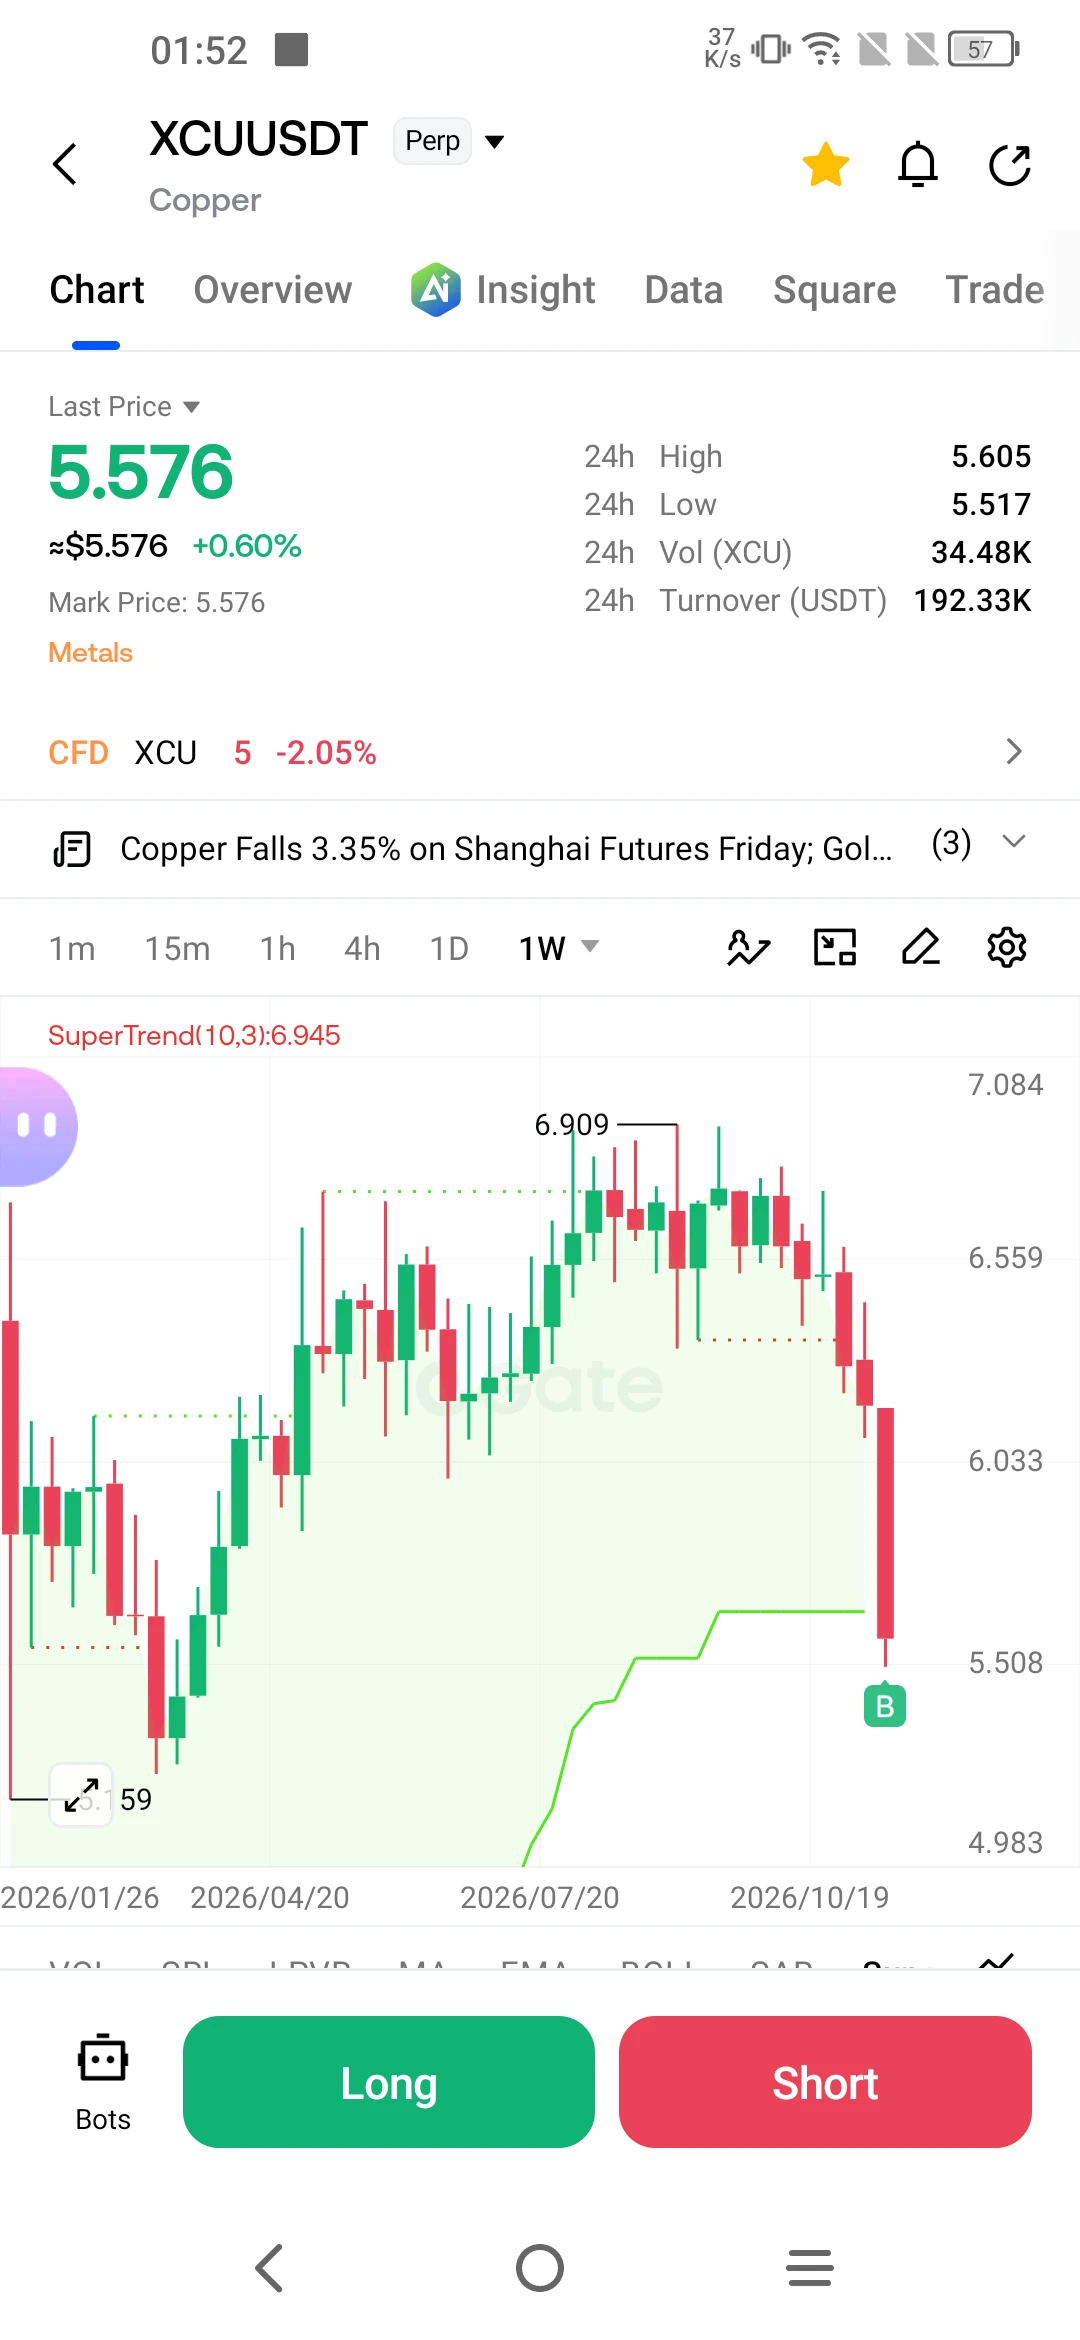
The copper market is being shaken with a speed and intensity not seen in a long time. Futures have shed more than 9% this week, marking their worst weekly performance since 2026. As clearly illustrated on the chart, prices have retreated from a peak of $6,909 to the $5,500 range. Having hit record highs in September—driven by expectations of massive demand for cabling for artificial intelligence (AI) data centers—prices are now under severe pressure as that same narrative unravels.

So, what lies behind this sudden collapse? In essence, the market is repricing the AI story, with overly
post-image
XCU+0.20%
  • 4
  • 1
Load More

Join 40 M users in our growing community

⚡️ Join 40 M users in the crypto craze discussion

💬 Engage with your favorite top creators

👍 See what interests you

Trending Topics

BTCBreaksBelow60K

2.1M Views30K Discussing

BTC fell below $60,000 on November 20 for the first time since July, alongside a tech stock selloff and broader pressure on risk assets. Will $60K become resistance, or can BTC quickly reclaim it? What price or volume signals would convince you that selling pressure is easing?

GateDirectIPOPhase3ANTAllocates92100Shares

797.2K Views4.9K Discussing

NvidiaDropsNearly14Percent

333.9K Views7.6K Discussing
View More