Square
Following
Hot
News
Notifications
Profile
Share your thoughts
placeholder
Article
Crypto market update anylsis overall
live-cover
LIVE1,287
BTC-0.67%
ETH-1.26%
SOL-0.77%
ZEC+1.16%
XRP-1.15%
Bitcoin ETF investors can hedge during Thanksgiving's 40+ hour trading gap
Arca-listed spot Bitcoin ETFs will miss Thursday’s core session. Eligible CME futures can still trade, with Thursday trades submitted for clearing due to clear Friday.
Quick Take
⚠️ Personal market analysis only. NFA — manage risk and DYOR.
Educational content, not investment advice or a recommendation to buy, sell, deposit, or withdraw any asset. No paid promotion or referral/affiliate links.
post-image
BTC-5.94%
Trenches
IDOL
I
bade
b
IDOL
0x3b...ab07
Market Cap
$.
Change
.
24h Vol
$.
Holders
.
PIEVERSE
P
bade
b
PIEVERSE
0x0e...25a9
Market Cap
$.
Change
.
24h Vol
$.
Holders
.
FIONA
F
bade
b
FIONA
B34n...pump
Market Cap
$.
Change
.
24h Vol
$.
Holders
.
Singularity
S
bade
b
Singularity
7R4M...pump
Market Cap
$.
Change
.
24h Vol
$.
Holders
.
CLAUDIA
C
bade
b
CLAUDIA
2j5S...W2ZM
Market Cap
$.
Change
.
24h Vol
$.
Holders
.
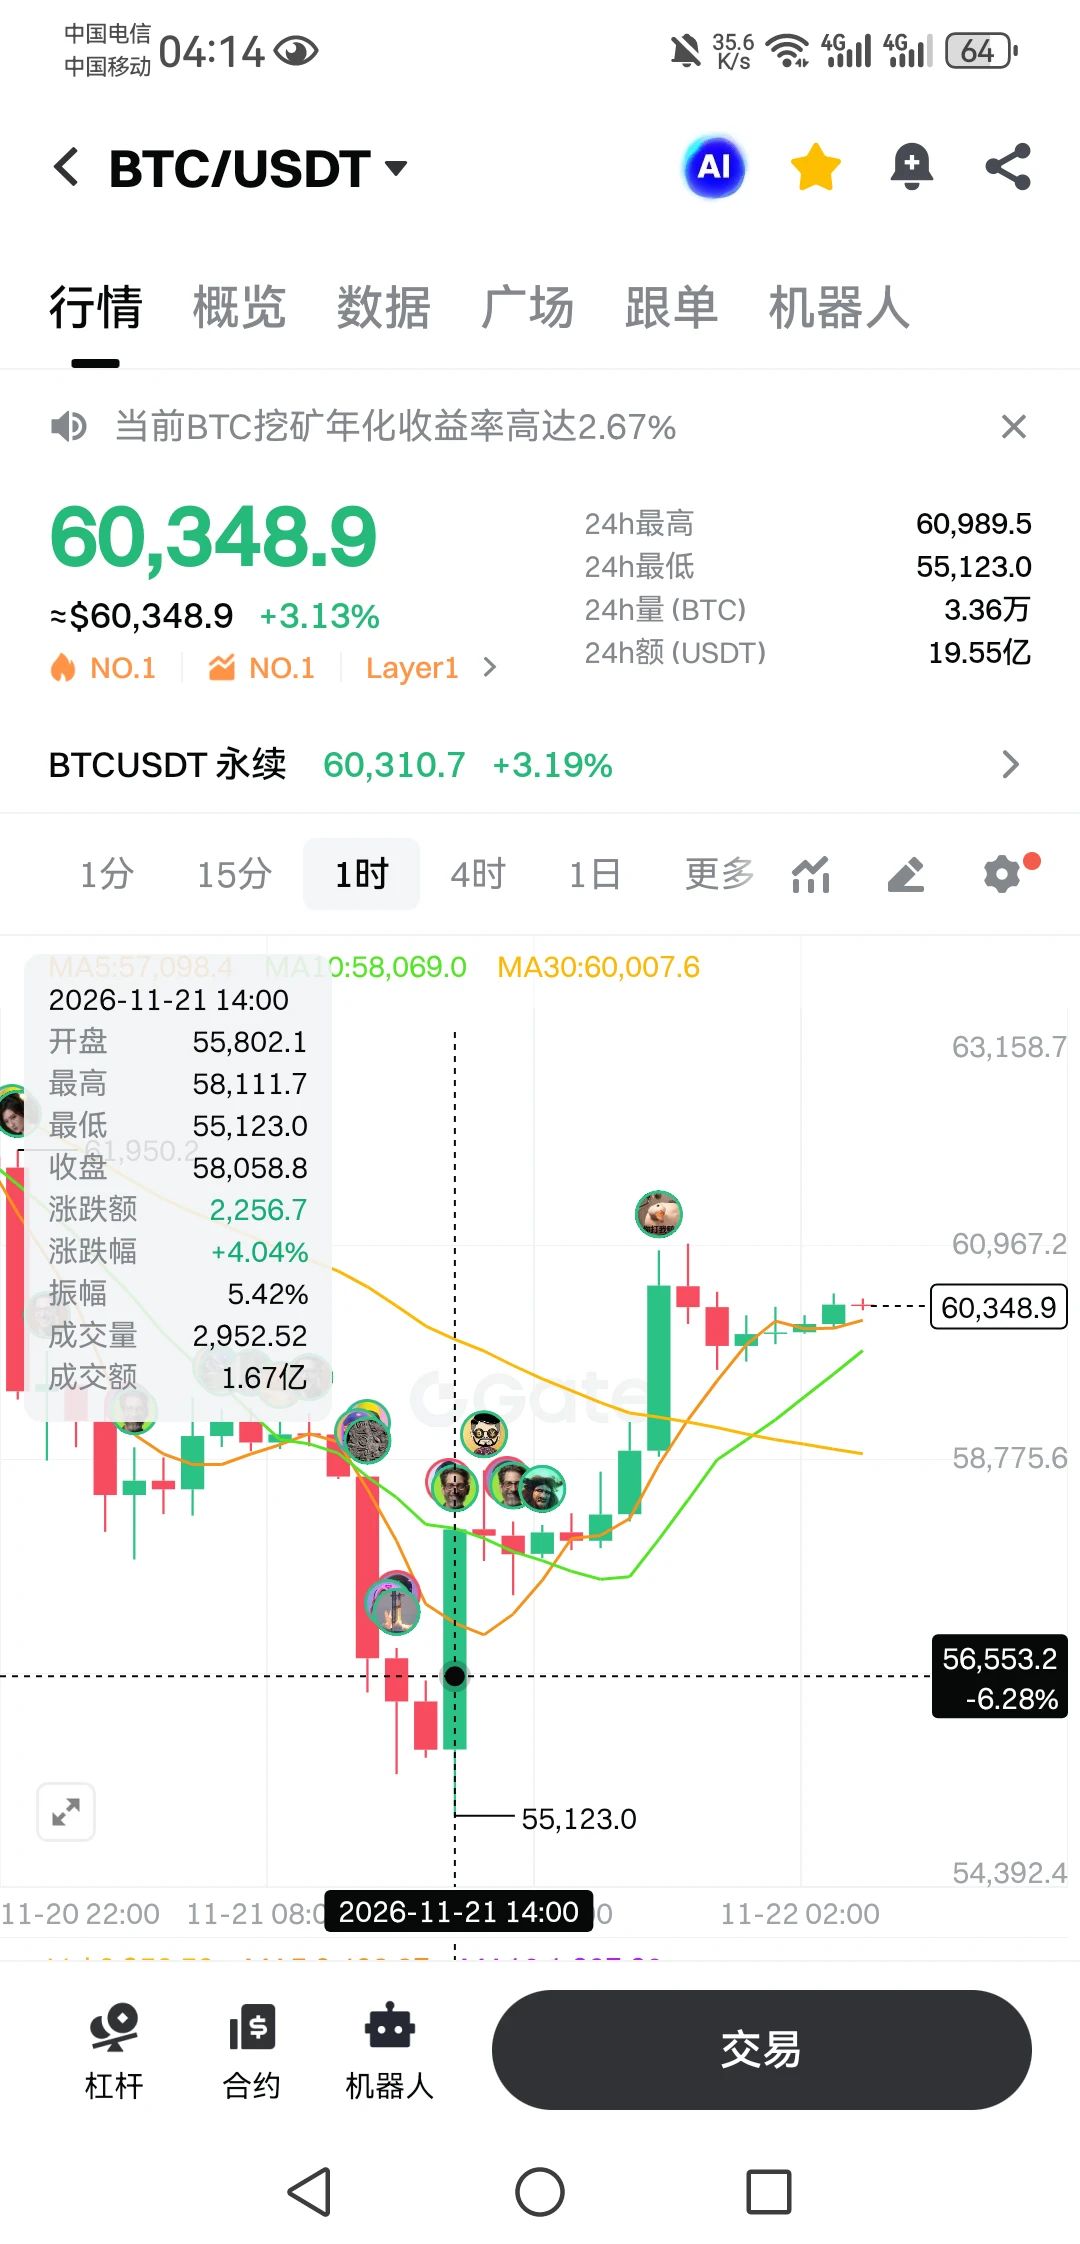
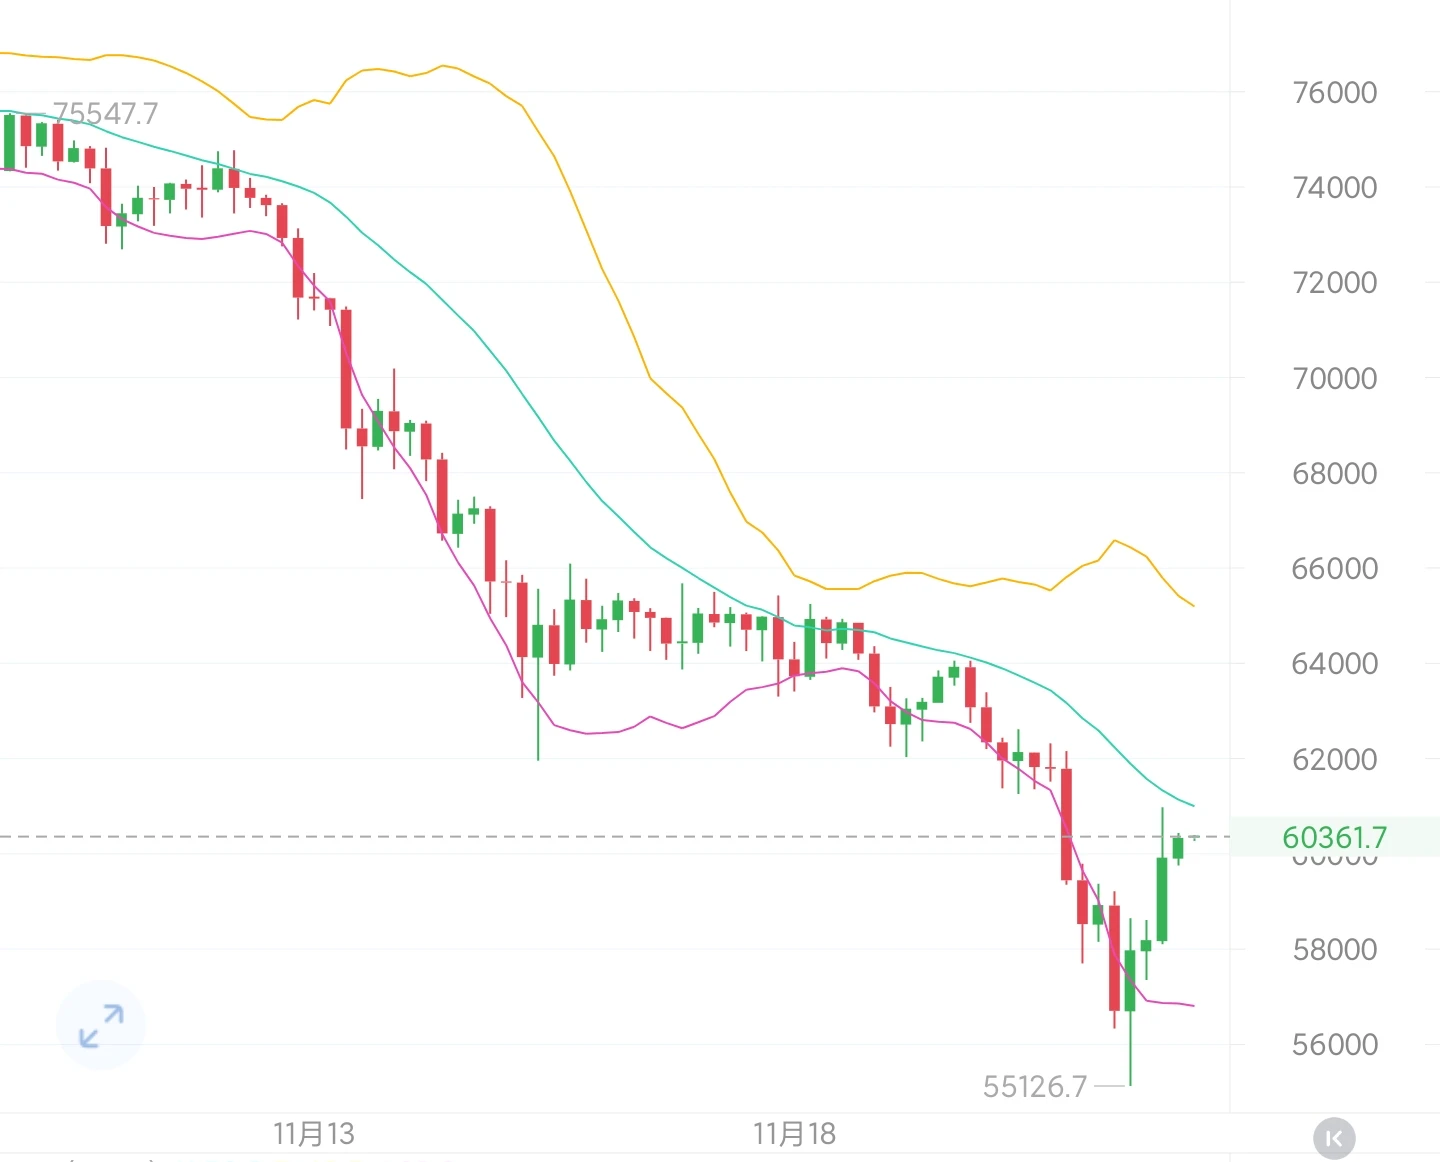
The Fear & Greed Index plunged to 12, with extreme fear prevailing for eight straight days, yet BTC climbed back from $55,134. Given the current setup, should we turn greedy or keep waiting for lower entry prices? The late-night market action doesn’t lie; the answer is all written in the direction of the candlesticks.
$BTC Today traced a deep V within the $55,134–$62,181 range. $60,000 is the dividing line between bulls and bears—hold it, and the next target is around $62,000; lose it and fall back, and we’ll need to keep a close eye on the $55,134 low again. If it breaks below the previous l
post-image
BTC-0.67%
DOGE-0.22%
NEAR+1.17%
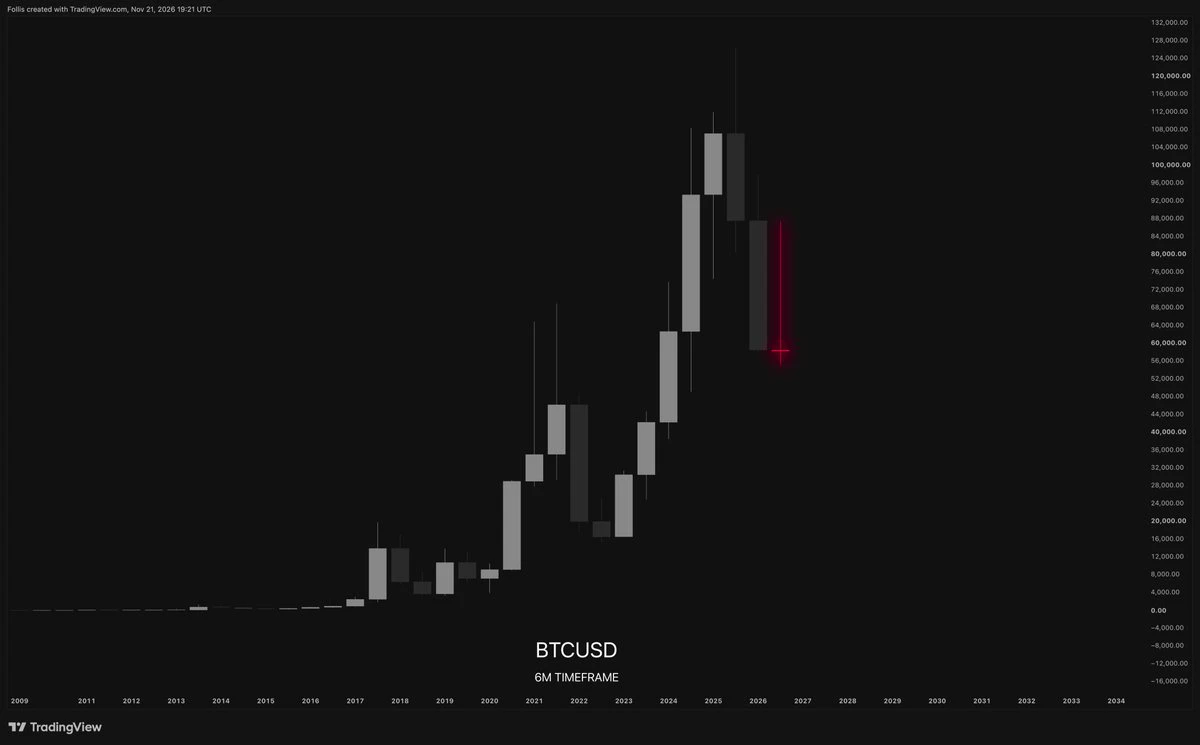
Market thoughts for the coming years
post-image
6M candle got me feeling a certain type of way
$BTC
post-image
BTC-0.67%
$USELESS Entered USELESS at 0.07001; wick low at 0.0695, 2% from liquidation, with only 0.35 body lengths to spare. Same gesture as BTC at 55,806 (300 points from the wick tip) and ZEC at 696 (nine bucks above 687): no waiting for it to hold, no waiting for confirmation—just pressing the button in the last mouthful of blood.

Seventeen trades ago, I thought I was making money because I could read the market. Now I understand: I make money because I’m willing to press the button during those ten minutes when it feels worst physically. My hand doesn’t shake when I hit sell at the top; it shakes
USELESS-14.66%
BTC-0.65%
ETH-1.23%
On my way back from grocery shopping, I saw that crooked tree by the entrance to the residential complex. A typhoon bent it last year, and property management tied it up with a rope for half a year. Now the rope has loosened, but the tree is still crooked. A tree has its own way of growing; you can’t pull it straight. $IDOL Today, this chart is up 79.33% in 24h, climbing from 0.0213 to 0.0392, with 180.9M in trading volume. I’m not looking at the chart itself, but at how it got there. My rule is to first check whether it has the flaw of being “one-and-done”—if it shoots straight up in a single
IDOL-6.71%
  • 1
  • 1
55123
Yesterday at 2 p.m.
post-image
#BTC跌破6万美元关口 Post a valid post to get some boosts
post-image
BTC-0.67%
Good evening fam! 😎
On that bring again.
Half way done.
post-image
$MMT — LONGEntry: 0.2142TP1: 0.2164TP2: 0.2185Stop: 0.2056The chart is hinting at an early shift higher as demand slowly returns. The market still needs follow-through to turn an early bounce into a real move.
post-image
MMT-2.35%
I use these indicators
- RSI.
- 12/26 or 25 EMA
- OBV
post-image
$SUI Long from 0.646, too early or right on time? I’m leaning long, with a stop at 0.637 and no room for maneuver. - 4-hour price at 0.647, below the EMA50 at 0.712: this is a rebound attempt below the trend, so the stop is important - Stop risk 1.6%, TP3 target return 2.5% · about 1.6R if the full move plays out - BTC is bullish in the short term: BTC is aligned with our direction. Long 0.6460–0.6477 Take profit 0.6529 / 0.6569 / 0.6629 Stop loss 0.6368 Not investment advice; do your own research.
post-image
SUI-1.05%
  • 1
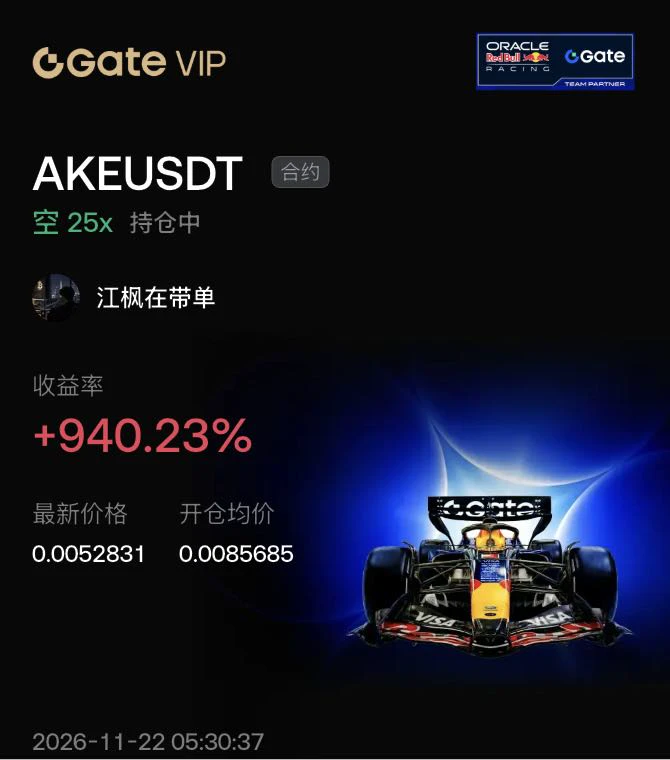
$AKE Unlike other coins, its supply keeps increasing.

Just over 20% of the total supply is circulating. About 2.1 billion tokens are released on the 21st of every month, roughly 10% of the circulating supply. The batch for November 21 has already been released, and another similar-sized batch will come on December 21. This will continue until 2029.

The price is driven by capital, but the number of tokens keeps growing every month. Without a steady influx of new buyers, every unlock is a supply shock.

After this batch was released, the price bounced and then fell, showing that buying demand
post-image
AKE+6.39%
SNDK-0.18%
ETH-1.23%
  • 1
#ShareWeekly market Faces Heavy Selling Pressure as Bitcoin Rebounds After a Two-Year Low

The cryptocurrency market is experiencing severe volatility following a massive sell-off across global financial markets. Bitcoin (BTC) plunged to approximately $55,251, its lowest level in two years, before recovering above $60,000. The decline reflects growing investor concerns about rising interest rates, weaker technology stocks and reduced institutional demand.

Ethereum (ETH), XRP, Solana (SOL), BNB and other major altcoins also faced significant selling pressure. The market downturn triggered bil
BTC-0.65%
ETH-1.23%
XRP-1.15%
SOL-0.77%
BNB-0.76%
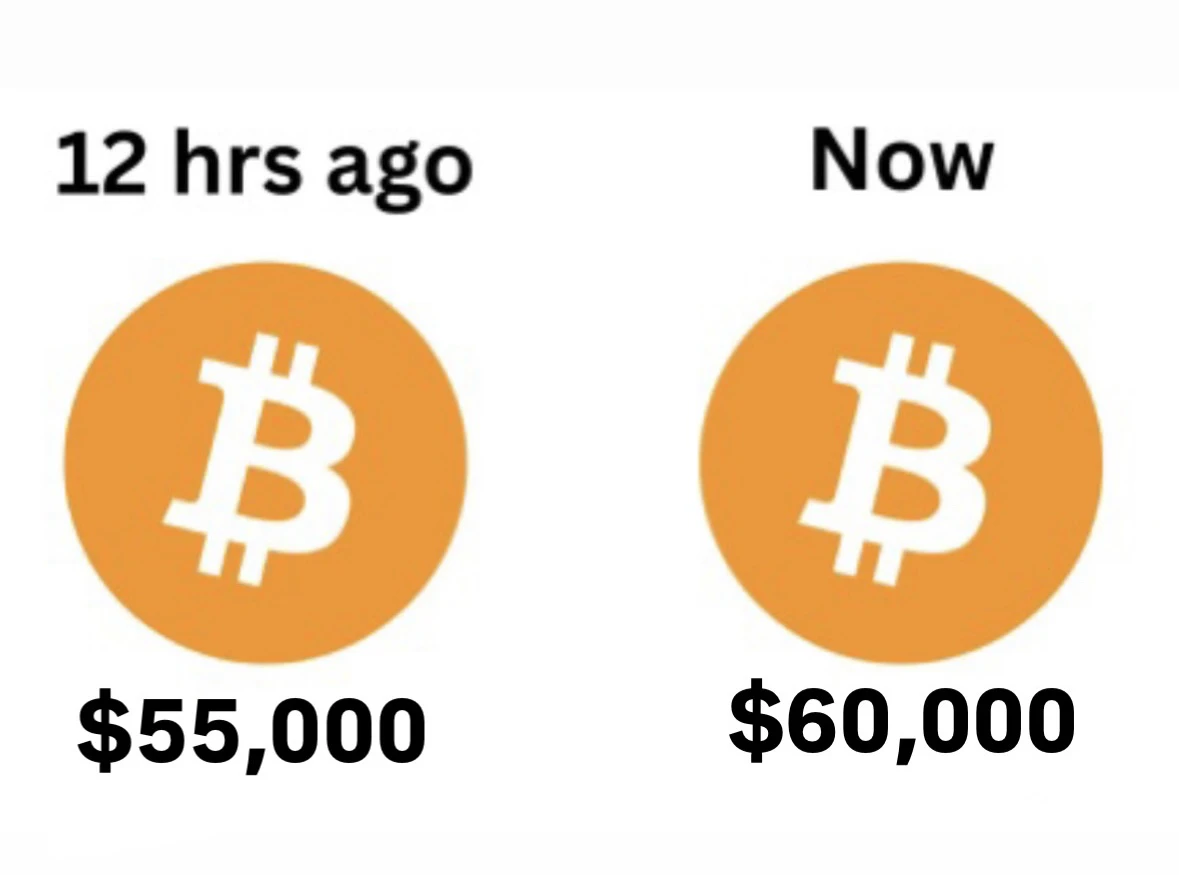
From $55,000 to $60,000
Was that the bottom?
post-image
Only 6 strong signals this round: MMT, AKE, VVV; 4 longs and 2 shorts. Check volume and structure before acting. Last round: 4 wins, 2 losses, +19.2%; SUI and PIEVERSE are in the red. Currently holding 13 positions, averaging +0.7%; waiting for confirmation. 🎯 Last round's returns: SUI entry $0.6185 → exit $0.6440, 5.0x leverage, gained +11.6%; PIEVERSE entry $2.9670 → exit $3.2877, 5.0x leverage, gained +32.6%━━━ Market View ━━━BTC 60,284 +3.0%, bullish signals have a slight edge; negative funding rate data is temporarily unavailable, and capital is still choosing a direction. Don't chase ol
post-image
MMT-3.20%
AKE+6.39%
VVV+0.37%
SUI-1.01%
PIEVERSE+0.50%
BTC is currently around 60,300, up 1.48% in a modest 24-hour rebound, ending several days of steep declines and bringing a short-term technical recovery. The daily chart remains in a weak, choppy trend, with losses exceeding 6% so far this week; overall, the market is in a bearish correction structure. Selling pressure is evident on the 4-hour chart, with price staying below the 50- and 200-period moving averages for an extended period, indicating a weak medium-term trend.

The short-term chart has completed an oversold rebound, but trading volume has not meaningfully increased, and the reboun
post-image
BTC-0.65%
NEAR
live-cover
LIVE1,220
NEAR+1.17%
$VELVET bought in again, and it's pumping
VELVET-3.58%
Load More

Join 40 M users in our growing community

⚡️ Join 40 M users in the crypto craze discussion

💬 Engage with your favorite top creators

👍 See what interests you

Trending Topics

BTCBreaksBelow60K

2.1M Views30K Discussing

BTC fell below $60,000 on November 20 for the first time since July, alongside a tech stock selloff and broader pressure on risk assets. Will $60K become resistance, or can BTC quickly reclaim it? What price or volume signals would convince you that selling pressure is easing?

GateDirectIPOPhase3ANTAllocates92100Shares

791.6K Views4.9K Discussing

NvidiaDropsNearly14Percent

331.6K Views7.6K Discussing

View More