Asiftahsin
vip
Age 2.4 Year
Market Analyst
Crypto Market Researcher
Share Crypto Related Market Analysis, Share Crypto Related knowledge for my follower(brother and Sister)
#PostToWinFLK
Hey everyone 👋 Hope you’re doing great!
Today I’m talking about Gate Launchpool’s latest project — Fleek (FLK)! 🚀
💡 What is Gate Launchpool?
Gate Launchpool lets you stake GT, BTC, ETH, USDT, GUSD, or other tokens to earn hourly airdrops of trending new coins.
Low entry, high APR — your gateway to passive crypto income. 💸
🔥 Launchpool Project
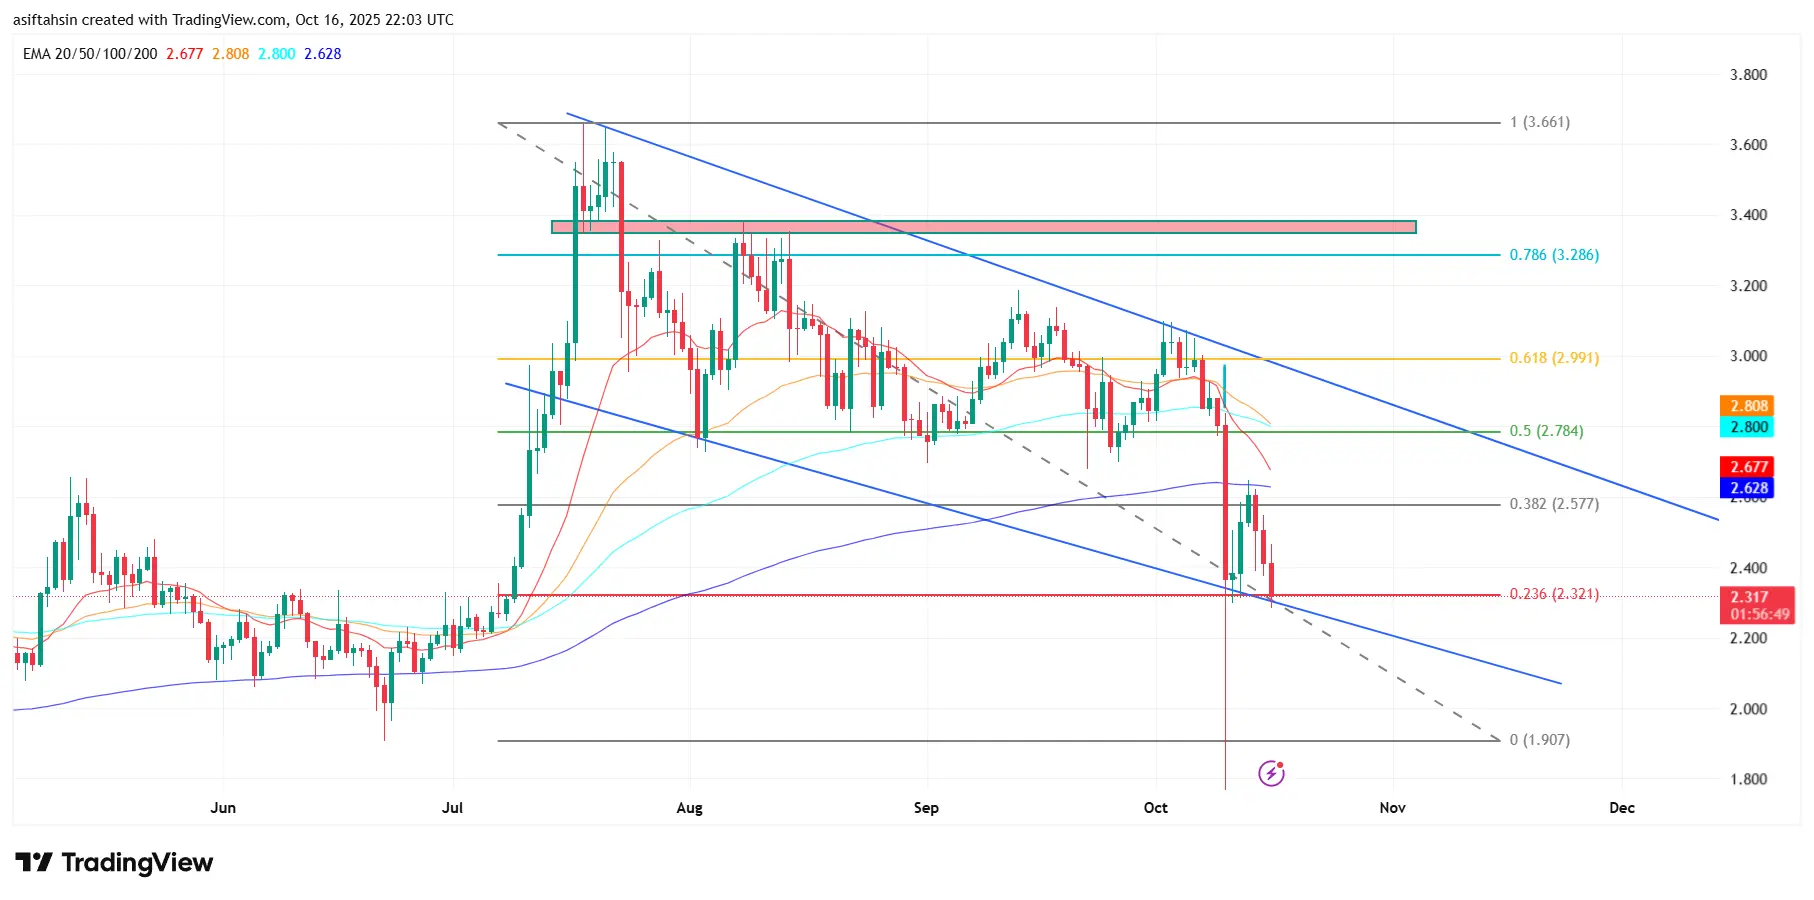
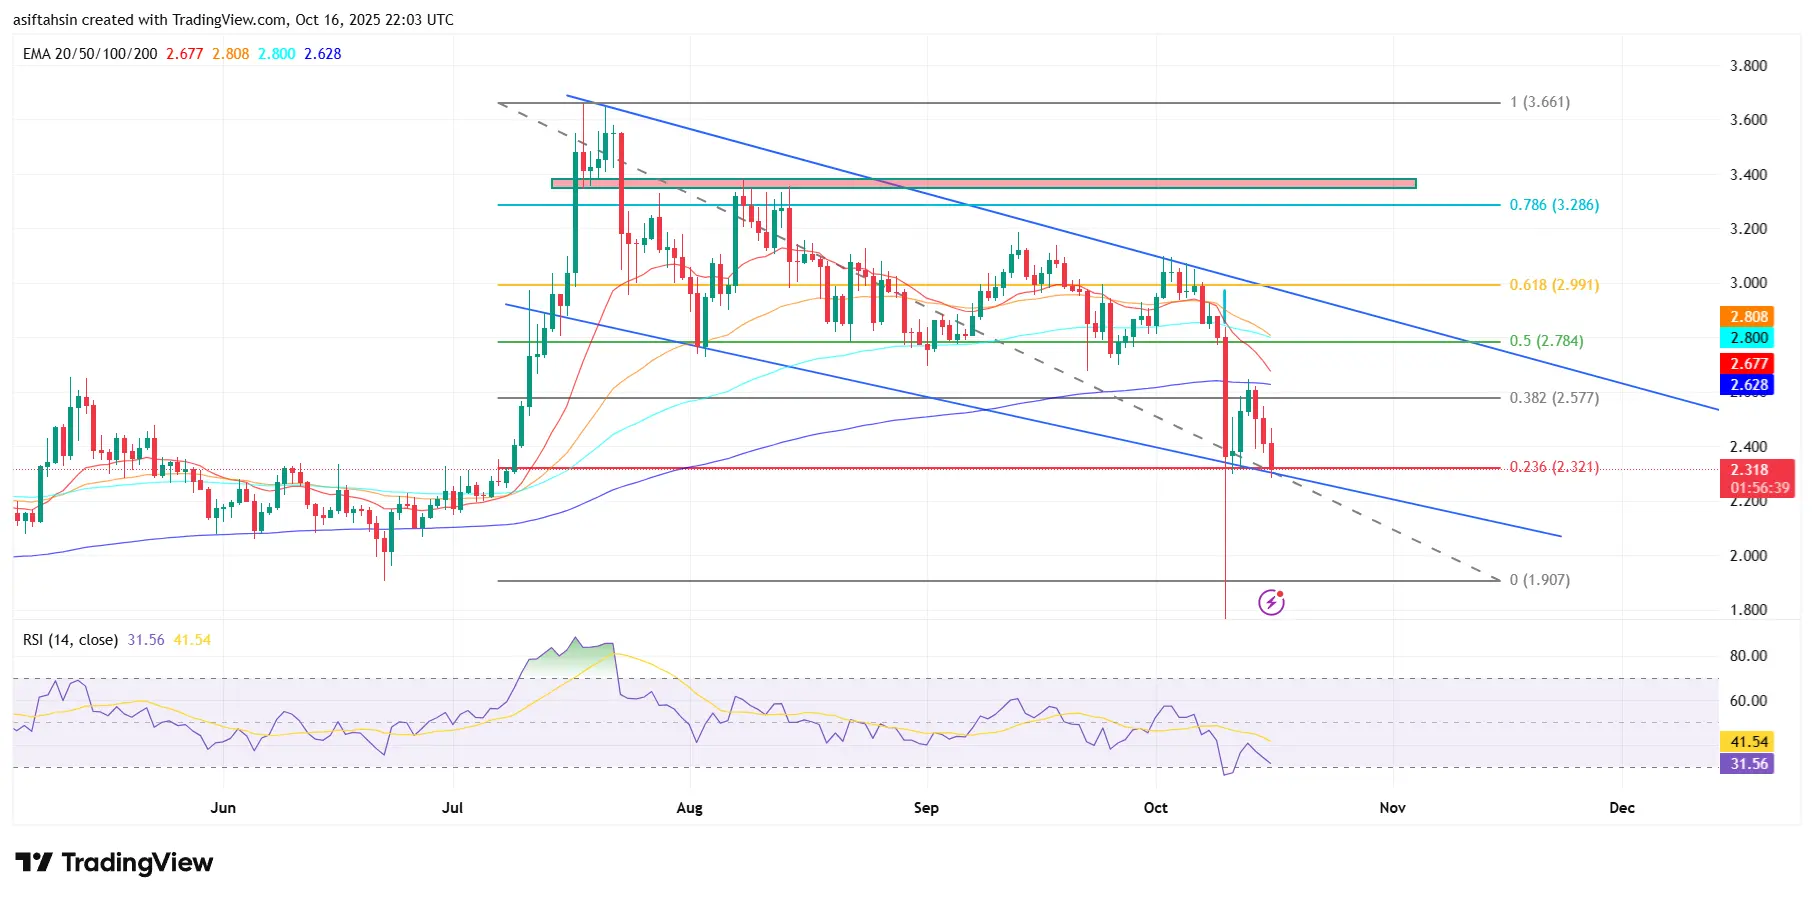
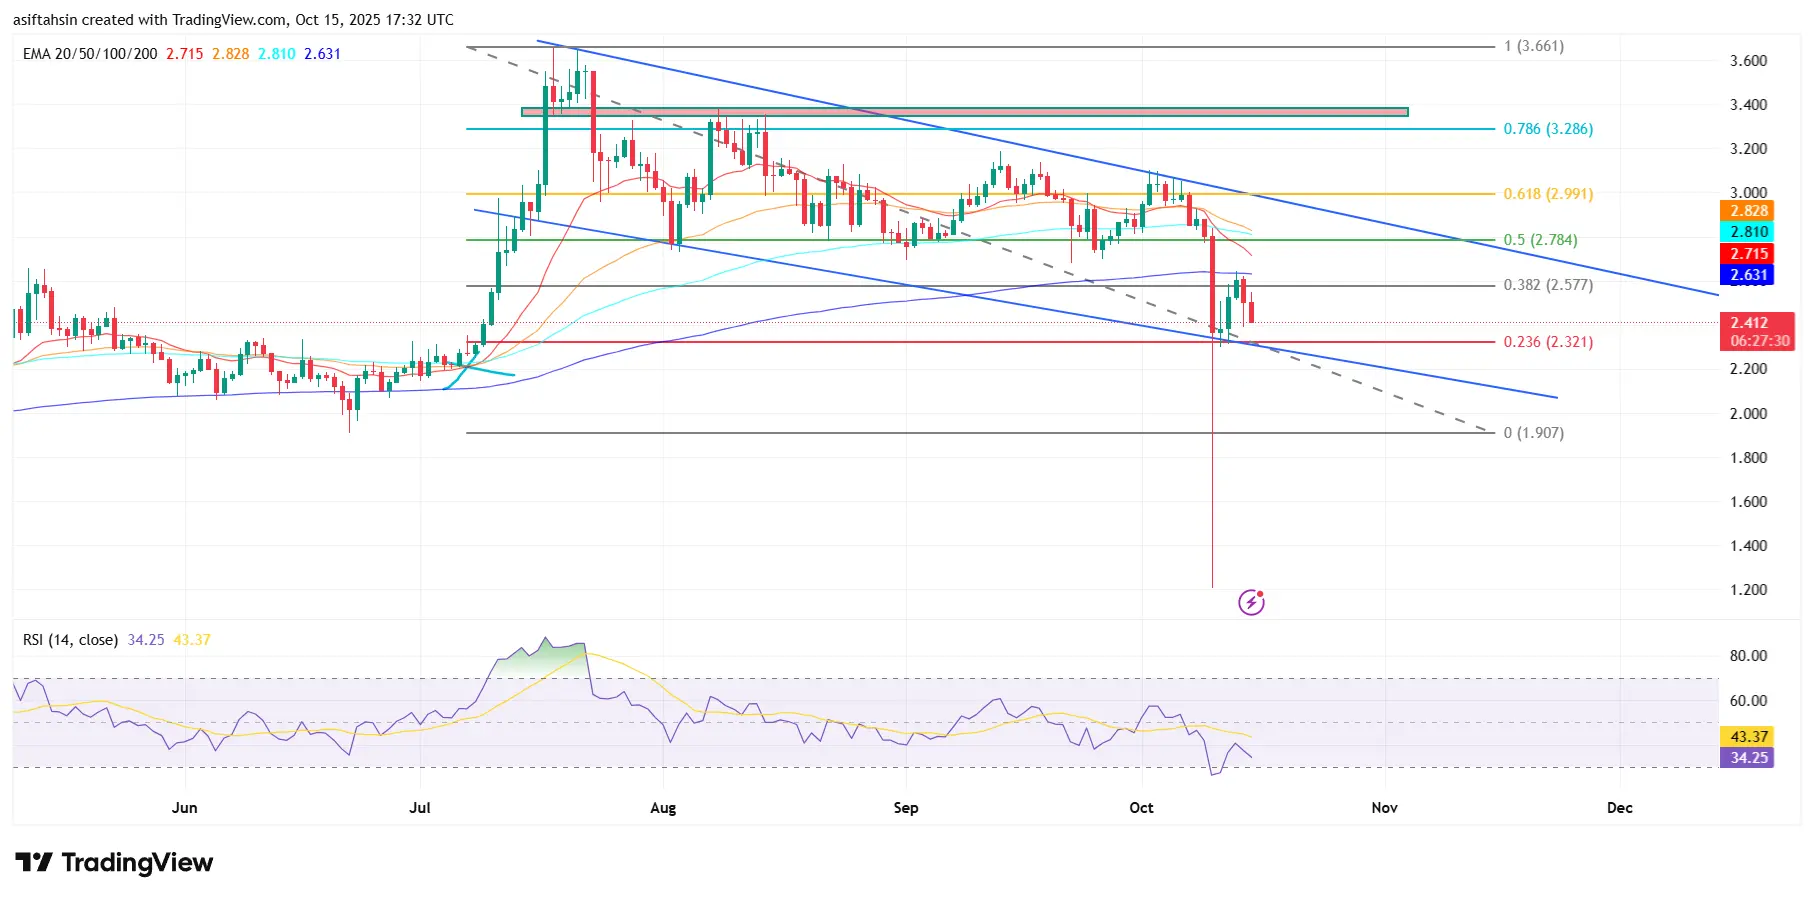
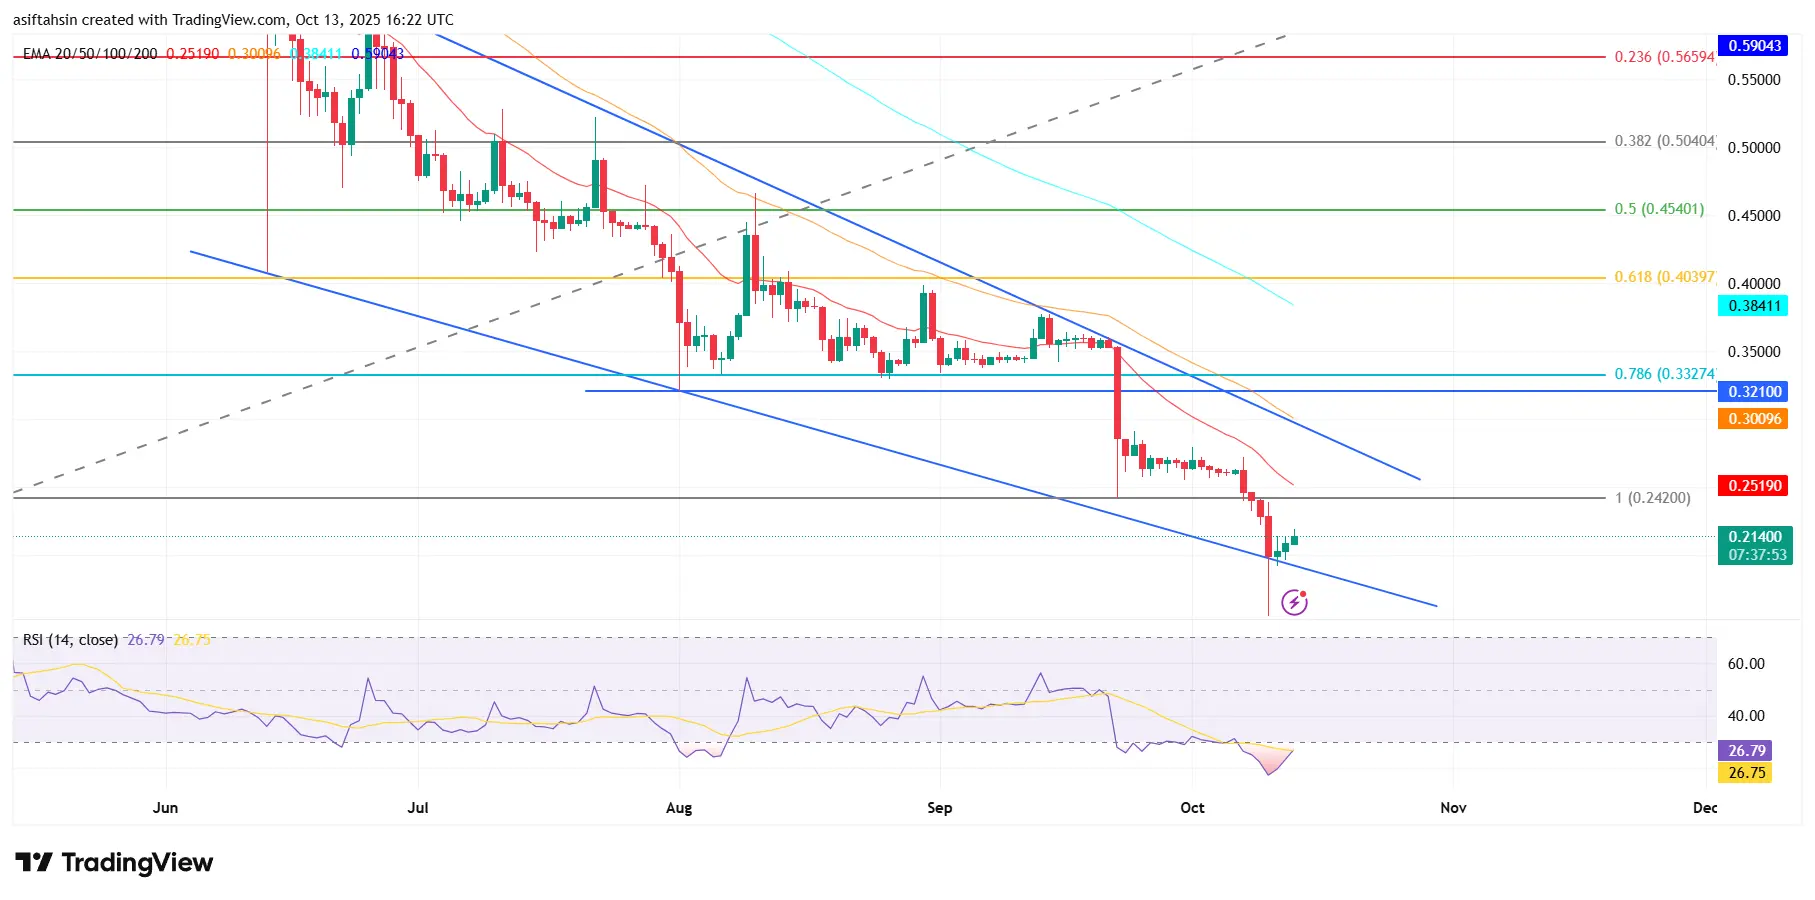
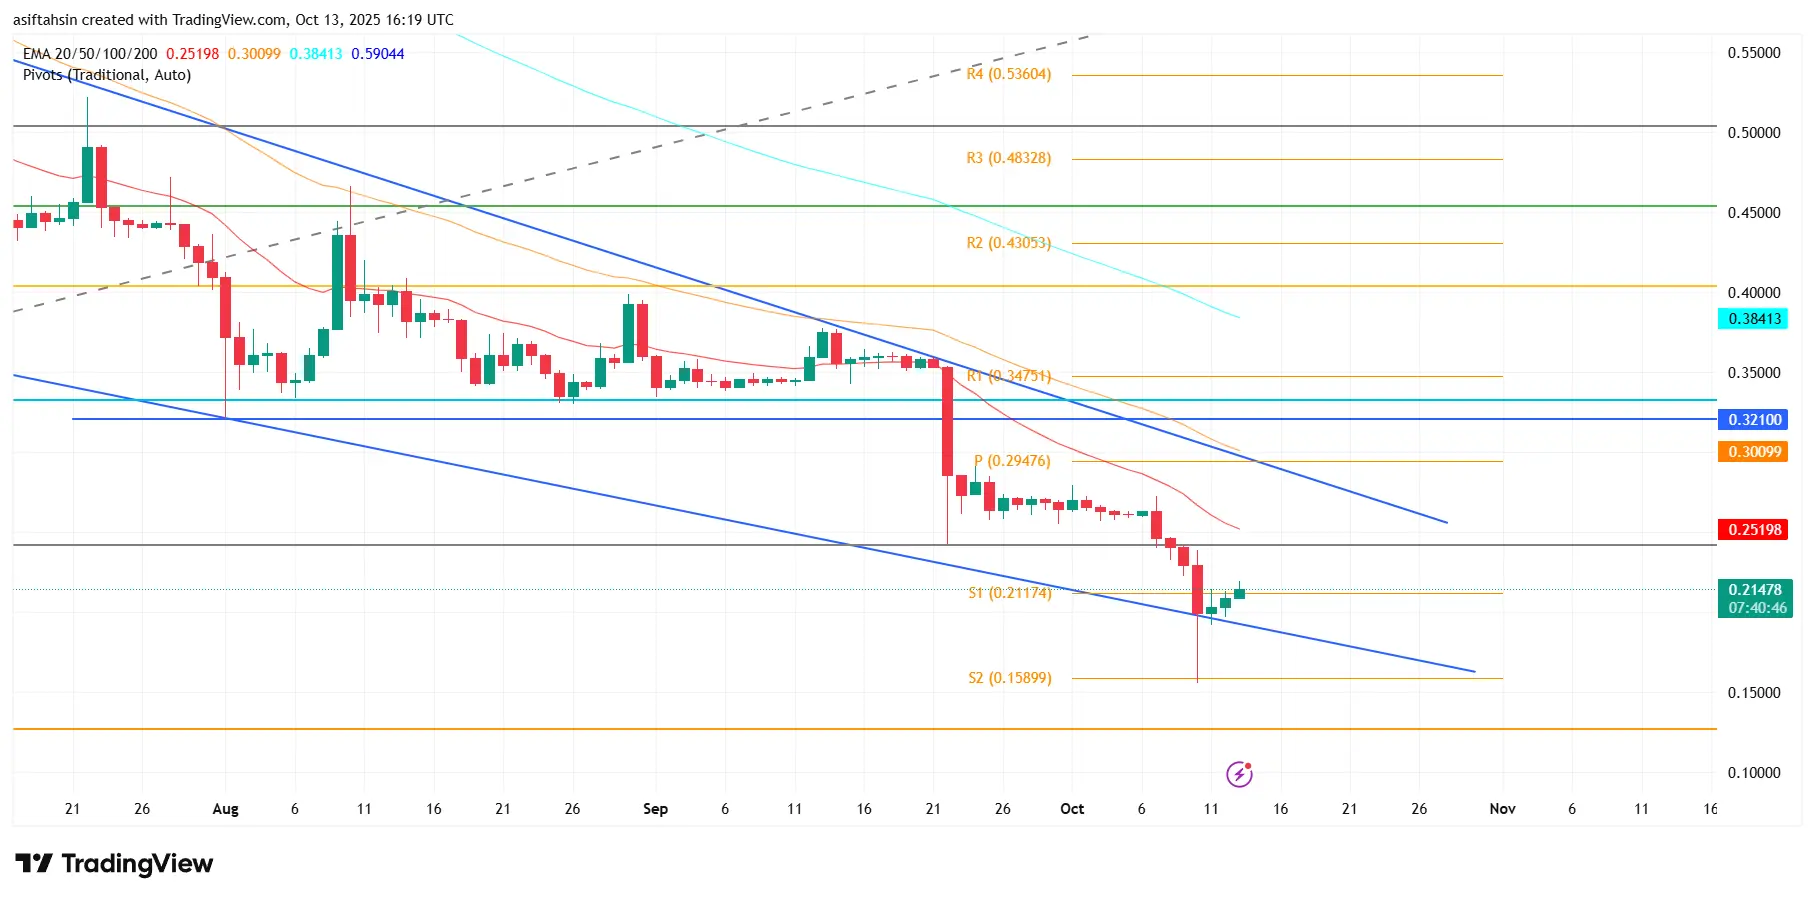
 #331: Fleek (FLK)
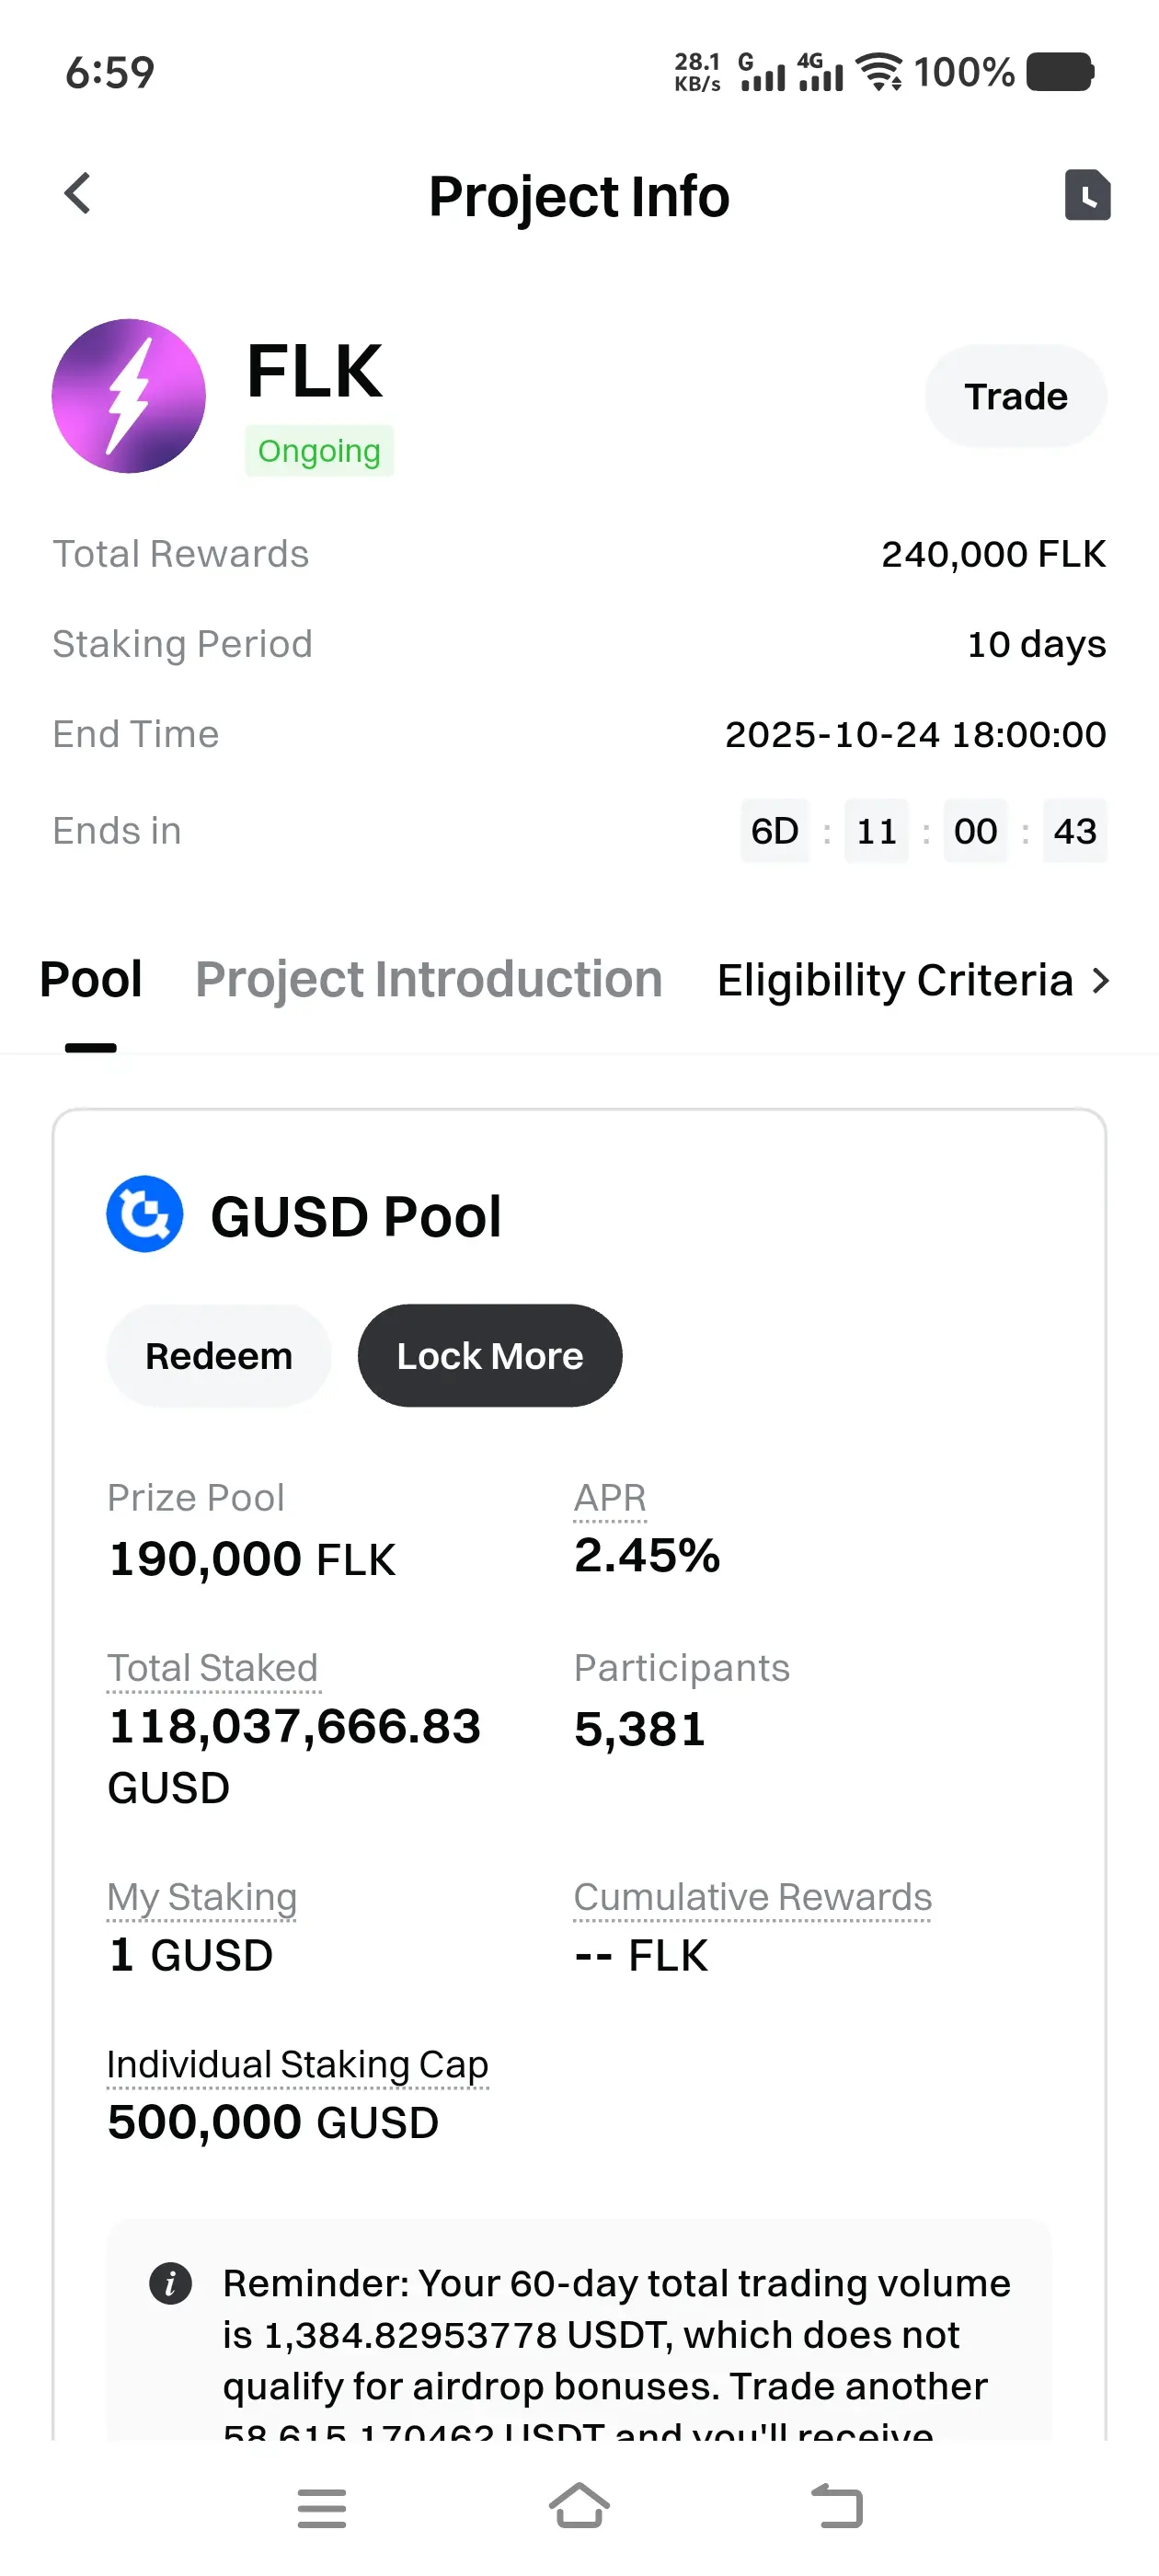
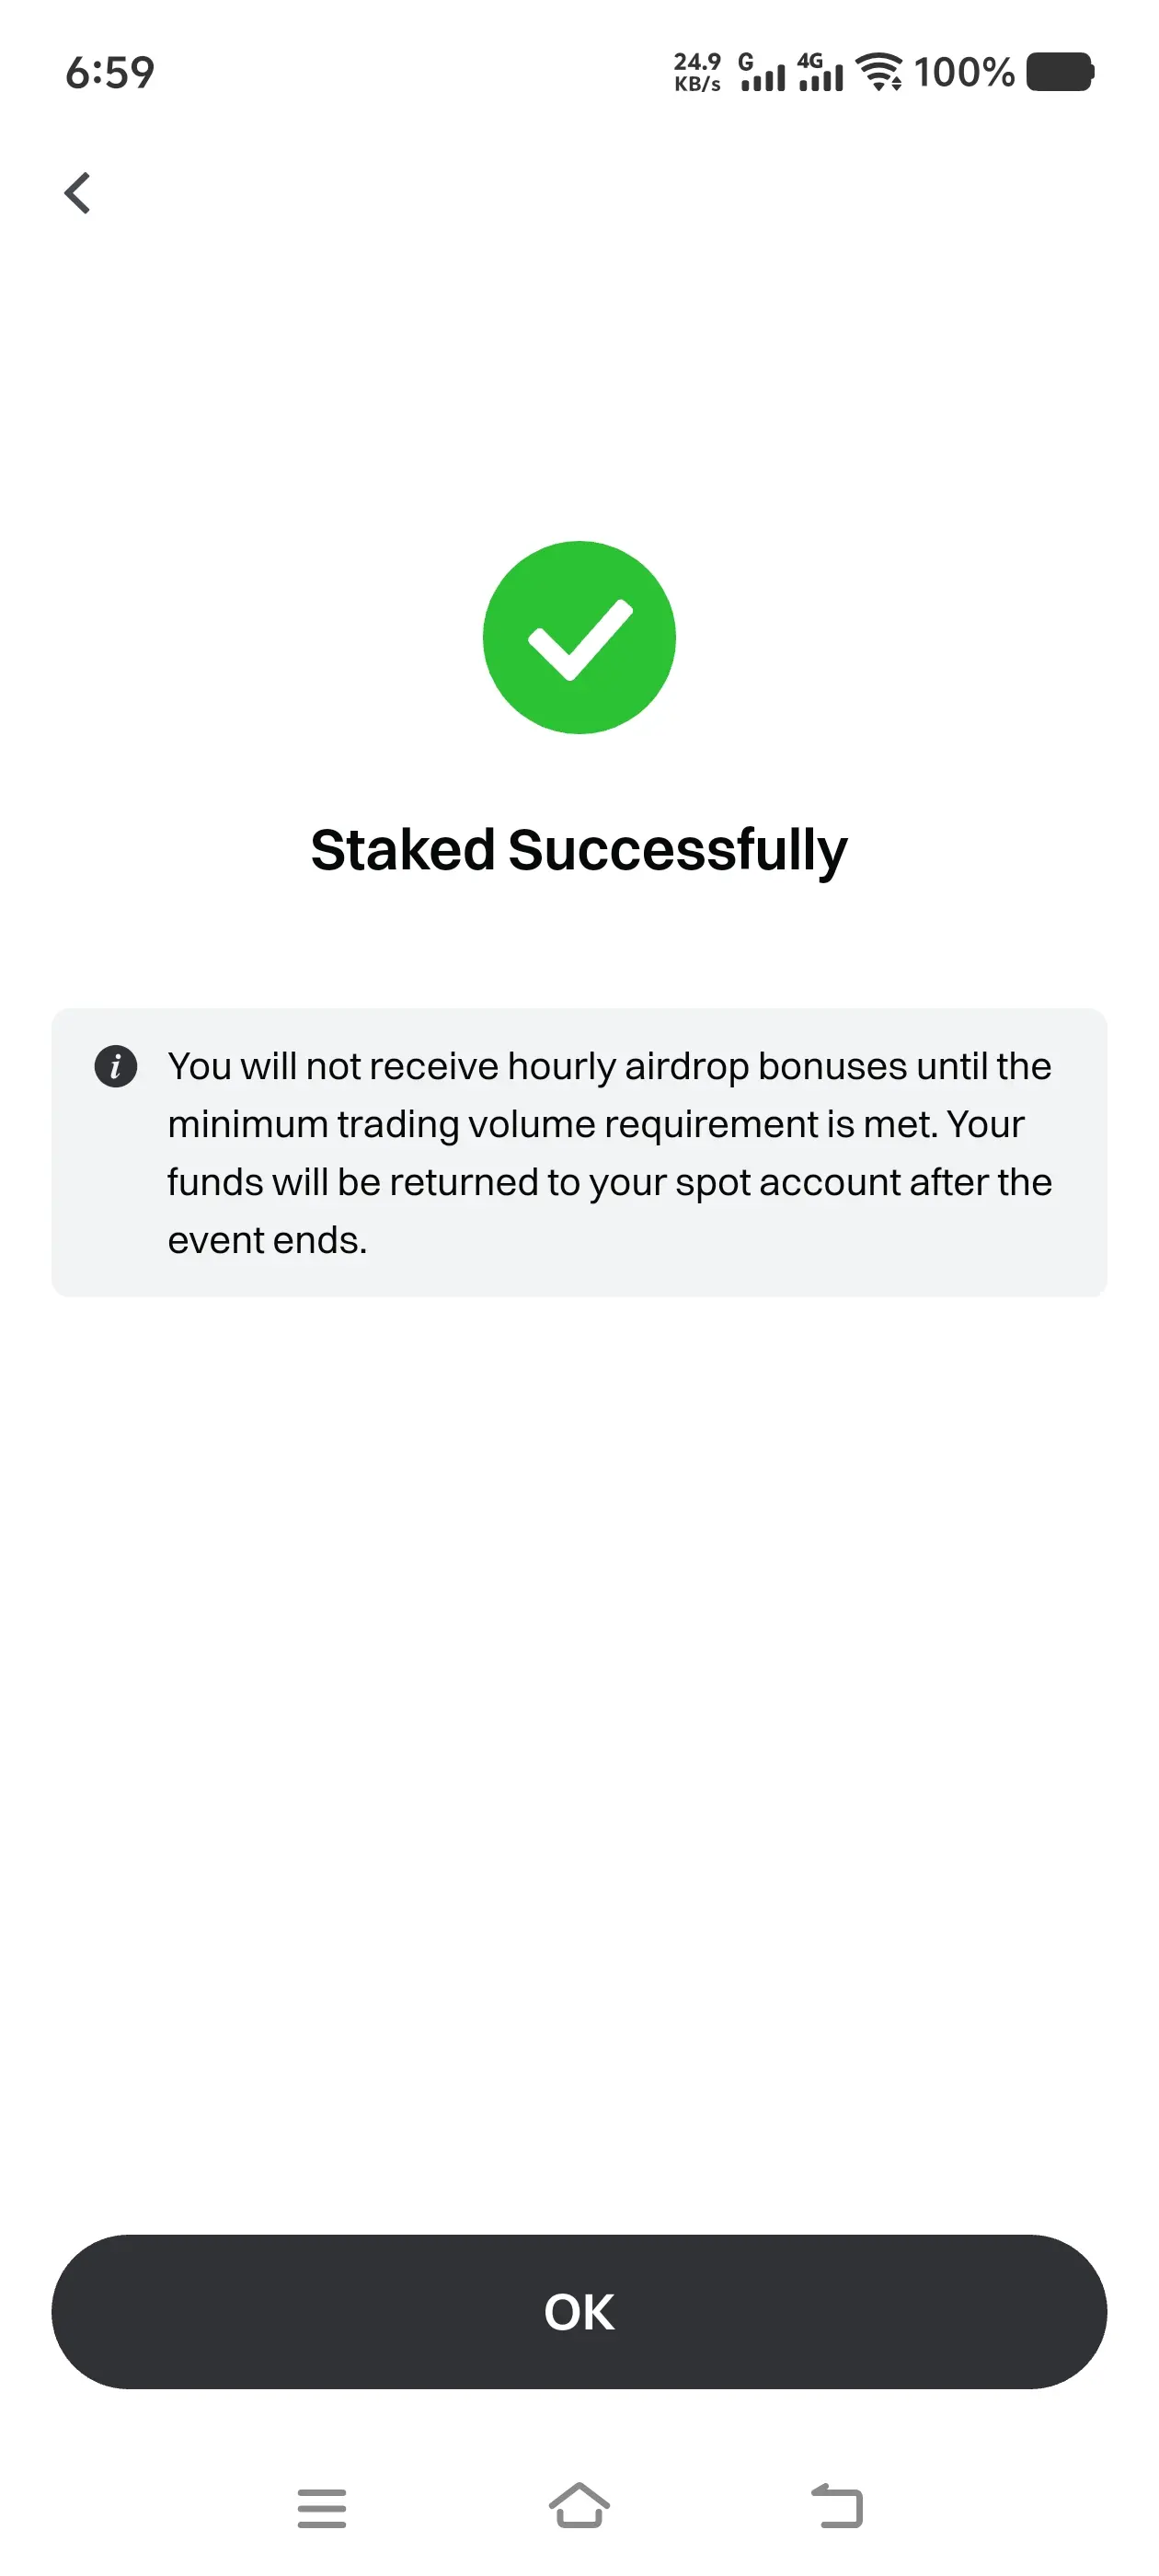
Stake GUSD or FLK and share 240,000 FLK tokens for free!
⏰ Staking Period:
📅 Oct 14, 2025 – Oct 24, 2025 (UTC)
Airdrop Details:
GUSD Pool
Total Rewards: 190,000 FLK
Reward/Hour: 791.66 FLK
Max/User/Hour: 102.91 FLK
M
FLK38.19%
GT5.41%
BTC2.51%
ETH5.19%
post-image
post-image
post-image
  • Reward
  • 5
  • Repost
  • Share
Sakura_3434vip:
Thank you for sharing, good luck ✅️
View More
Technical Analysis For ETH
Ethereum is trading around $3,851, continuing its corrective decline after multiple rejections near $4,400–$4,500. Price recently slipped below the 0.382 Fib ($3,991) and is now hovering just above the 0.236 Fibonacci retracement ($3,762) — a key support region where bulls are attempting to stabilize momentum.
🕯️ EMA Overview
20-day EMA: $4,163
50-day EMA: $4,207
100-day EMA: $3,973
200-day EMA: $3,552
ETH is currently below all short-term EMAs (20, 50, 100), showing continued bearish momentum.
However, the 200-day EMA ($3,552) sits just below current price and coul
ETH5.19%
post-image
post-image
  • Reward
  • 7
  • Repost
  • Share
Sakura_3434vip:
HODL Tight 💪
View More
Techical Analysis for BTC
Bitcoin is trading around $107,183, extending its corrective phase after repeated rejections above $120,000. Price has now slipped below the 0.618 Fibonacci retracement ($108,980) and is testing the key support zone around $104,000 – $106,000, which also aligns with the 0.786 Fib and prior accumulation area (highlighted in blue).
🕯️ EMA Overview
20-day EMA: $114,445
50-day EMA: $114,748
100-day EMA: $113,227
200-day EMA: $108,048
BTC is currently below all major EMAs, signaling short-term and medium-term bearish momentum.
The 200-EMA near $108,000 is being tested; a
BTC2.51%
post-image
post-image
  • Reward
  • 3
  • Repost
  • Share
Sakura_3434vip:
Bull Run 🐂
View More
Ethereum (ETH) Technical Outlook: Bears Eye $3,760 as Key Support Level
Ethereum continues its retracement phase, trading around $3,872 after failing to reclaim the $4,175 – $4,221 zone, which aligns with the 50-day and 20-day EMAs. The broader structure shows ETH moving within a descending channel, with lower highs forming since the $4,956 peak.
📊 EMA Overview:
20-day EMA: $4,194
50-day EMA: $4,221
100-day EMA: $3,975
200-day EMA: $3,548
ETH now tests the Fibonacci 0.236 level at $3,762, a critical support area that has held previous pullbacks. A breakdown below this could expose the $3,550
ETH5.19%
post-image
post-image
  • Reward
  • 11
  • Repost
  • Share
Sakura_3434vip:
Just go for it💪
View More
XRP Technical Outlook: Bears Retest $2.32 Support Zone
XRP remains under heavy selling pressure, extending its decline within a falling wedge formation, a pattern that often precedes bullish reversals. The price is currently holding near the $2.32 Fibonacci 0.236 retracement, a key level that coincides with the lower boundary of the wedge and could determine the next major move.
The token continues to trade below key EMAs, signaling a bearish short-term bias:
20-day EMA: $2.677
50-day EMA: $2.808
100-day EMA: $2.800
200-day EMA: $2.628
Meanwhile, the RSI (14) stands at 31.56, suggesting XRP is
XRP6.96%
post-image
post-image
  • Reward
  • 7
  • Repost
  • Share
JOHAR09vip:
1000x Vibes 🤑
View More
Technical Outlook For Ethereum (ETH)
ETH is struggling to regain momentum after rejection near the 50 & 100 EMA zone around $4,230.
Currently trading near $3,975, price action is caught between key Fib levels:
🔹 Support Levels
$3,991 – 0.382 Fib
$3,762 – 0.236 Fib
$3,545 – 200 EMA
$3,394 – major swing low
🔹 Resistance Levels
$4,175 – 0.5 Fib
$4,359 – 0.618 Fib
$4,622 – 0.786 Fib
📉 RSI (14): 42.7 → Neutral-bearish momentum
📈 Trend: Short-term downtrend, long-term structure still intact above 200 EMA
Bullish case: A break & close above $4,175 could fuel recovery toward $4,359–$4,622.
Bearish
ETH5.19%
post-image
post-image
  • Reward
  • 14
  • Repost
  • Share
JOHAR09vip:
Bull Run 🐂
View More
Technical Outlook: XRP Bears Tighten Grip as Price Tests Key $2.40 Support
XRP remains under heavy selling pressure, trading around $2.41 at the time of writing. The recent price action continues to signal a bearish market structure, with the token failing to reclaim the short-term resistance at the 20-day Exponential Moving Average (EMA) near $2.71.
The broader technical picture reveals XRP trending within a descending channel, suggesting that sellers remain in control. All key EMAs — 20, 50, 100, and 200 — are positioned above the current price, reinforcing the bearish bias and making it dif
XRP6.96%
post-image
post-image
  • Reward
  • 11
  • Repost
  • Share
JOHAR09vip:
Bull Run 🐂
View More
XRP Price Analysis: Bulls Hold the Line at $2.43, Eye Break Above Downtrend Channel
XRP is attempting to stabilize after finding crucial support at $2.43, a level that aligns with the 50% Fibonacci retracement zone and the lower boundary of a multi-week descending channel.
The latest rejection from the 200-day Exponential Moving Average (EMA) around $2.63 shows that sellers remain active near key resistance zones. The 20-day EMA ($2.74) and 50-day EMA ($2.85) hover just above, reinforcing the short-term bearish bias until XRP can reclaim those levels.
Momentum indicators continue to lean beari
XRP6.96%
post-image
post-image
  • Reward
  • 8
  • Repost
  • Share
JOHAR09vip:
Bull Run 🐂
View More
Ethereum Eyes $4,226 After Facing Resistance at $4,175
Ethereum experienced notable market turbulence in the past 24 hours, with $240.9 million in futures liquidations, including $150 million in long positions and $90.9 million in shorts. This underscores ongoing volatility as ETH tries to regain momentum.
After hitting resistance at $4,175, ETH bounced off a rising trendline but is struggling to hold support around the 100-day EMA at $3,977. Successfully defending this level is crucial for maintaining bullish momentum.
On the upside, a break above $4,175 could first target $4,226, and potenti
ETH5.19%
post-image
post-image
  • Reward
  • 6
  • Repost
  • Share
Cryptogethervip:
Bull Run 🐂
View More
Technical Outlook: Will XRP Extend Its Rebound Above Key Resistance Levels?
XRP is showing early signs of recovery after rebounding from recent lows, currently trading above the crucial $2.50 level. However, the price remains capped below the 200-day Exponential Moving Average (EMA) at $2.63, suggesting that bulls are still facing resistance in reclaiming dominance.
The Exponential Moving Averages (EMAs) on the daily chart indicate key dynamic resistance levels:
20-day EMA: $2.775
50-day EMA: $2.860
100-day EMA: $2.825
200-day EMA: $2.634
A decisive daily close above the 200-day EMA ($2.634) c
XRP6.96%
post-image
post-image
  • Reward
  • 4
  • Repost
  • Share
Selmusvip:
xrp xrp xrp xrp xrp xrp xrp xrp xrp xrp xrp xrp
View More
Technical Outlook: Can Pi Network Sustain Its Rebound Momentum?
Pi Network experienced a sharp 13% decline on Friday, plunging to a new low of $0.15555 before staging a rebound to close at $0.19217. As of writing, PI trades above $0.2140, suggesting the formation of a potential V-shaped recovery pattern.
If the rebound from the $0.2000 psychological support continues, the next key test lies near $0.27234, aligned with the central Pivot Point — a decisive area that could determine short-term trend direction.
The Exponential Moving Averages (EMAs) currently show:
20-day EMA: $0.25198
50-day EMA:
PI4.1%
post-image
post-image
  • Reward
  • 11
  • Repost
  • Share
LittleGodOfWealthPlutusvip:
Thank you for sharing the information😘
View More
  • Reward
  • 4
  • Repost
  • Share
MominurRahman990vip:
thank you for the information
View More
Technical Outlook For XRP
XRP is trading at $2.53, below the 20-day EMA at $2.79 and 50/100-day EMA at $2.869/2.828, showing short-term weakness. Price remains above the 200-day EMA at $2.635, keeping the medium-term trend intact.
📊 EMA Levels
20 EMA — 2.79
50 EMA — 2.869
100 EMA — 2.828
200 EMA — 2.635
🔹 Fibonacci Retracement (High 3.661 / Low 1.207)
78.6% → 3.136
61.8% → 2.724
50% → 2.434
38.2% → 2.144
23.6% → 1.786
XRP is trading above the 50% Fib ($2.434), near the pivot, with strong resistance ahead at 2.724–2.869 (Fibonacci + EMA zone).
📈 Indicators
RSI → 36.71 (slightly oversold)
MAC
XRP6.96%
post-image
post-image
  • Reward
  • 7
  • Repost
  • Share
MominurRahman990vip:
thank you for the information
View More
🧭 Ethereum (ETH) Technical Outlook
ETH is trading at $4,134, consolidating near the pivot at $4,175. Price is below short-term EMAs but above long-term EMAs, keeping the broader trend bullish.
📊 EMA Levels
20 EMA — 4,268.45
50 EMA — 4,250.32
100 EMA — 3,968.97
200 EMA — 3,528.02
🔹 Fibonacci Key Levels
78.2% → 4,622 (resistance)
61.8% → 4,359 (resistance)
50% → 4,175 (pivot)
38.2% → 3,991 (support)
23.6% → 3,762 (support)
📈 Indicators
RSI → 46 (slightly bearish / neutral)
MACD → Slight bullish bias
🧱 Key Levels
Resistance: 4,359 – 4,622
Major Resistance: 4,953
Support / Pivot: 4,175
Lower
ETH5.19%
post-image
post-image
  • Reward
  • 8
  • Repost
  • Share
Discoveryvip:
Watching Closely 🔍
View More
Pi Network (PI) – Today’s Technical Analysis
Current Price: ~$0.204
Pivot Level: $0.29476
Pi (PI) is trading below its pivot, showing bearish momentum, but short-term support near $0.21174 may offer a potential bounce.
⚡ Key Moving Averages
EMA 20: $0.26094 → $0.30845 → $0.39118 → $0.59810
These EMAs act as dynamic support/resistance zones, guiding short-term price moves.
📊 Momentum Indicators
RSI 20: 20 → oversold, signaling possible relief bounce
RSI MA (Yellow): 27.50 → short-term trend reference; crossing above this can indicate bullish momentum
🛡️ Support & Resistance Levels
Support: $0
PI4.1%
post-image
post-image
  • Reward
  • 9
  • Repost
  • Share
NewNamevip:
Thank you for information!
View More
XRP Whales Are Buying the Dip as Panic Fades – Can the Price Reclaim $2.8?
After one of its sharpest crashes this year, XRP plunged from $2.83 to as low as $1.20 before rebounding to around $2.46. The token remains down about 14% in 24 hours and nearly 20% weekly, but market data shows this drop wasn’t a typical sell-off — it was a derivatives-led panic flush, not mass spot selling.
During the chaos, whales quietly turned buyers.
According to Santiment, wallets holding over 1 billion XRP increased their balances from 23.98B to 25.02B, meaning whales scooped up 1.04 billion XRP — roughly $2.54
XRP6.96%
post-image
post-image
  • Reward
  • 6
  • Repost
  • Share
Ybaservip:
Buy To Earn 💎
View More
Bitcoin crashes to $102,000 amid Trump tariff shock
Bitcoin plunged to a three-month low of $102,000 following Trump’s tariff announcement, marking its steepest drop since June. Spot prices on major cex hit $107,000, while CoinGlass data shows $19.13B in crypto liquidations over 24 hours — $16.68B from leveraged longs.
The broader market tumbled, with Ethereum (ETH) down to $3,500 and Solana (SOL) sliding below $140. Analysts at Hyblock Capital noted, “Global 2x leverage on most altcoins was totally wiped out.”
China’s potential tightening of rare earth exports and new U.S. tech trade restrict
BTC2.51%
ETH5.19%
SOL5.86%
post-image
post-image
post-image
post-image
  • Reward
  • 9
  • Repost
  • Share
NewNamevip:
Thank you for information!
View More
Solana Price Forecast: SOL slips below 20-day EMA, eyes key support levels
Solana (SOL) is trading at $218+, losing 5% on Thursday in tandem with the wider crypto market downturn. The token has broken below its 20-day EMA at $222.47, signaling waning short-term momentum.
Currently, SOL is testing the 38.2% Fibonacci retracement level around $219. A failure to hold above this region could trigger a deeper pullback. The next line of defense lies along an ascending trendline from June 22. Beyond that, the 50% Fib retracement at $195, reinforced by the 100-day EMA at $200, forms a critical support
SOL5.86%
post-image
post-image
  • Reward
  • 15
  • Repost
  • Share
Rrr27377vip:
asiftahsin you are my smart buddy cheerrrrrrrrup 💪💪💪
View More
Technical outlook: XRP risks deeper downside before potential rebound
XRP is trading at $2.79, extending losses after slipping below the 100-day Exponential Moving Average (EMA) at $2.85. This breakdown underscores bearish dominance in the market. The Relative Strength Index (RSI) holds lower at 41 on the daily chart, pointing to intensifying selling pressure that could see XRP retest the $2.70 support, last visited in late September.
Bearish momentum is further backed by the Moving Average Convergence Divergence (MACD), which recently confirmed a sell signal with the blue line staying under t
XRP6.96%
post-image
post-image
  • Reward
  • 4
  • Repost
  • Share
MominurRahman990vip:
HODL Tight 💪
View More
Solana Technical Outlook: Bulls Eye $240–$250 if $219 Support Holds
Solana (SOL) is trading around $229, maintaining strength above the short-term support at $219–$220. On the 4-hour chart, the token is consolidating between the 200-period EMA ($218.97) and the 100-period EMA ($222.84), signaling a critical range before the next move.
The RSI has rebounded to 54 from lows near 35, highlighting improving bullish momentum. A sustained push above the midline would reinforce buyer confidence, boosting the odds of SOL breaking through the 100 EMA ($222.84), the 50 EMA ($225), and challenging the $2
SOL5.86%
post-image
post-image
  • Reward
  • 7
  • Repost
  • Share
MominurRahman990vip:
thanks for sharing every day
View More
  • Trending TopicsView More
  • Pin
Trade Crypto Anywhere Anytime
qrCode
Scan to download Gate App
Community
English
  • 简体中文
  • English
  • Tiếng Việt
  • 繁體中文
  • Español
  • Русский
  • Français (Afrique)
  • Português (Portugal)
  • Bahasa Indonesia
  • 日本語
  • بالعربية
  • Українська
  • Português (Brasil)