Square
Following
Hot
News
Notifications
Profile
Share your thoughts
placeholder
Article
Major data release tonight at 21:30
The U.S. October nonfarm payrolls report will be released
Nonfarm payrolls are a key indicator of Fed rate-cut expectations, directly driving volatility in BTC and ETH
Data above expectations → strong employment, dampening rate-cut expectations and weighing on crypto
Data below expectations → weaker employment, boosting rate-cut expectations and benefiting the crypto market
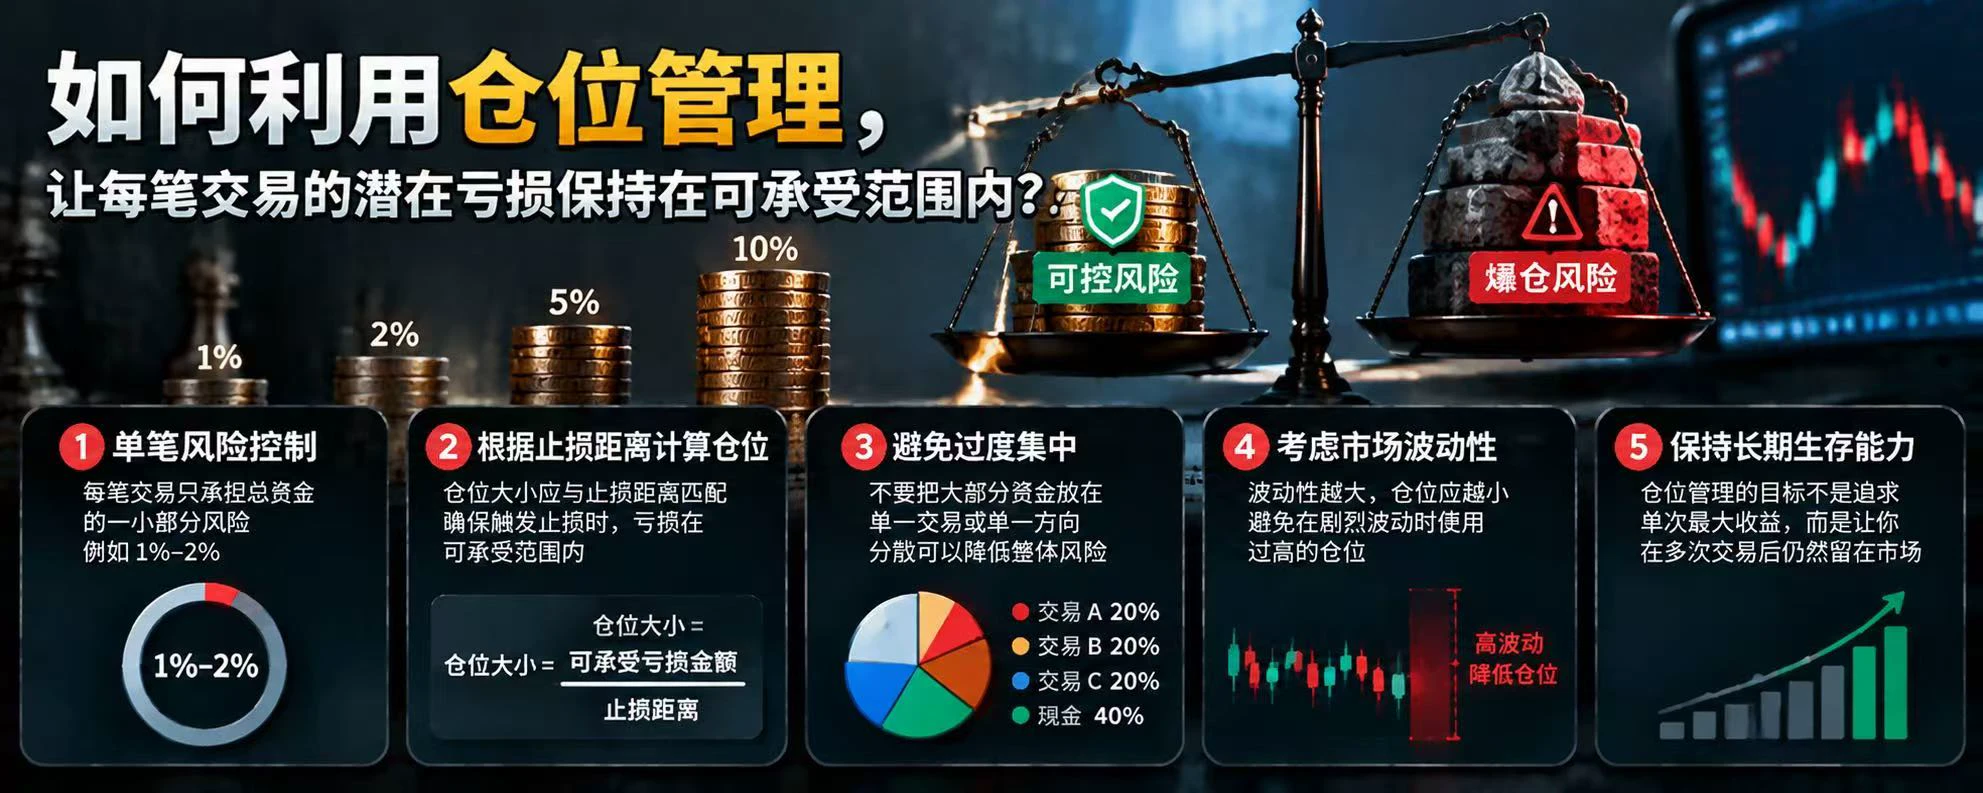
Volatility will spike on nonfarm payrolls night. Manage risk and avoid taking oversized positions to gamble#Gate首创资金安全证明 $BTC ‌
post-image
BTC-0.67%
Damn, 360 blocked my system, so I can't click it
post-image
Trenches
ZIG
Z
bade
b
ZIG
0x8c...1145
Market Cap
$.
Change
.
24h Vol
$.
Holders
.
BTC
B
bade
b
BTC
C5xp...pump
Market Cap
$.
Change
.
24h Vol
$.
Holders
.
STONK
S
bade
b
STONK
6GmA...UNgx
Market Cap
$.
Change
.
24h Vol
$.
Holders
.
DESSA
D
bade
b
DESSA
npz2...pump
Market Cap
$.
Change
.
24h Vol
$.
Holders
Diamond
D
bade
b
Diamond
5VCE...pump
Market Cap
$.
Change
.
24h Vol
$.
Holders
.
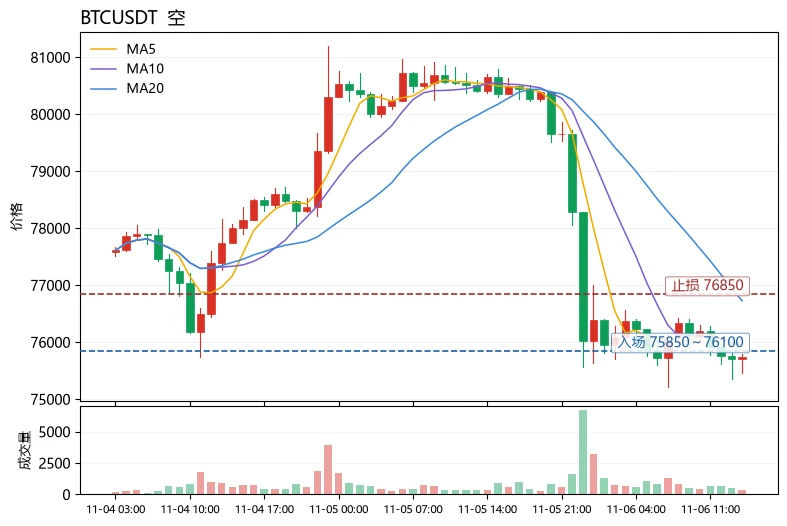
$BTC Price: 75722, down 5.91% over 24h, with a trading volume of 2075.5M USDT. Technical signals are bearish: MA5=75860.8 is below MA20=76724.7, with clear resistance from short-term moving averages; RSI=30.2 is approaching oversold territory; the MACD histogram at -8.414 shows bearish momentum persisting; Bollinger Bands [73837.6, 79611.8], with price trading near the lower band; the Fear and Greed Index is 28, indicating market fear. The funding rate remains positive at +0.0059%, making long positions costly and vulnerable to liquidation.
Overall view: The short-term outlook remains bearish,
post-image
DOGE-0.22%
💰 Your stock insights deserve rewards—and recognition

What signals make you bullish on a company? What concerns keep you on the sidelines?

Join Gate Square Stock Talk Season to share your views and the reasoning behind them.
🌟 Each day, 3 outstanding creators are selected to receive 5 USDT + an official feature, bringing their insights to a wider audience.

It’s not about predicting prices correctly or posting the most. Well-supported views, valuable observations, and thoughtful recaps all have a chance to get featured.

Register first, then post original content with #GateStockTalkSeason
post-image
  • 16
  • 4
What Is Leverage Trading? Why Can Leverage Improve Capital Efficiency While Also Magnifying Losses and Liquidation Risk?

In the cryptocurrency market, leverage trading allows traders to use relatively little margin to establish larger positions. But leverage is not a free capital multiplier: it also magnifies the impact of price movements on account equity. Without risk management, even a relatively small adverse market move can cause serious losses.

First, what is leverage?

Leverage is the use of margin to establish trading exposure that exceeds the amount of margin you own. For example, u
post-image
https://www.gate.com/zh/profile/网红迷迷佬

Subscriber-only link

Registration invitation code: VFGSXQ8JAA
  • 11
$XRP is showing signs of selling pressure after a $9.603K long liquidation around $1.1943. This suggests leveraged buyers are being forced out, potentially creating room for another downside liquidity sweep. Buyers need to defend demand and reclaim nearby resistance before a meaningful recovery can develop.
Support: $1.1800 – $1.1900
Resistance: $1.2100 – $1.2250
Next Target: $1.1600
A breakdown below support could accelerate bearish momentum, while a strong reclaim of resistance would signal improving buyer strength. Patience matters—wait for confirmation.
Let's go $XRP ‌
post-image
XRP-1.15%
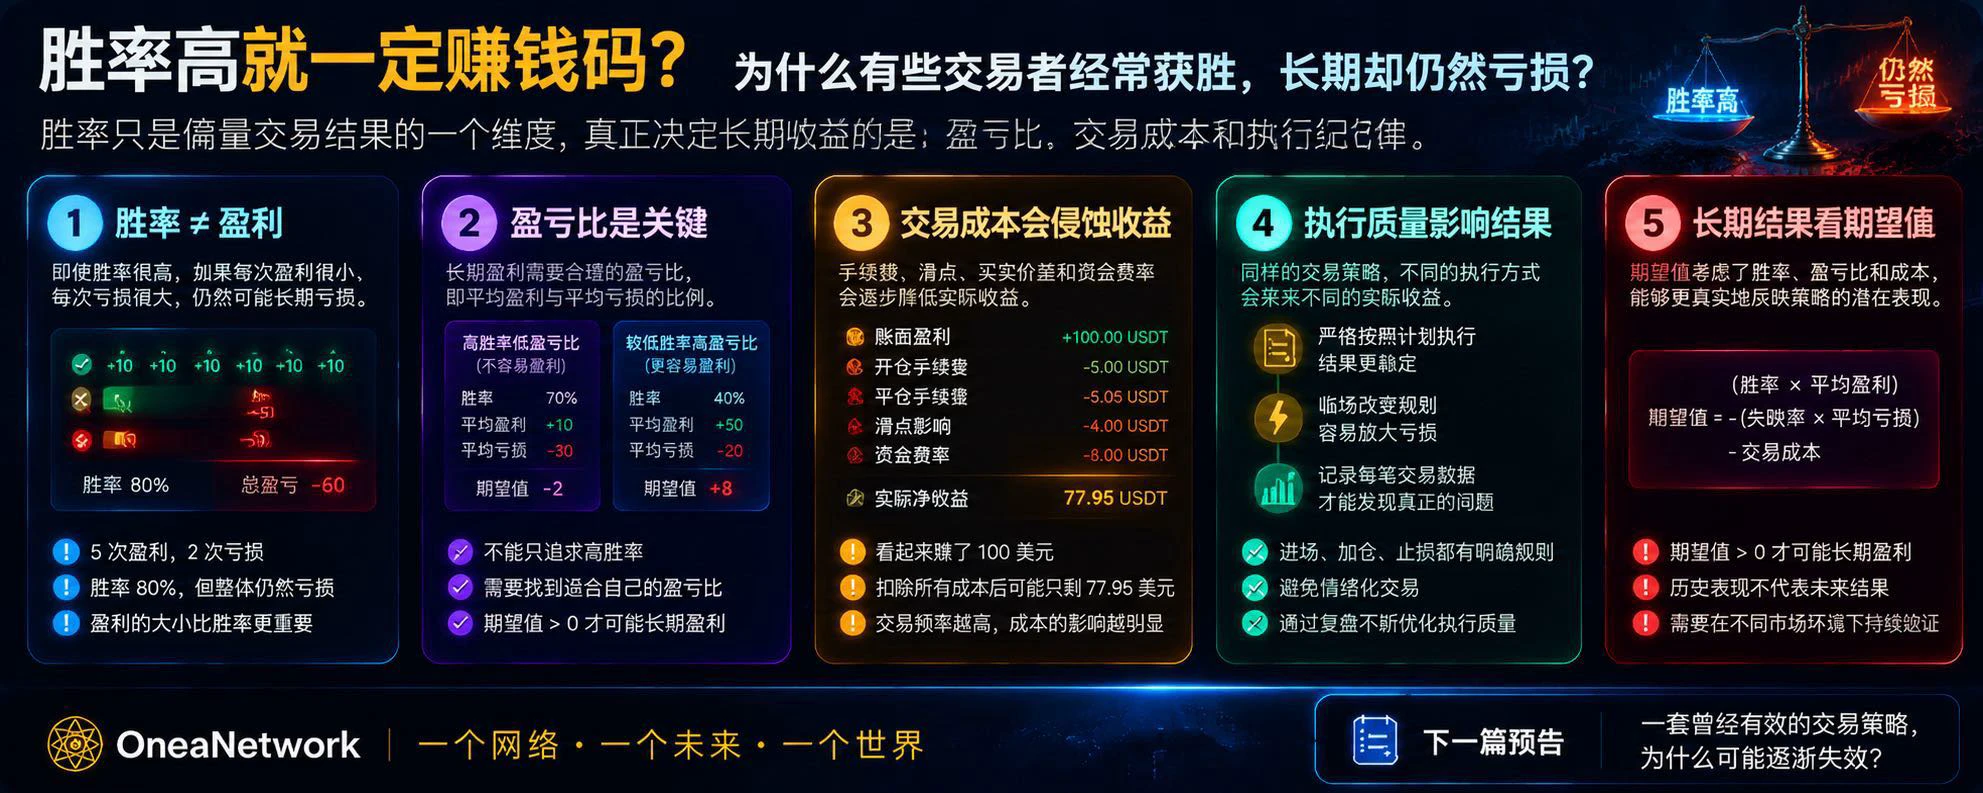
Does a High Win Rate Guarantee Profit? Why Do Some Traders Win Frequently Yet Still Lose Money Over the Long Term?

In the cryptocurrency market, many traders focus on one number: win rate.

A 70% win rate looks good.

An 80% win rate seems even more attractive.

But if a strategy wins many times in a row, yet the account balance doesn’t grow—or even keeps shrinking—what’s going wrong?

The answer may be simple: win rate only shows how frequently trades are profitable. On its own, it can’t determine whether a strategy will be profitable over the long term.

What really matters is the size of t
post-image
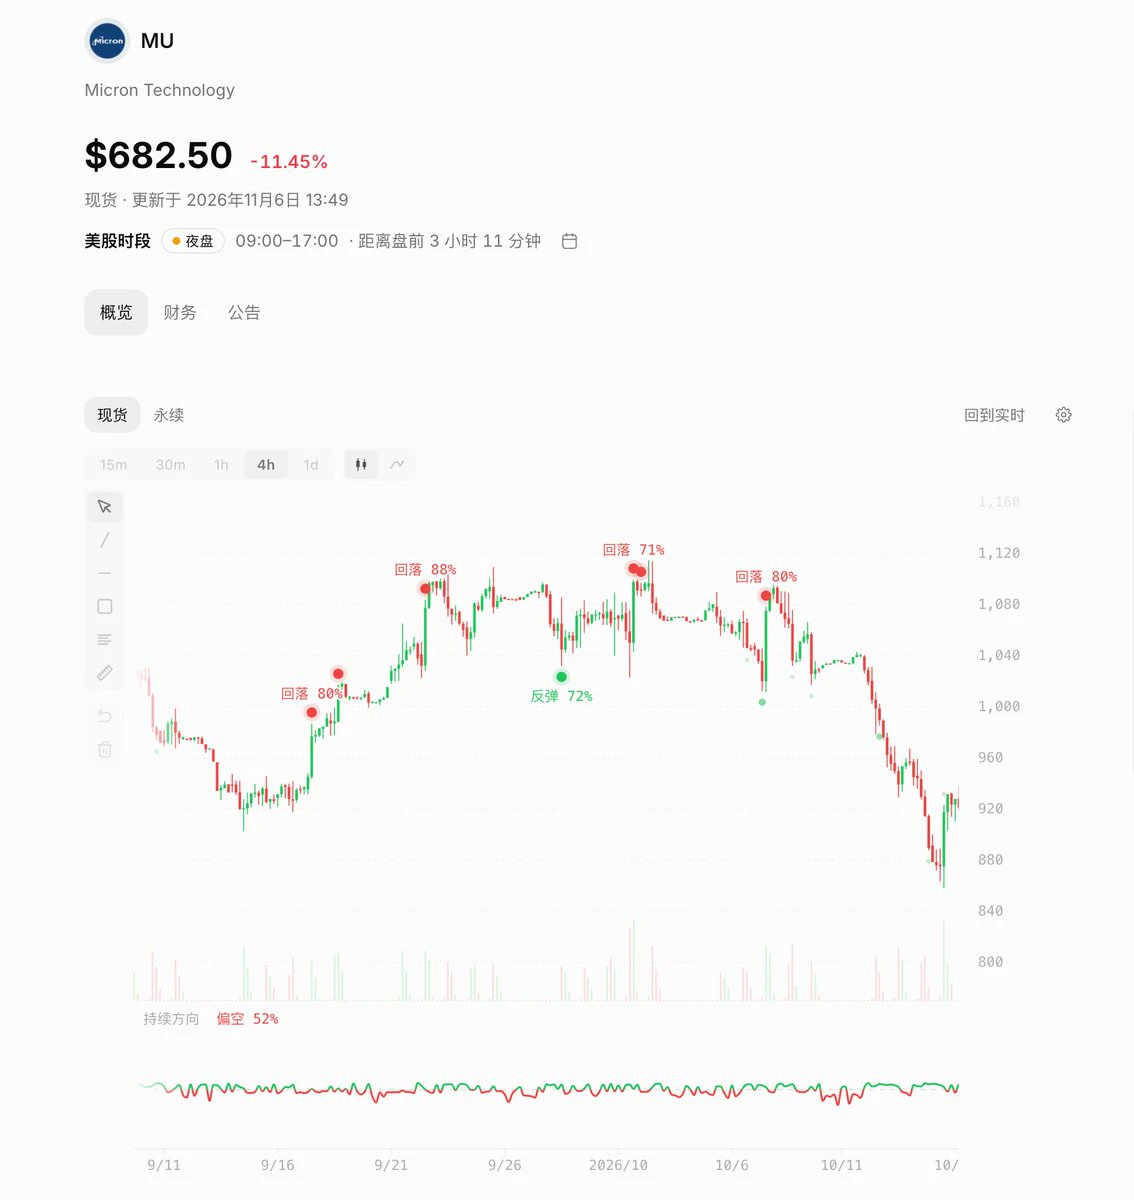
This probability model is amazing on Micron $MU too
post-image
MU-17.23%
What Is Trade Expectancy? How Can Win Rate, Average Wins and Losses, and Trading Costs Help Determine Whether a Strategy Has a Long-Term Edge?

In cryptocurrency trading, making money with a strategy in the short term does not mean it will work over the long term. Getting lucky and catching one big market move may hide problems with the strategy itself. Trade expectancy helps us evaluate a strategy overall, rather than judging it based on just a few wins or losses.

First, what is trade expectancy?

Trade expectancy is the average potential return per trade when repeatedly trading according to
post-image
Second-round screenshots from Dabao's livestream room
  • 1
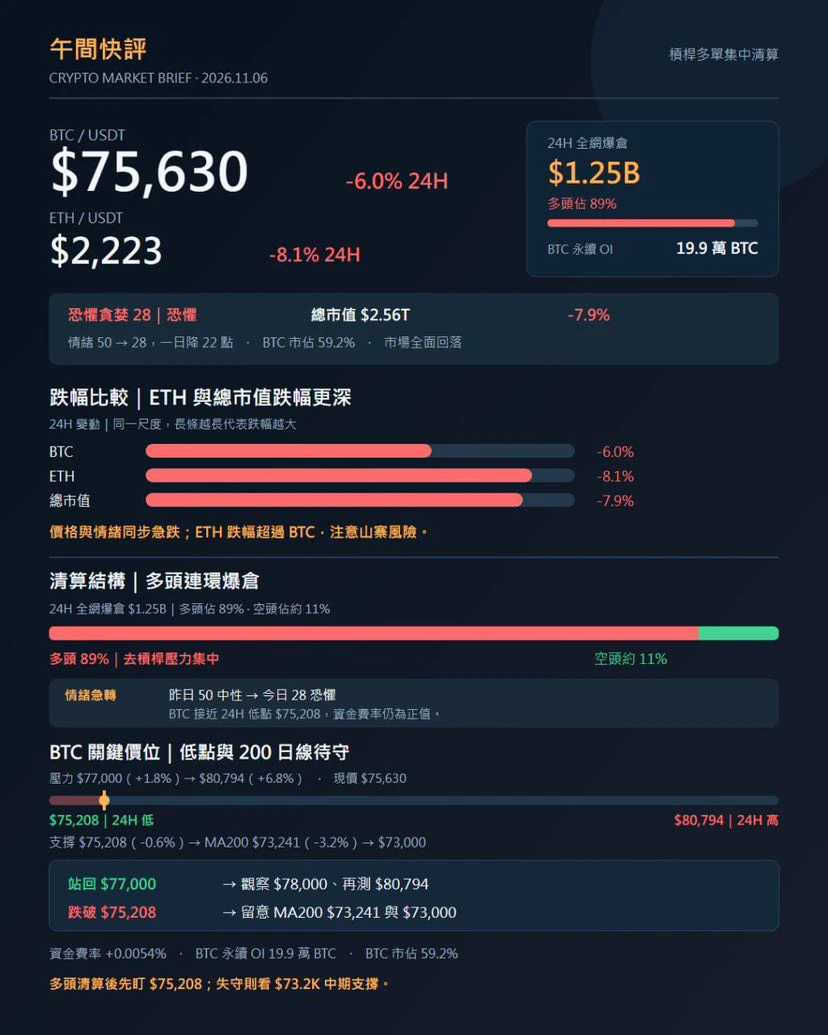
📊 #Midday Market Brief

BTC $75,630(-6.0%)| ETH $2,223(-8.1%)
24H liquidations $1.25 billion(longs account for 89%)| BTC perpetual OI 199,000 BTC
🔥 Fear & Greed Index 28(Fear), 50 yesterday | Total market cap $2.56T(-7.9%)| BTC dominance 59.2%

Resistance: $77,000(+1.8%)→ $80,794(24H high, +6.8%)
Support: $75,208(24H low, -0.6%)→ $73,241(MA200, -3.2%)→ $73,000

- Reclaim $77,000 → rebound to $78,000, then retest $80,794
- Break below $75,208 → head straight for MA200 at $73,241; if that level fails, watch $73,000

The funding rate remains positive at +0.0054%—it still hasn't turned negative.
post-image
BTC-0.65%
ETH-1.26%
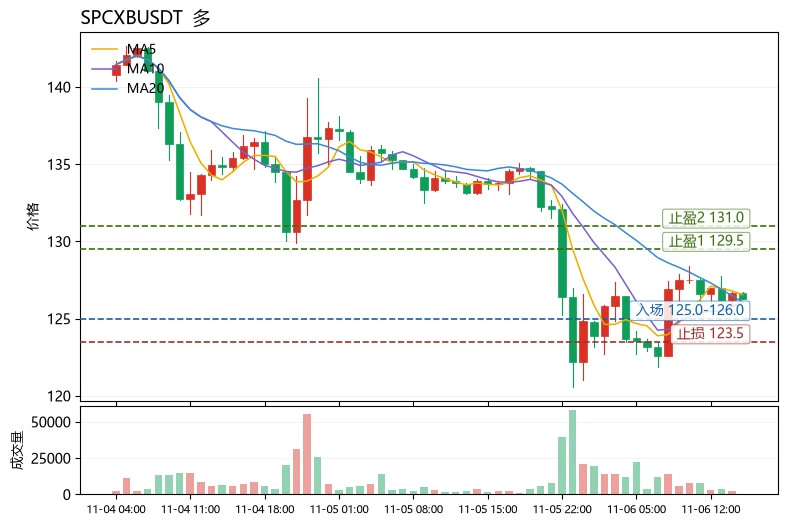
$SPCXB The most unusual detail today is not the drop, but the moving-average structure: the price fell 5.77% in 24 hours, yet MA5 remains above MA20 (126.554 versus 126.081), and the MACD histogram is still positive at +0.4746. This indicates the decline is taking place within a bullish alignment, making it a pullback rather than a trend breakdown—an ideal example for illustrating a reusable method: to judge whether a trend is healthy, first check the relative positions of the moving averages, then see whether momentum indicators are diverging, and finally use the Bollinger Bands to locate the
post-image
SPCXB
SPCXBSpaceX
Four.meme
MC:$3.12KHolders:2
0%
WLFI-0.16%
Short positions at 2400 and 2420; remind me to enter at market during a sharp surge. Currently up 870%.
Hold on to profitable positions, and set a firm stop-loss for losing ones#美股史诗级抛售
TradingKingGaoYuliang
Aggressive strategy! #Gate launches Taiwan stock trading
  • 1
South Koreas KOSPI plunged 8 at one point, triggering a circuit breaker! Losses narrowed after tradi
live-cover
LIVE1,468
$TRX Stop staring at and drawing on candlestick charts. What you should really be watching is who’s quietly making money on-chain.

Tron has already overtaken Ethereum in average USDT supply this quarter, with more than 16 billion transactions running on-chain every day. While the market is full of wails about the downturn, they’re still steadily bringing in cash flow from transaction fees.
Market conditions are one thing; who’s actually making money is another. That’s all you need to understand.
#TRX$TRX
Risk warning: The above reflects only personal opinions and does not constitute investmen
post-image
TRX+0.42%
ETH-1.26%
This latest sell-off in the storage sector has been unusually severe: 😑SanDisk $SNDK$SNDK plunged more than 22% overnight, Micron $MU fell more than 17%, and South Korea’s SK Hynix $SKHYNIX was down more than 13% at one point in early trading. Several leading storage companies were hit by sell-offs almost simultaneously. What’s going on in the market? Here are some of my personal thoughts. Until recently, the market’s pricing logic for storage was very clear: the expansion of AI computing capacity was driving demand for HBM, data center investment was boosting demand for DRAM and NAND, and
post-image
SKHYNIX+1.41%
BTC, PREDICTION MARKET UPDATE
live-cover
LIVE2,228
Either $BTC weekly 200EMA hold or hitting 53.9k realized price
Too early to determine anything
BTC-0.67%
What is maximum drawdown? Why can a long-term profitable trading strategy still experience an unbearable string of losses?

In cryptocurrency trading, some strategies may generate positive returns over the long term but suffer substantial losses along the way. If traders do not assess in advance how far their account could decline, they may be forced to exit before the strategy has a chance to recover. Maximum drawdown is an important metric for measuring this risk.

First, what is maximum drawdown?

Maximum drawdown (MDD) is the largest percentage decline in an account’s net value from a prev
post-image
Load More

Join 40 M users in our growing community

⚡️ Join 40 M users in the crypto craze discussion

💬 Engage with your favorite top creators

👍 See what interests you

Trending Topics

USStocksFaceHistoricSelloff

3.32k Views3.6k Discussing

U.S. stocks suffered a sharp selloff on Thursday, with the Nasdaq closing down more than 5% and the Philadelphia Semiconductor Index falling over 12%. AI and chip stocks including $NVDA and $AMD were hit especially hard. Markets are reassessing AI valuations, data-center spending and future returns. Is this just short-term deleveraging, or the start of a deeper correction in the AI trade? Which sectors are you watching next?

GateLaunchesPoSECProofOfSecurity

13.75k Views580 Discussing

USNonfarmPayrolls

11.98k Views4.03k Discussing

View More