Square
Following
Hot
News
Notifications
Profile
Share your thoughts
placeholder
Article
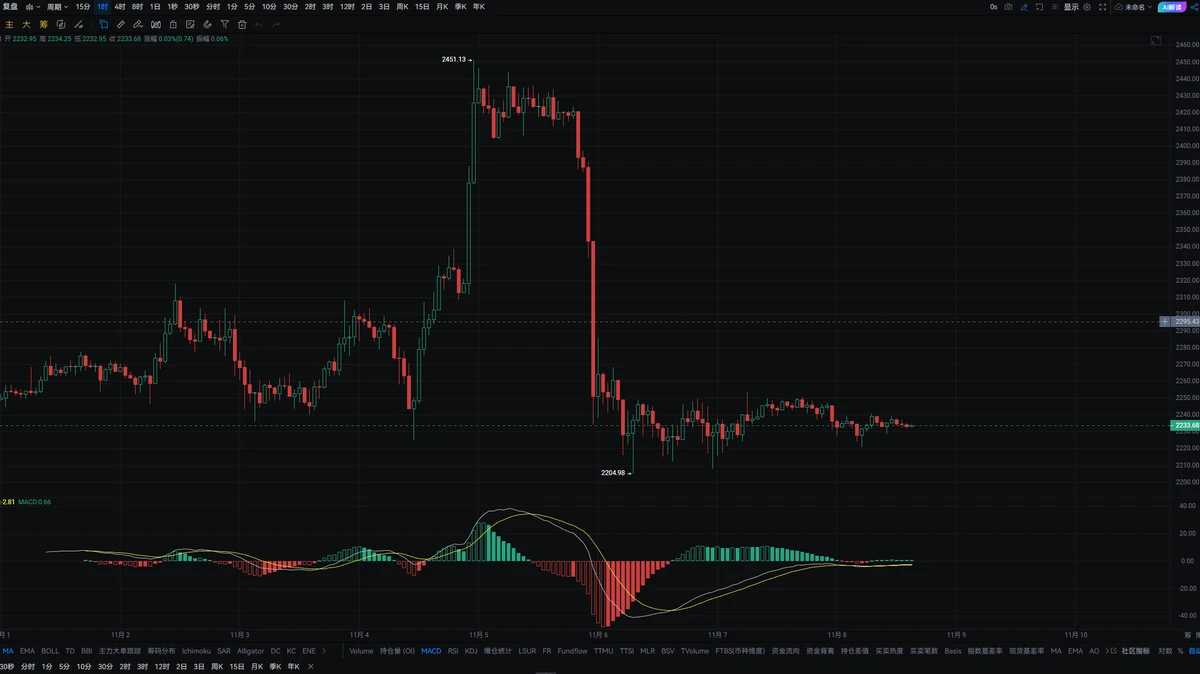
#ETH At the current price of 2235, the market is still weakening in lockstep with BTC, with virtually no independent buying. The first short-term resistance is around 2270, followed by the 2320 area, where supply was concentrated previously and which is also a key level for reversing the short-term weakness. A meaningful rebound will require BTC to stabilize and rally on increased volume.

The short-term support below is at 2210, with the key defense zone at 2180–2200. If this support zone is decisively broken, bears could open up more downside and test buying interest around 2150. In terms of
post-image
ETH-1.26%
BTC-0.67%
[NEW STREAMER]MARKET UPDATE
live-cover
LIVE880
Trenches
ZIG
Z
bade
b
ZIG
0x8c...1145
Market Cap
$.
Change
.
24h Vol
$.
Holders
.
STONK
S
bade
b
STONK
6GmA...UNgx
Market Cap
$.
Change
.
24h Vol
$.
Holders
.
IDOL
I
bade
b
IDOL
0x3b...ab07
Market Cap
$.
Change
.
24h Vol
$.
Holders
.
MAGGIE
M
bade
b
MAGGIE
8rHo...PmZV
Market Cap
$.
Change
.
24h Vol
$.
Holders
.
CLAUDIA
C
bade
b
CLAUDIA
2j5S...W2ZM
Market Cap
$.
Change
.
24h Vol
$.
Holders
.
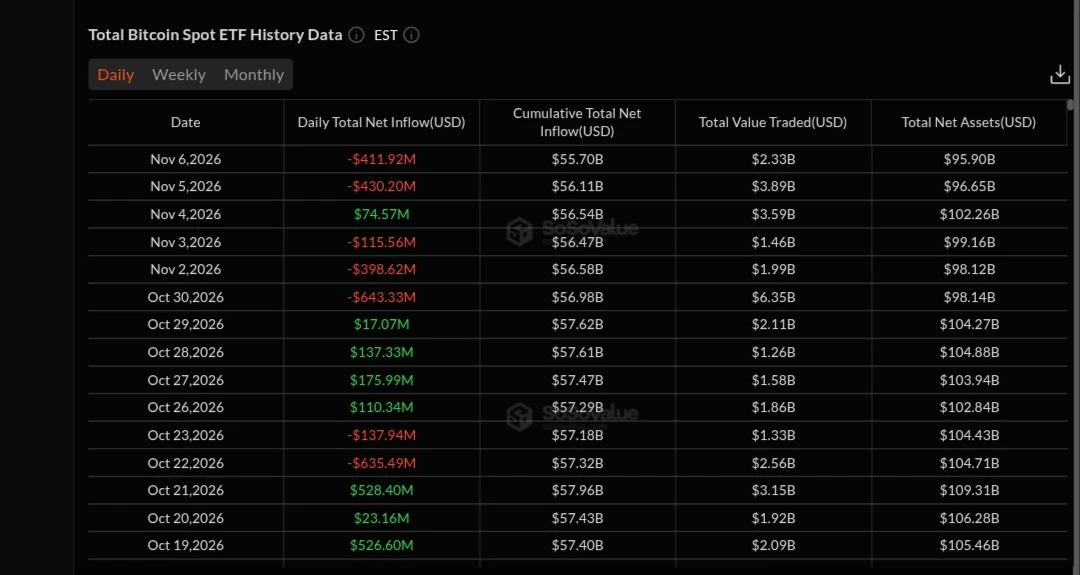
#BTCETF资金持续流出 For now, continued ETF net outflows look more like short-term risk aversion and deleveraging than institutions collectively exiting Bitcoin. But the concentration of outflows in BlackRock's IBIT also shows that some large investors are adjusting their allocations.

Why this doesn't look like a collective institutional retreat
Outflows were highly concentrated: From November 2–5, cumulative outflows were about $869.8 million, of which IBIT alone accounted for about $806.5 million.
There were both inflows and outflows: On November 4, there was a net inflow of about $128 million, wi
BTC-0.31%
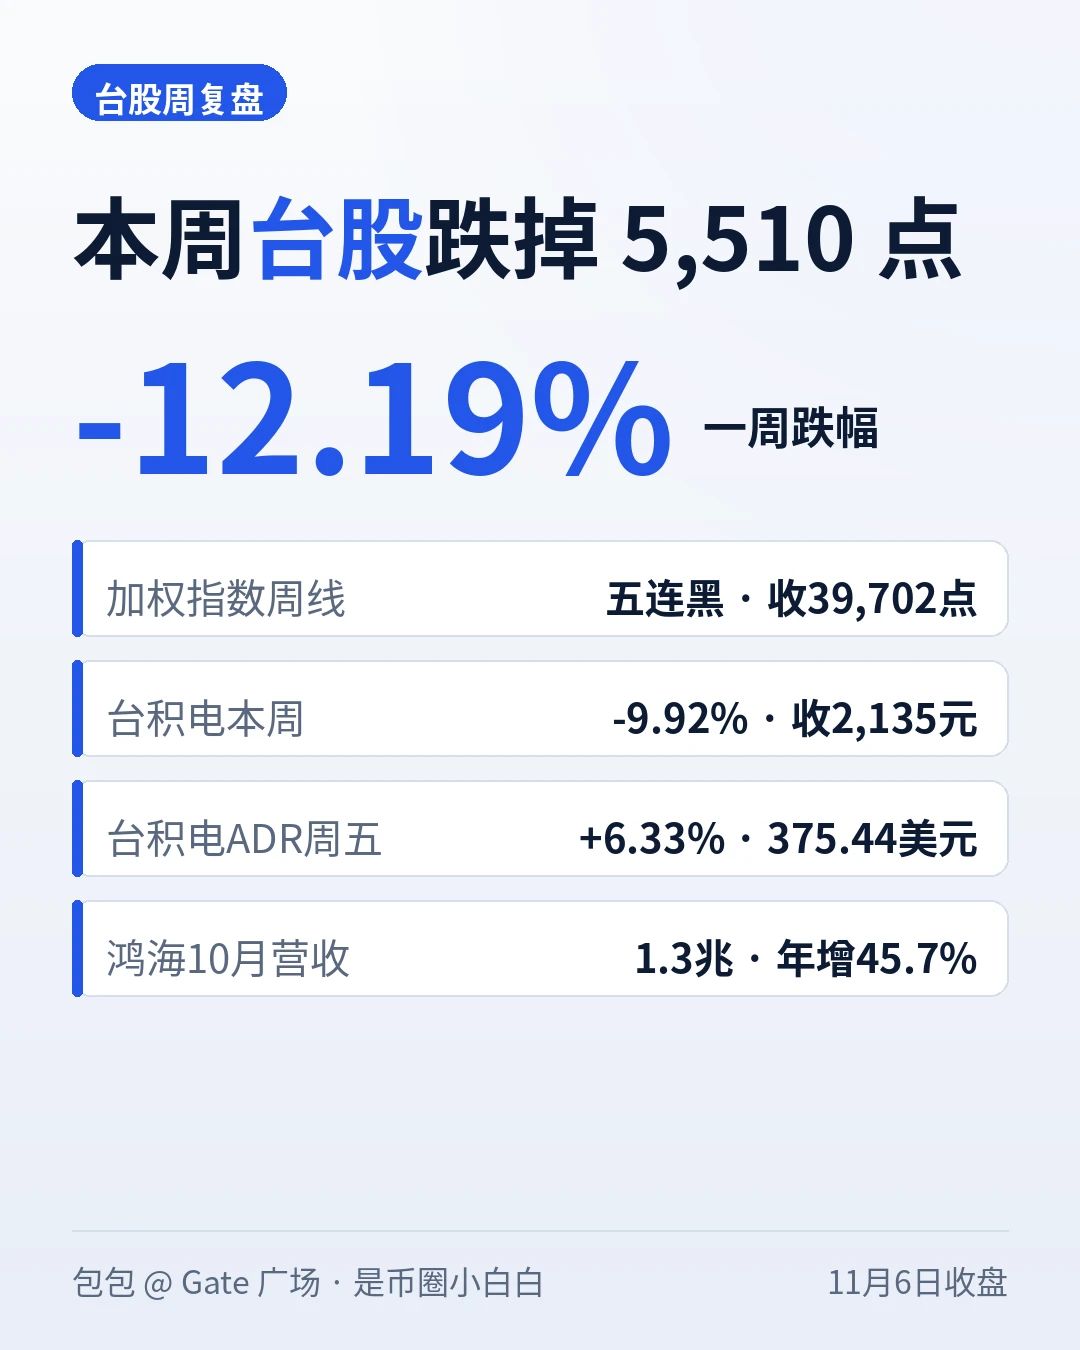
Taiwan stocks plunged 5,510 points this week, down 12.19%, with all five trading days ending in the red—the weighted index made a rare page in history this week. #Gate上线台股交易

First, Friday’s close: The weighted index closed at 39,701.64, down 1,873.08 points (-4.51%), the fourth-largest closing-point loss in history. It plunged as much as 3,737 points intraday, a record intraday loss, then recovered about 1,865 points from its low by the close. Turnover surged to NT$1.24 trillion, the week’s highest.
The full-week tally: All five trading days closed lower, for a cumulative loss of 5,510.19 po
post-image
TSM+6.60%
#Gate股票畅聊季 U.S. stocks shed over $4 trillion in a week. When will the data center panic end?

Wall Street endured another turbulent week, with the combined market capitalization of the three major U.S. stock indexes falling by about $4.1 trillion.
The market panic stems from Democrats taking control of both chambers of Congress after the U.S. midterm elections. Investors fear tighter regulation of the artificial intelligence (AI) industry and slower approvals for data center construction, triggering a concentrated sell-off in tech stocks. Treasury yields surged after the latest nonfarm payroll
NAS100-0.07%
SPYX+0.01%
SPX+0.33%
JPM-0.84%
HSBC-0.62%
  • 2
The Difference Between Savvy Investors and Ordinary Stock Traders: While Others Chase Rallies, They Wait for These Signals!

Why are some people as busy trading stocks as if punching in at work every day, yet their accounts show no growth? And why do others seem unhurried and find it easier to stay rational?
I think the difference may lie in their investment approach.
When I’m bullish on a company, I first research whether it can keep making money, rather than asking whether its stock can hit the daily limit tomorrow.
If a company has a stable customer base, a growing business, healthy cash fl
NVDA+2.80%
  • 26
market update
live-cover
LIVE922
#BTCETFOutflowsContinue
U.S. spot Bitcoin ETFs have experienced a notable shift in momentum, recording significant net outflows over the recent trading sessions. According to data from SoSoValue, daily net outflows exceeded $400 million on consecutive days heading into November 6, 2026, contributing to a substantial reduction in total net assets.
This trend raises key questions regarding institutional behavior. While Bitcoin's price has demonstrated resilience, holding above $75,000, the sustained exit from ETF products suggests a tactical rotation or temporary risk aversion rather than a str
post-image
BTC-0.31%
At the market top, people often forget about risk. I had just graduated from college two months earlier when I reminded my teacher to watch for an exit near the top. It took only two months to go from peak prosperity to a massive crash. That’s how shorting works: when you spot a problem in the market, it often keeps going for a while. That period is a test of you. Good market conditions and trades with big outcomes are always uncomfortable.
Great $UAI another sharp sell-off is underway. Although the risk of getting stopped out is high, the profits could be substantial if you time it right. I’m going heavily long to catch the rebound😍😍😍$KOMA $IDOL 😍😍😍
post-image
UAI-7.58%
KOMA-3.91%
IDOL-6.71%
OANDO
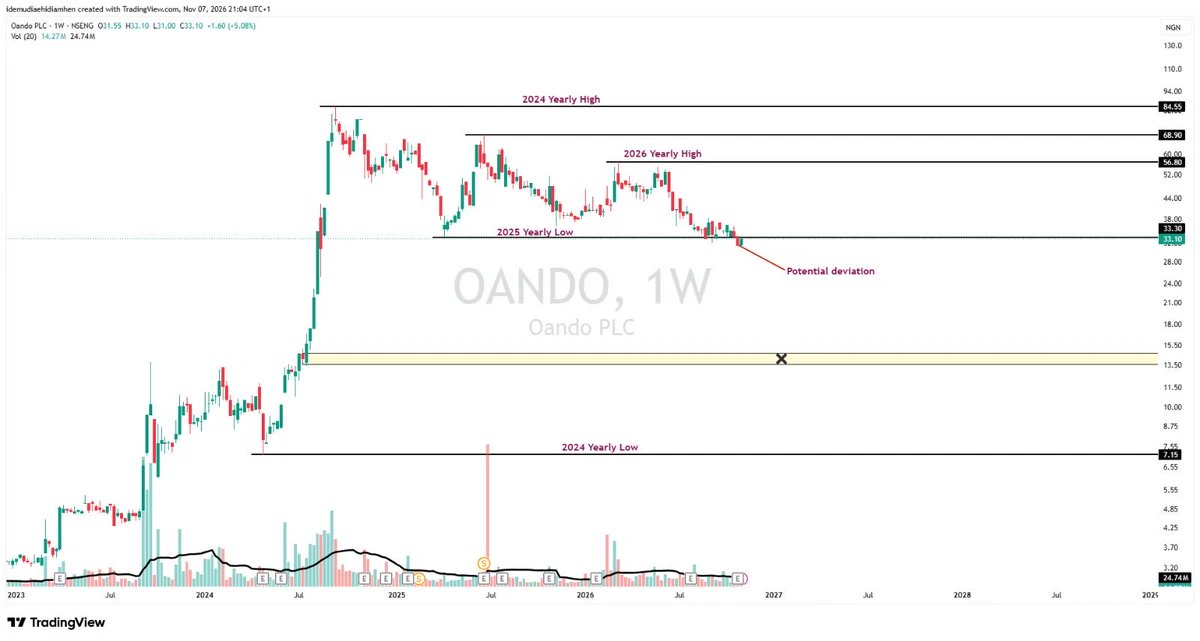
Warning: OANDO's fundamentals are shite; I am gonna only focus on technicals.
Last week, we formed a potential deviation, and I expect a potential bounce to come next week. All I wanna see is the bulls reclaiming the 2025 yearly low of N33.1/share.
Failure to reclaim the 2025 yearly low; then the next zone is the X market zone in the region of N13.6-N14.7 per share, which I doubt the market makers of OANDO will want to happen.
Personally, I will never trade this company till I see the right momentum, but this is a memestock
#NFA
post-image
  • 7
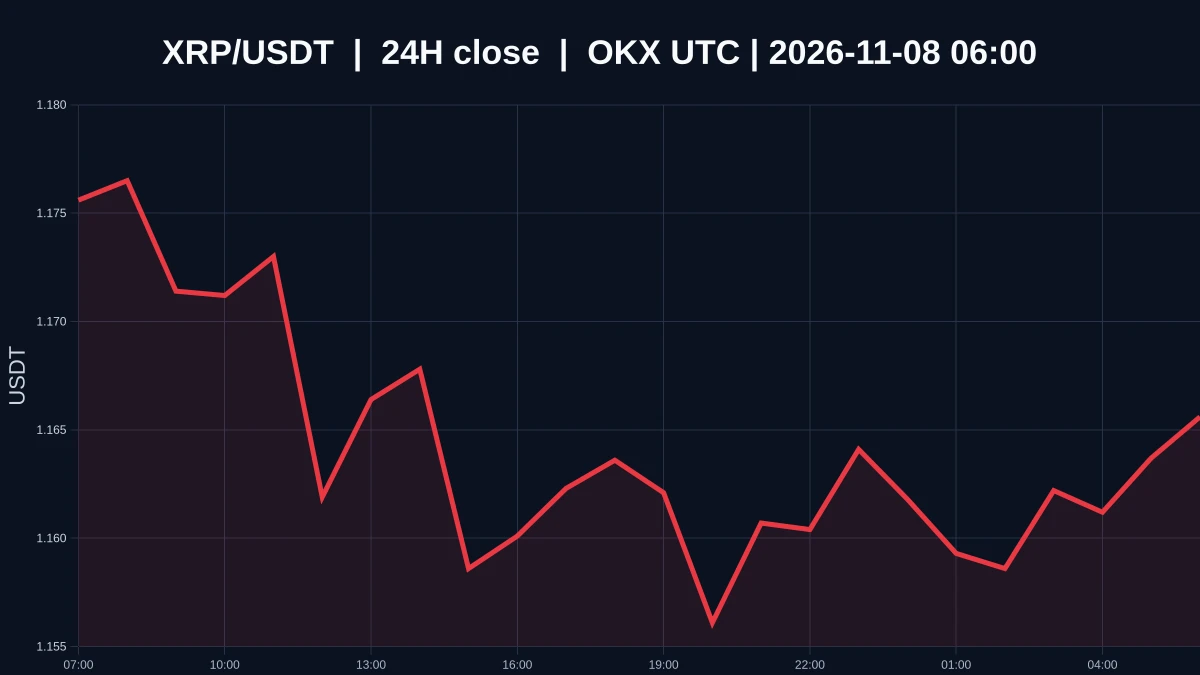
$XRP ’s 1-hour and 4-hour charts give opposite signals. Which one is more reliable?

$XRP is currently priced at 1.1659, up 0.37882049074471347% over the past 24 hours, with an intraday high of 1.1821 and low of 1.1495. The 1-hour trend is bullish, while the 4-hour trend is bearish. The volume ratio is 0.0759448457701905. The short-term trend has turned bullish, but the broader trend remains bearish. This means the market has yet to establish a clear direction; the shift has appeared only on a shorter time frame so far.

On the 1-hour chart, support is at 1.1495 and resistance is at 1.1821. At
post-image
XRP-1.15%
#BTCETFOutflowsContinue #ShareWeekly
#WCTCS9
BTC ETF Outflows Continue: Is Bitcoin Facing More Selling Pressure?

Bitcoin is facing another important challenge as institutional money continues moving out of spot Bitcoin ETFs. Recent withdrawals have raised concerns about institutional demand, market confidence, and Bitcoin's next price direction.
ETF outflows are important because they can indicate that investors are reducing their exposure to Bitcoin. When withdrawals continue across multiple trading sessions, buying support may weaken and selling pressure can increase.
However, I do not be
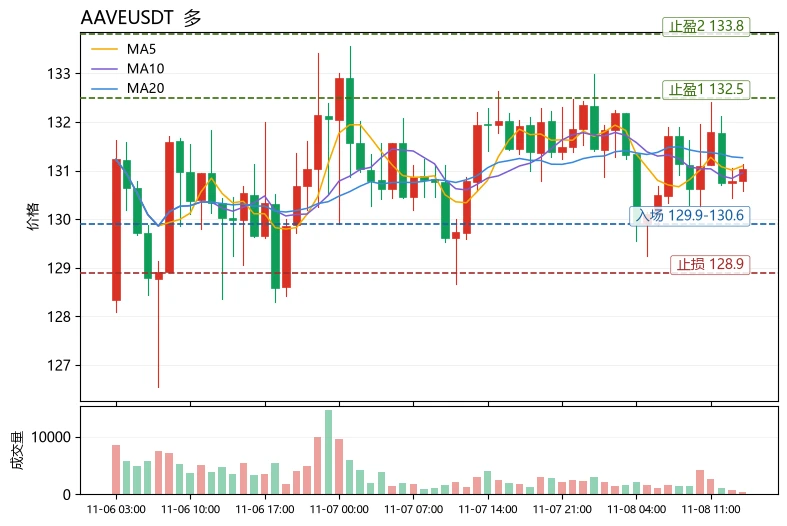
Many people equate “price above the moving averages” with a healthy trend, which is a classic misjudgment based on a single indicator. Moving averages only show the center of cost, not momentum. Take $AAVE$AAVE as an example: the current price is 131.04, MA5=131.094 is slightly below MA20=131.264, and the moving averages are mildly bearishly aligned. However, the two lines are nearly converged, and the 30-candle range is only about 3.3%, indicating sideways consolidation rather than a downtrend. Looking only at moving averages here would lead to the wrong conclusion. The correct approach is to
post-image
ARB+1.17%
Gate Square Trading Challenge: Share Your Trades and Split a 50,000 USDT Prize Pool https://www.gate.com/campaigns/6857?ref=VLARBF1YAG&ref_type=132
post-image
Hackers’ favorite isn’t a bull market—it’s your account! Here’s how to activate Gate Security Guardian

Think account security means setting a complex password and adding 2FA, and you’re all set?
Friend, you may be underestimating hackers!
Phishing, malware, remote device access, and even SIM card theft can all create risks of unauthorized asset transfers.
It’s like installing a security door at home but forgetting to close the windows—the sense of security is cut in half! 😂
Gate has now launched Security Guardian. Eligible users can apply for free to add another layer of protection to their
  • 29
Altcoins are getting crushed! 70% are below the 200-day moving average—is a reversal closer than we think?

What’s the most interesting thing about the market?
When prices rise, everyone thinks they’re an investment genius; when they fall, everyone starts studying long-term investing!
Now, another noteworthy data point has emerged in the altcoin market.
CryptoQuant analyst Darkfost pointed out that around 70% of altcoins on a certain exchange are currently below their 200-day moving average, compared with only about 10% in early October.
Meanwhile, the total altcoin market cap has shrunk by ab
NVDA+2.80%
  • 31
#Gate股票畅聊季 #WCTCS9 #美股财报季 The Battle Between Bulls and Bears in U.S. Stocks: Is the Real Test for the AI Bull Market Just Beginning?

This weekend, debate on Wall Street over U.S. stocks was unusually heated. On one side, firms such as Goldman Sachs and Morgan Stanley remain bullish, viewing the recent decline as a rare opportunity to add to positions; on the other, a growing number of investors are concerned that the rapid growth in AI infrastructure investment may be facing a triple test from policy, returns on capital, and market valuations. On the surface, this is a debate over how high th
GS-0.30%
MS-0.59%
SPYX+0.01%
NVDA+2.80%
ED-2.41%
dropp enables pay-per-use payments and offers merchants up to 10x lower processing fees, combining real-time payments with hedera-issued stablecoins for instant cross-border transactions.

$HBAR $USDC #GATE
HBAR-1.36%
USDC+0.01%
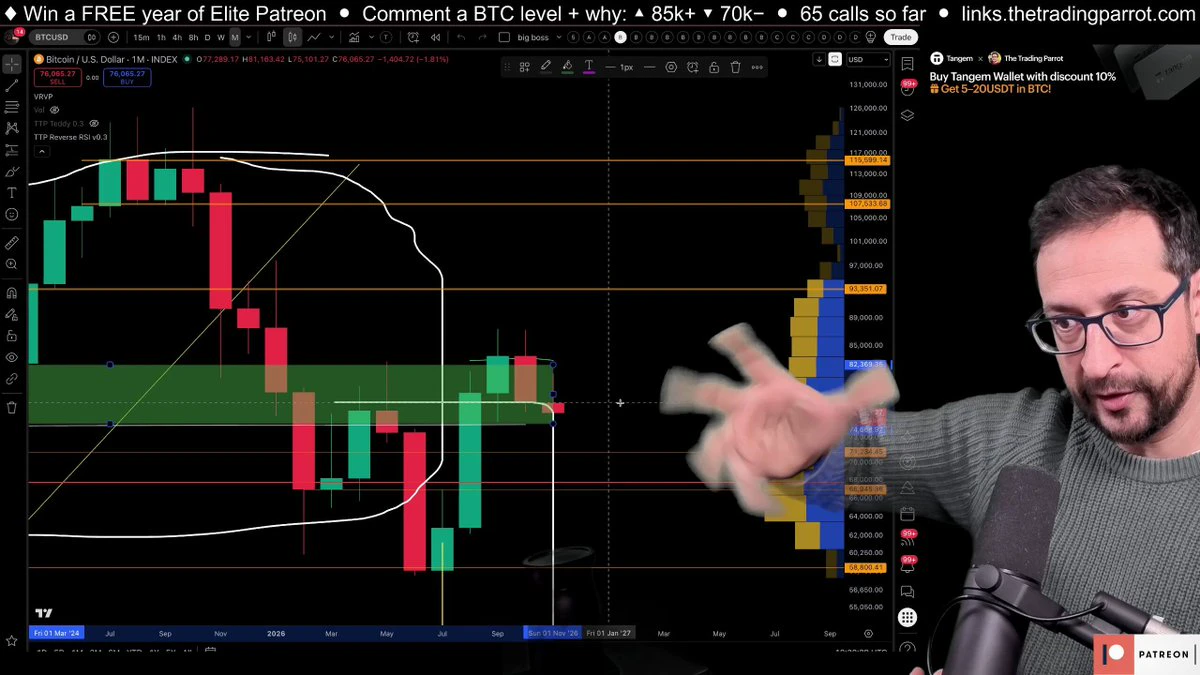
If November closes like this it's a rejection — and we step back into the massive fair value gap that can teletransport price back to the lows. Mariano's November warning at 10:50 in today's video
#Bitcoin #BTC #Crypto #November #Trading
post-image
BTC-0.67%
Load More

Join 40 M users in our growing community

⚡️ Join 40 M users in the crypto craze discussion

💬 Engage with your favorite top creators

👍 See what interests you

Trending Topics

USCPIDataIncoming

4.16k Views1.52k Discussing

The U.S. October CPI report will be released on November 10 at 8:30 a.m. ET. September CPI came in at 3.7% year over year, and markets will be watching closely for signs that inflation is cooling, especially in core CPI. A softer-than-expected reading could strengthen rate-cut expectations, while hotter inflation may pressure risk assets through higher Treasury yields and a stronger dollar. How do you think this CPI print will move $BTC, U.S. stocks and gold?

USAIStocksHitHard

24.99k Views3.71k Discussing

USNonfarmPayrolls

44.93k Views4.44k Discussing
View More