Square
Following
Hot
News
Notifications
Profile
Share your thoughts
placeholder
Article
$INIT Can I wake up to a pleasant surprise? The short position on the INITUSDT perpetual contract is still open, with an unrealized loss of -109.55 USDT, while INIT is up +16.35%. The position size is 3.5k. The market never follows the script, so think carefully about whether you can handle the risk before holding on. (The above is solely my personal opinion and does not constitute investment advice. Please approach market risks rationally.)
post-image
INIT-2.53%
$INIT I chased in at $0.19 and didn’t sell at $0.29; now I’m sitting at 0.228 taking a beating. The 24h high was 0.303 and the low was 0.159, with the range nearly doubling; trading volume was 1.2 billion—that turnover rate clearly points to a sentiment-driven market, not a trend-driven one. I reviewed the last bull market: in weeks 5–7 after the halving, altcoins collectively saw sharp wick-down shakeouts, just like today’s upper wick on $INIT: a 21% pump to attract chasers, then a pullback to confirm support. There’s just one lesson: on a high-volume wick day like this, I’d rather wait for a
INIT-2.53%
Trenches
PIEVERSE
P
bade
b
PIEVERSE
0x0e...25a9
Market Cap
$.
Change
.
24h Vol
$.
Holders
.
X
X
bade
b
X
9VZe...pump
Market Cap
$.
Change
.
24h Vol
$.
Holders
.
牛逼
牛
bade
b
牛逼
0x96...7777
Market Cap
$.
Change
.
24h Vol
$.
Holders
.
DacityCoin
D
bade
b
DacityCoin
DKYc...pump
Market Cap
$.
Change
.
24h Vol
$.
Holders
.
FLOAT
F
bade
b
FLOAT
Bv1a...BMmr
Market Cap
$.
Change
.
24h Vol
$.
Holders
.
Long from below 73,000; currently at 73,700, already up 1,800 points!
🚨 Your First Goal Isn't Making Money. It's Not Losing It.

Many traders enter the market thinking about how much they can make. But smart traders think about how much they can afford to lose.

Here's the truth: You can't make consistent profits if you don't know how to protect your capital.

A few simple rules can make a big difference:

💡 Never risk more than you can afford to lose.

📊 Always use a stop-loss.

💰 Avoid putting all your capital into one trade.

⚖️ Manage your position size wisely.

🧠 Don't let emotions control your decisions.

Remember, you don't have to win every trade to
post-image
GT-2.41%
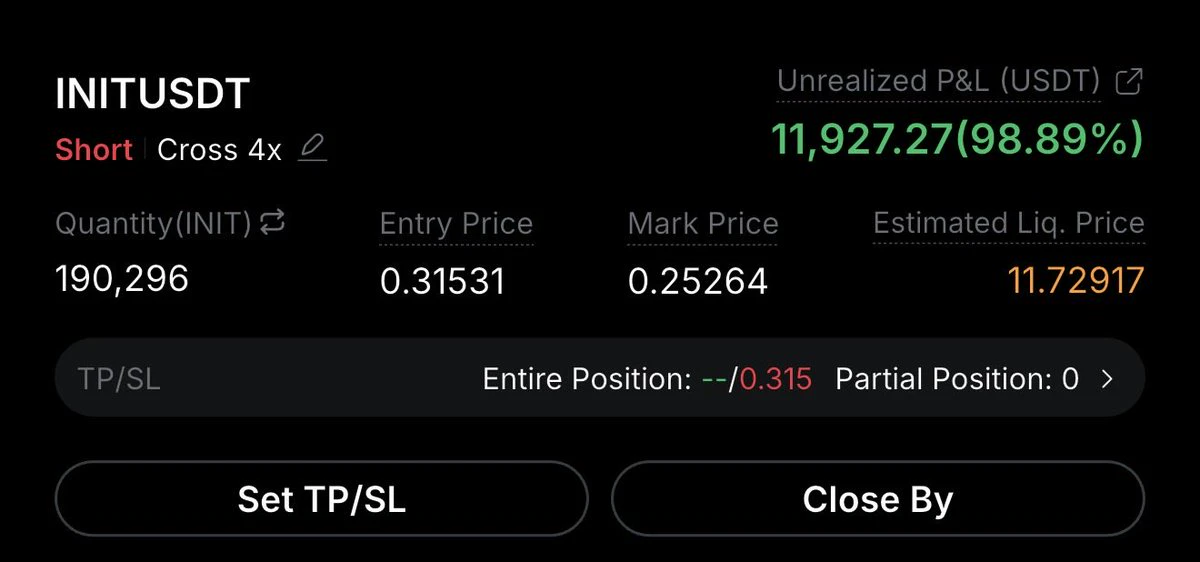
$INIT Short Update 🔥‼️
By Professor Profit
I shorted INIT at $0.315 with 3X Leverage an hour ago in VIP Channel. It just started dumping badly!
FTP: $0.2-$0.15
I (P.P) keep nailing!
#INIT $PIEVERSE $INIT $JCT #JCT $HYPE $AKE $ICNT $AXIS $ELSA $XRP $PEPE $DOGE
post-image
INIT-1.74%
PIEVERSE+0.58%
JCT-3.26%
HYPE+0.24%
AKE+6.07%
GN
Anyone who’s going to give up should just give up already
post-image
CPI data: BTC/ETH key bull-bear levels at a glance
live-cover
LIVE47
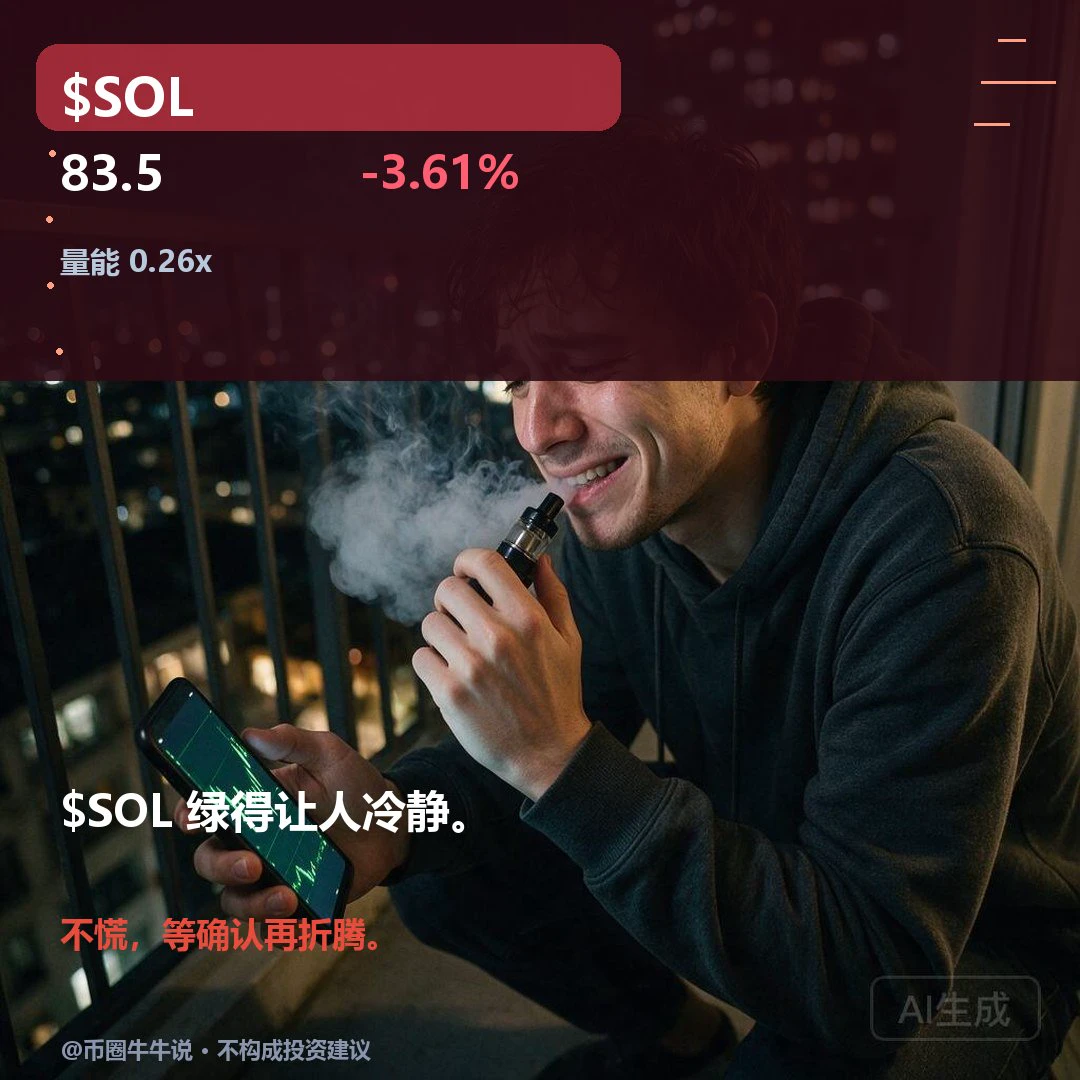
$SOL Currently at 83.5, down 3.61% over 24H. The 1H trend is weak, with EMA20 at 84.2, RSI at 32, and resistance at 87.03; the 4H trend is weak, with EMA20 at 86.5, RSI at 31, resistance at 90.67, and support at 81.34. Volume is only 0.26x the average. If price holds above 87.03, a rebound may be worth watching; a break below 81.34 would signal short-term weakness. In the follow-up review, watch whether 87.03 holds and whether price can recover after losing 81.34; volume at 0.26x the average still needs confirmation. Market volatility is high; for observation only.
post-image
SOL-0.77%
BTC market update
live-cover
LIVE1,065
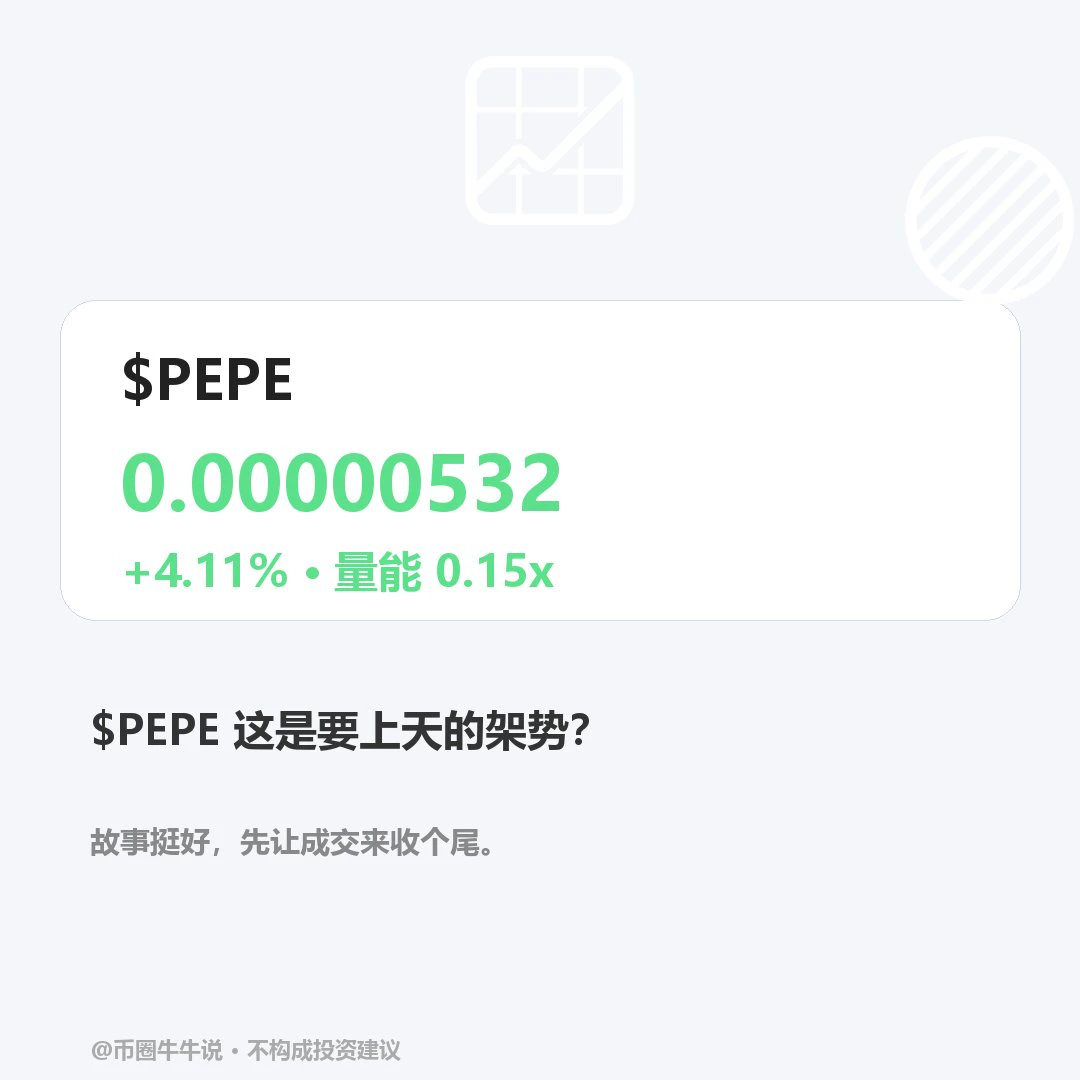
$PEPE Currently at 0.00000532, up 4.11% over 24H. The 1H trend is relatively strong, with RSI at 48 and EMA20 at 0.00000527; the 4H trend is relatively strong, with RSI at 60 and EMA20 at 0.00000514. Resistance is at 0.00000562, with support at 0.00000506/0.00000478. Volume is only 0.15x the average. If the price holds above 0.00000562, watch for further upside; a break below the 0.00000506 support would weaken the short-term outlook. In a follow-up review, watch whether the price can hold above 0.00000562 and reclaim 0.00000506 after losing it; volume at 0.15x the average still needs confirma
post-image
PEPE+0.97%
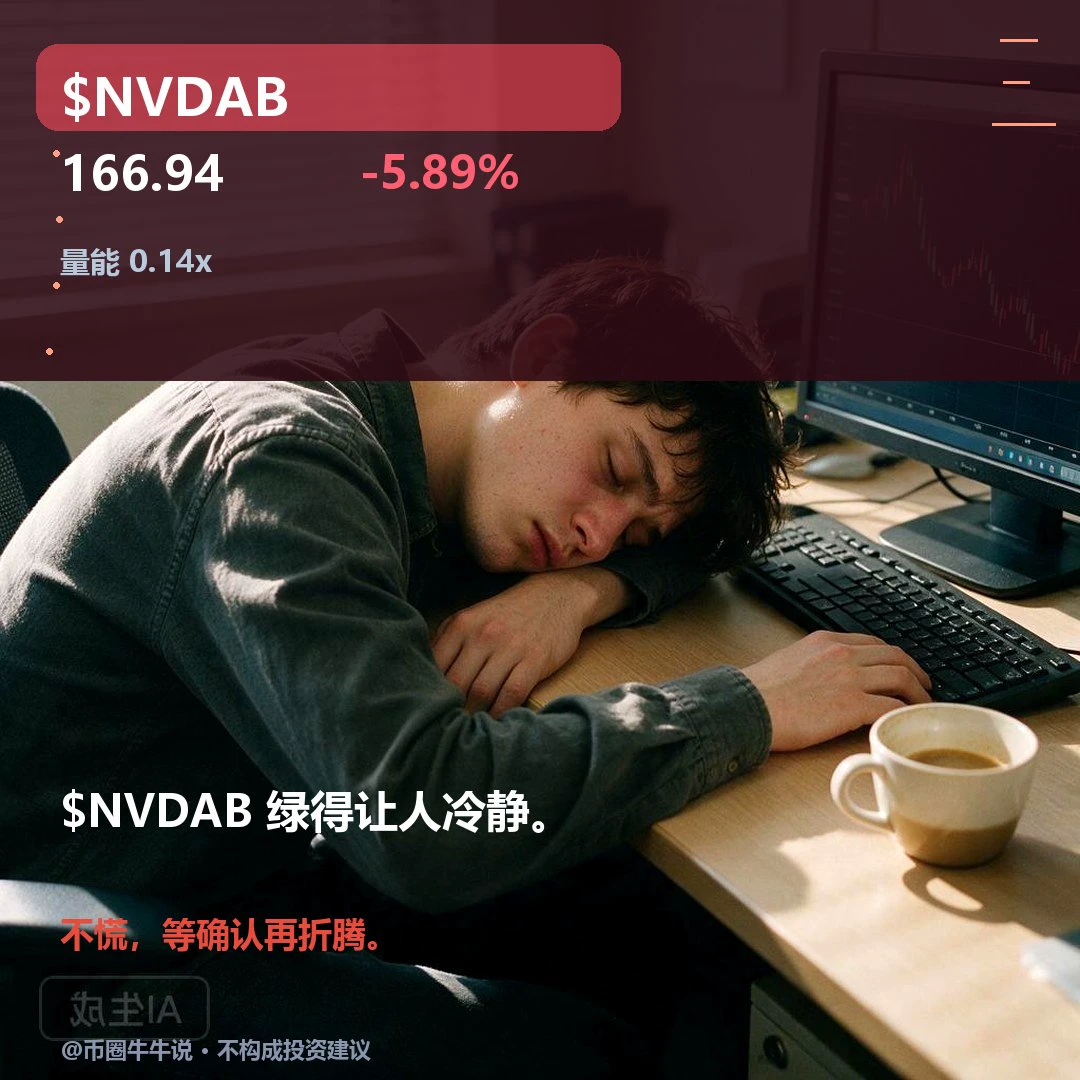
$NVDAB Currently at 166.94, down 5.89% over 24H. 1H is weak, with RSI at 17.7 and EMA20 at 173.8; 4H is weak, with RSI at 24.8 and EMA20 at 179.0. Resistance: 183.36/189.09; support: 166.11. Trading volume is only 0.14x the average, so the single-line signal needs confirmation. If price holds above 183.36, watch for a rebound; if it breaks below 166.11, the short-term outlook weakens. In the next review, watch whether 183.36 holds and whether price can recover after losing 166.11; volume at 0.14x needs confirmation. Market volatility is high; for observation only.
post-image
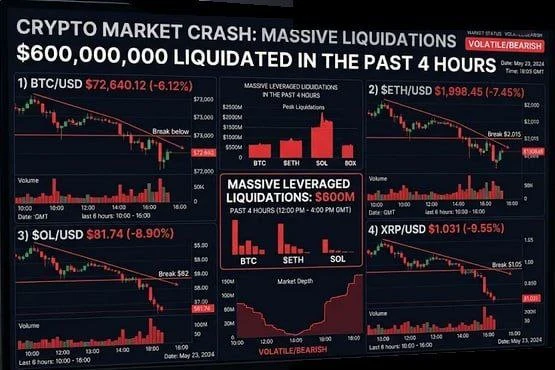
🚨 CRYPTO BLOODBATH.
The market is getting REKT:
🔻 bitcoin:native below $73K
🔻 $ETH below $2,015
🔻 $SOL below $82
🔻 $XRP below $1.05
💥 $600M in leveraged positions wiped out in just 6 hours.
Who's buying the dip?
post-image
BTC-0.65%
ETH-1.23%
SOL-0.77%
XRP-1.15%
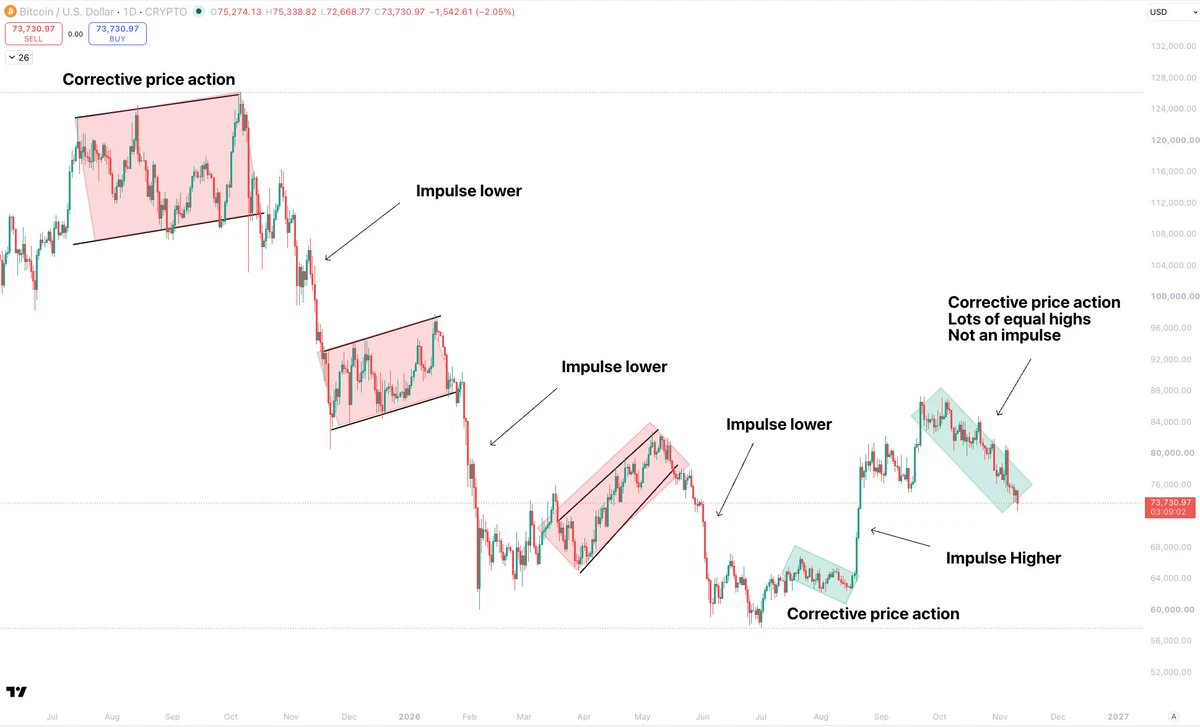
This move looks so corrective to me.
Price action is actually fairly simple to dissect.
Bitcoin spends most of its time correcting, and a very small amount of time actually making moves, or impulsing.
In a downtrend, you get long periods of corrective PA that chops higher in bear flags, followed by very aggressive impulses lower.
The bear flags take out upside short liquidity, and then they drop very fast, not allowing anyone time to get positioned, and not leaving behind any liquidity.
In an uptrend, the same works just in reverse. You can see very clearly how this works by how i have highlig
post-image
BTC-0.67%
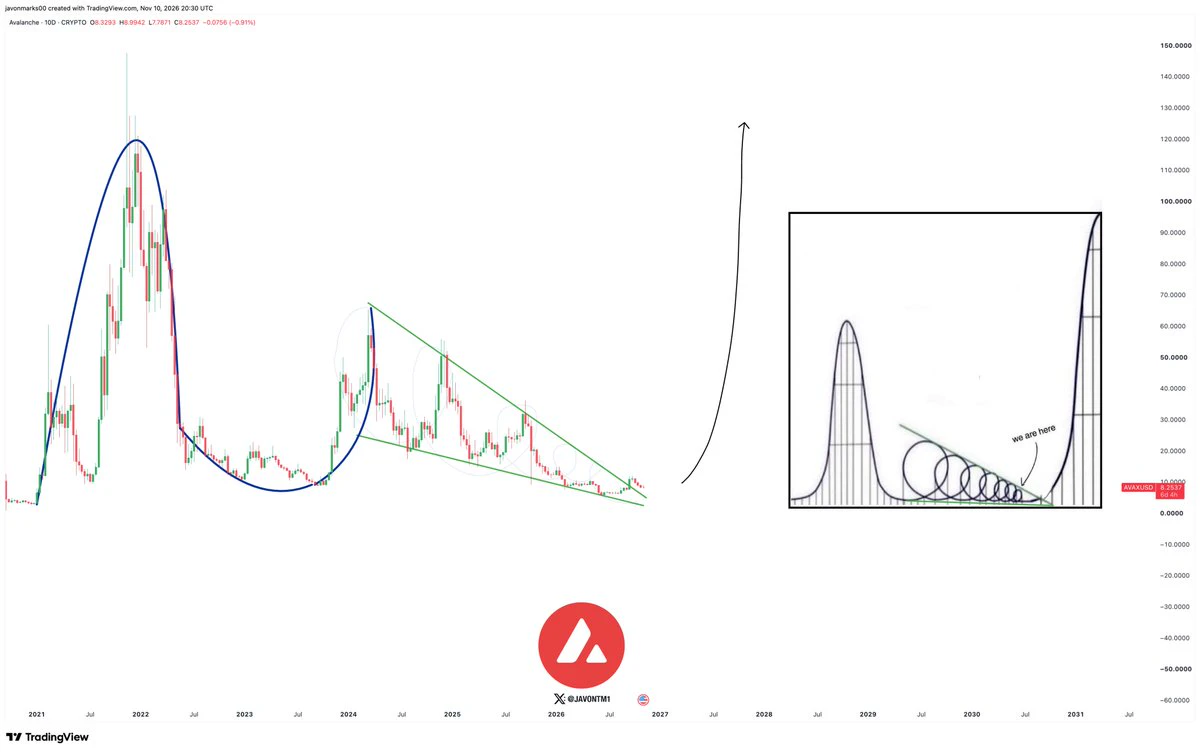
$AVAX could be preparing here for a monstrous move towards All Time Highs!
That'd be a more than 1,100% increase...
(Avalanche)
post-image
AVAX-0.10%
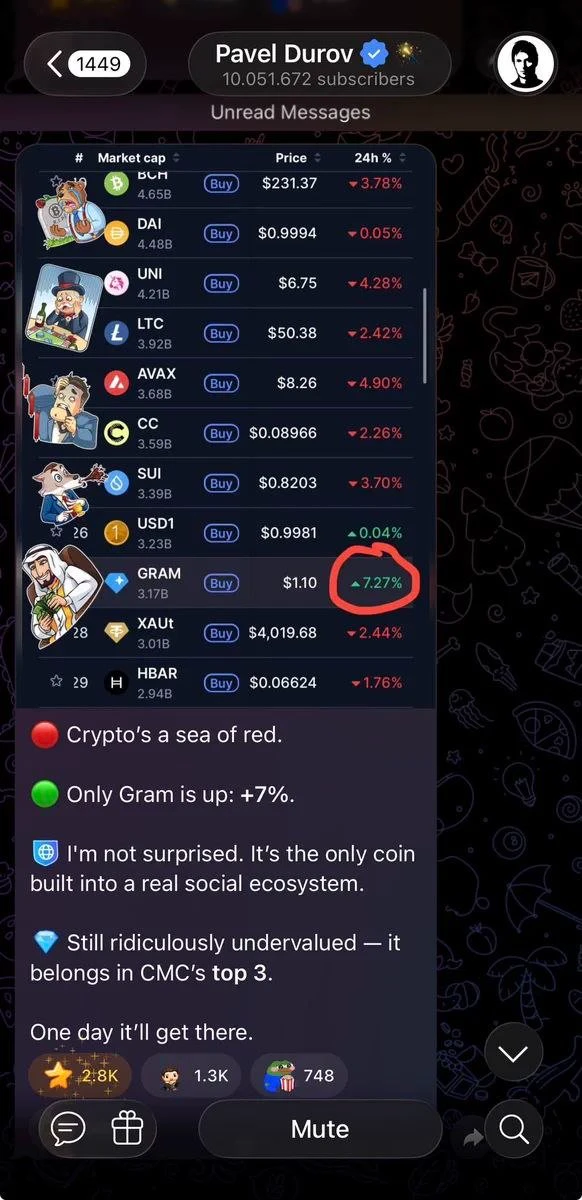
.@durov is shilling the-open-network:native to 10M subscribers 👀
post-image
JUST IN: Microsoft officially surpasses Nvidia to become the world's second most valuable company by market cap.
$MSFT : $4.035 trillion
$NVDA : $4.032 trillion
MSFT-2.15%
NVDA-5.47%
Big Shark Trading Journey
Tutorial Video
solana:DLjVQ4naEGR5ykUvfWNVggQMcyyuwQqX7ZYHGoaDpump
I admire the teams work to make a super professional and easy to use bot that allows you to trade automatically and freely.
Dev is a chad too!
CA:
DLjVQ4naEGR5ykUvfWNVggQMcyyuwQqX7ZYHGoaDpump
post-image
SOL-0.77%
#BTC
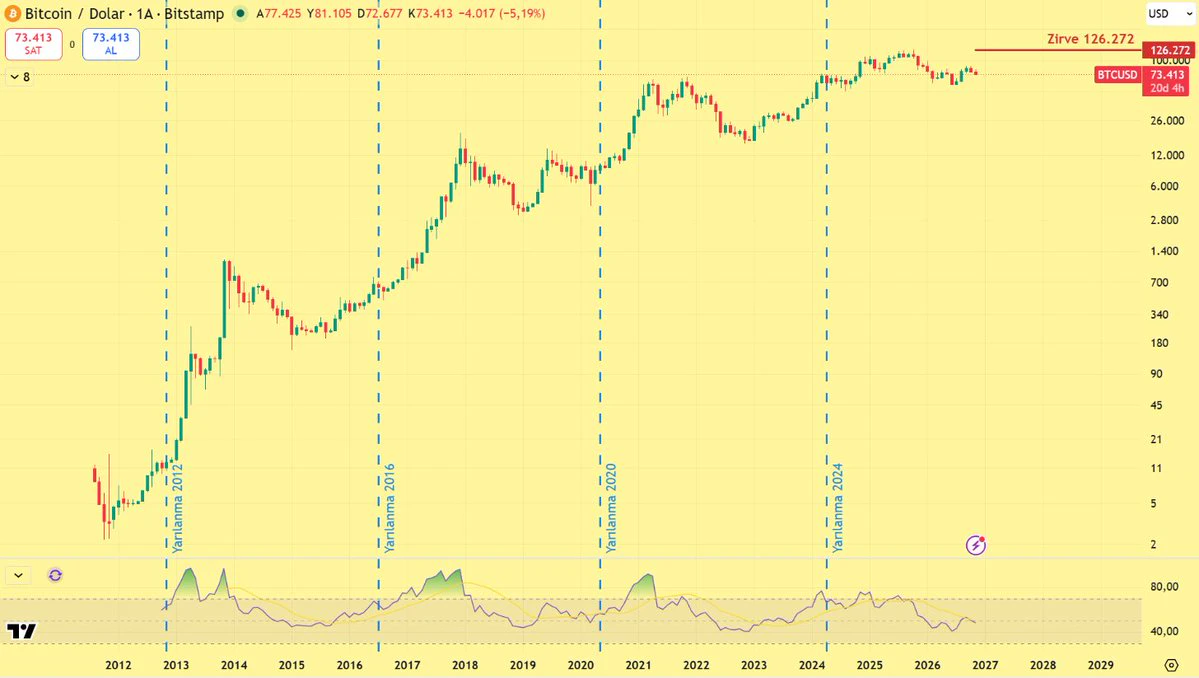
934 days since the halving.
Folks, let's read the cycle for Bitcoin $BTC through the halving calendar once again.
Time from halving to peak:
526 days after the 2016 halving.
548 days after the 2020 halving.
534 days after the 2024 halving.
In all three cycles, the peak came about a year and a half after the halving. This cycle followed the calendar too.
Time from halving to cycle bottom:
889 days after the 2016 halving.
924 days after the 2020 halving.
934 days have passed since the April 20, 2024 halving. We have passed the days when the bottom came in the previous two cycles. The botto
post-image
BTC-0.67%
Load More

Join 40 M users in our growing community

⚡️ Join 40 M users in the crypto craze discussion

💬 Engage with your favorite top creators

👍 See what interests you

Trending Topics

GateGlobalComplianceExpansion

9.31k Views262 Discussing

Gate continues to expand its global compliance footprint, now covering 81 regulated jurisdictions across Europe, North America, Asia, and Oceania. From MiCA and U.S. state-level MTLs to Japan’s FSA, Dubai, and Australia-related regulatory approvals, global exchanges are entering a new stage of compliance competition. Do you think regulatory strength will become as important as products and liquidity for exchanges in the future?

USCPIDataIncoming

71.36k Views2.4k Discussing

USIranTalksShowNewProgress

18.12k Views1.33k Discussing

View More