Share your thoughts
placeholder
Article
#BTCReclaims80K
#BTC ‌The $80K Battle Is Getting Interesting
Bitcoin is trading around $79,950, with the current session holding a relatively tight range between roughly $79.5K and $80.1K. After the recent recovery from the June lows, BTC has managed to return to the $80K area, but the real question now is whether buyers can turn this level into support rather than another temporary resistance zone.
The broader structure is constructive, but it is not risk-free.
One of the strongest factors supporting BTC right now is institutional demand. U.S. spot Bitcoin ETFs recorded approximately $730.8
BTC+0.43%
  • 1
Everyone’s still long H/USDT—but the daily trend just flipped bearish under your feet.

H/USDT - SHORT

Trade Plan:
Entry: 0.07543 – 0.07607
SL: 0.07882
TP1: 0.07344
TP2: 0.07191
TP3: 0.06960

Why this setup?
Why now? The 4h structure is screaming SHORT with 95% confidence. RSI on the 15m already broke down to 38.87—momentum is fading, not pausing.
- Entry zone: 0.07575 (tight range 0.07543–0.07607).
- Targets: TP1 0.07344 → TP2 0.07191 → TP3 0.06960.
- Invalidation only above 0.07934—so we have a massive 4.5% buffer before this thesis dies.
The ATR (0.001281) tells us the next move
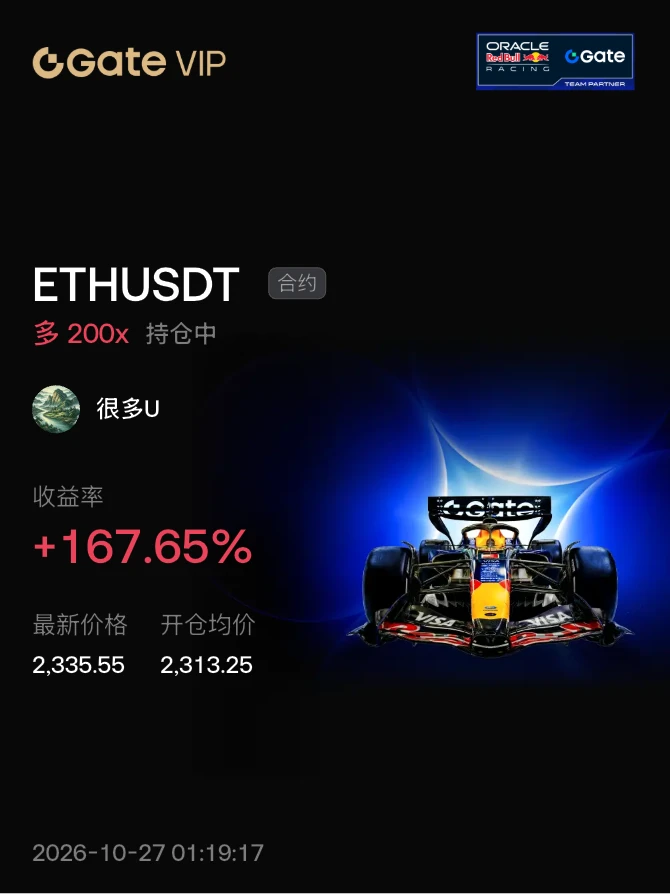
Day 1 of the challenge to trade crypto with $ETH 2000 in principal to buy a Mercedes-Benz E300
ETH+2.01%
🚀 🚀 🚀 𝐌𝐚𝐫𝐤𝐞𝐭 𝐀𝐧𝐚𝐥𝐲𝐬𝐢𝐬 | 𝐏𝐎𝐍𝐒/𝐔𝐒𝐃𝐓
Pons ($PONS ) is holding strong bullish momentum near $0.931, consolidating closely beneath its recent peak barrier of $0.972. Sustained buying interest driven by Robinhood Chain activity and whale wallet accumulation continues to absorb selling pressure, setting up an immediate retest of local all-time highs.
📊 𝐊𝐞𝐲 𝐌𝐞𝐭𝐫𝐢𝐜𝐬
• Current Price: ~$0.931
• Market Cap: ~$650M – $665M
• 24H Range: $0.683 – $0.972
• Market Bias: Bullish / Breakout Retest 🐂⚡
📈 𝐓𝐞𝐜𝐡𝐧𝐢𝐜𝐚𝐥 𝐇𝐢𝐠𝐡𝐥𝐢𝐠𝐡𝐭𝐬
• Structural Momentum: Price acti
PONS+40.32%
$4 Signal: 1H pullback holding, buy-the-dip long setup
$4 1H pullback to the Bollinger middle band, with the current price of 0.030874 entering the support zone. Funding rate is 0.0351%, and OI is flat. Order book imbalance is -20.76%, with slightly heavier sell orders; the 1H MACD histogram has compressed back toward the zero line, and downside momentum has been exhausted. 4H RSI is 72.48, 1H RSI is 58.79, and the trend structure remains intact.
🎯Direction: Long
⚡Entry/limit order: 0.03078138 - 0.03087400
🛑Stop-loss: 0.02933030
🚀Target 1: 0.03318955
🚀Target 2: 0.03434732
🛡️Trade manageme
post-image
4+8.66%
BTC+0.42%
ETH+2.01%
SOL+2.07%
JUST IN: Suspected a16z wallet adds to HYPE holdings, now staking 5.201M HYPE (~$445M) with avg entry ~$67.2 and ~($95M) unrealized gain. Watch for potential VC-led liquidity and market persistence in HYPE flows. $HYPE
post-image
HYPE+1.40%
MARKET ALERT - GWEI
​4-Hour Timeframe Analysis (4H)
​Condition: The short-term trend is tending upward (bullish recovery). The price is at 0.026826, trading above EMA20 (0.025552) and EMA50 (0.024935).
​Constraint: Rejection occurred right around EMA200 (0.027370), with a fairly long upper candle wick, indicating that selling pressure remains high in that resistance area.
​1-Day Timeframe Analysis (1H / 1D)
​Condition: The long-term trend remains in a dominant downtrend/lower consolidation phase.
​Positive Signal: The price has begun to hold and break above EMA20 (0.024854), but remains far be
GWEI+4.97%
ETH+2.00%
BTC+0.43%
  • 5
  • 1
#GateTops7DayNetInflowsGloballyGate Tops 7-Day Net Inflows Globally | Strong Capital Flow Signals Growing Market Activity
Gate is once again making headlines in the crypto market as it ranks among the global leaders for 7-day net inflows.
Net inflows are an important metric for understanding how much capital is moving into a centralized exchange over a specific period. When an exchange records strong positive inflows, it can reflect increasing trading activity, capital allocation, and user participation across its ecosystem.
💰 Why Are 7-Day Net Inflows Important?
The 7-day net inflow metric
Everyone’s chasing silver’s rally—but the 4H tape just flipped on $XAG /USDT, and the exit door is narrower than you think.

$XAG /USDT - SHORT

Trade Plan:
Entry: 66.26 – 66.32
SL: 66.55
TP1: 66.09
TP2: 65.96
TP3: 65.77

Why this setup?
Why now? The 1D trend is *range*, not breakout—so this 66.29 reference is a pivot, not a launchpad.
- RSI on the 15m (57) is cooling, not accelerating—momentum is stalling into resistance.
- ATR (0.108) shows volatility is compressing; that’s a spring, but the bias says it snaps *down* first.
- Targets sit at 66.09 (TP1) and 65.96 (TP2)—a clean 0.3% d
XAG+0.02%
$MARSCOIN Signal】Long + order book imbalance/1H momentum reversion
$MARSCOIN Order book imbalance 19.33%, bids providing support, 1H MACD histogram narrowing.
🎯 Direction: Long
⚡ Entry/limit order: 0.2436269 - 0.2443600
🛑 Stop-loss: 0.2419164
🚀 Target 1: 0.2480254
🚀 Target 2: 0.2498581
🛡️Trade management: - Execution strategy: Take 50% off at Target 1 and move the stop-loss to breakeven. Exit if price falls back to the entry level.
Funding rate 0.0311%, OI stable. 4H volume expanded, followed by a low-volume pullback; 1H RSI at 61, not overbought. Risk-reward ratio 1.5; with proper pos
post-image
MARSCOIN+31.37%
BTC+0.42%
ETH+2.01%
SOL+2.07%
#Gate60MillionUsers Gate60MillionUsers — A Major Milestone for Gate!
Gate has reached an incredible milestone of 60 million users, marking another major chapter in the platform’s global growth journey. 🎉
Reaching 60 million users is more than just a number — it reflects the growing adoption of crypto trading, Web3 products, and digital assets around the world. As more users enter the crypto ecosystem, platforms like Gate continue to expand their products and services to meet the needs of a rapidly evolving market.
From spot trading and futures to Web3, Earn products, Launchpad, Gate Live, an
post-image
  • 1
Whale 0x6750 bought 174,826 $HYPE ($15.01M) 8 hours ago and staked it all.
post-image
HYPE+1.40%
  • 1
Crypto Signals and Trding Insights
live-cover
LIVE1,544
Four signals 🔥 to understand current crypto market changes!
A roundup of four industry trends worth watching closely recently 👇
✅ Morgan Stanley continues increasing its BTC holdings
It has accumulated a total of 355 BTC over the past 4 days, while spot BTC-ETF net inflows continue. The single-day increase is not explosive, but the consistency is what matters. Traditional institutions are steadily entering the market in batches. Short-term inflows do not yet mean the trend has completely reversed.
✅ Fierce competition for USDH issuance rights
Several major players, including Paxos, Frax, and
post-image
BTC+0.43%
HYPE+1.39%
SNDK+11.88%
[New Streamer] ARB Bullish Market Updates
live-cover
LIVE1,691
Everyone’s watching $MU /USDT at 1017—but the 4h chart just flipped a silent sell signal.

$MU /USDT - SHORT

Trade Plan:
Entry: 1016.31 – 1017.79
SL: 1026.32
TP1: 1010.10
TP2: 1005.47
TP3: 998.52

Why this setup?
Why now?
- 1D trend is *range*, not breakout—so longs above 1017 are chasing air.
- RSI (15m) at 51.46 shows zero momentum; the bounce is already stalling.
- ATR (1h) = 2.97 means volatility is compressed—perfect setup for a snap to TP1 at 1010.10.
- Confidence 77.4% with entry zone 1016.31–1017.79—we’re inside the kill box right now.

Debate:
If price taps 1017.79 and re
MU+0.59%
#BTCReclaims80K
BTC Reclaims 80K: Full Market Analysis, September 6 2026
Bitcoin is standing right on the psychological 80,000 line again. Early Saturday September 6, BTC trades near 79,980 on spot markets, up about 0.4 percent in 24 hours after tagging 80,200 earlier in the session. The reclaim story is not clean: BTC broke back above 80K on Wednesday, lost it violently on Friday's jobs report, and is now rebuilding above 79,500. That two-step-forward, one-step-back rhythm says it all: the institutional bid is real, but macro headlines still hold the steering wheel.
The weekly scoreboard put
BTC+0.42%
  • 1
A few days ago, my hand trembled slightly as I set the stop-loss; this morning, I realized that filial gesture was unnecessary.

I had just opened the app, and $SOXS had already slid to 46.2, delivering a profit of +289.31%. The brothers on board must have woken up laughing; this round of staying up late wasn't in vain, and I finally got the rhythm right for once.

When the market was just being dumped in the early session, many people rushed to catch the falling knife, but I kept my eyes fixed on that repeatedly tested top. Every time the price surged, it fell just short, the rebound lacke
post-image
SOXS-1.41%
DOGE+7.05%
ADA+4.75%
No vision, can’t hold on—the profit on this move is as thin as paper, but I love it to death. The $CYS short I opened when the sell-off started in the early session at 0.4520 has now moved to 0.241, with a return of +919.15%.🎯

It wasn’t a blind short. Every upward push fell just short, while volume kept getting weaker—a classic sign of a feeble rebound. I said not to chase longs; waiting for signs of resistance before shorting is what feels good.

I just closed 70% first and moved the stop-loss on the remaining 30% to above the entry price. The prerequisite for compounding is staying aliv
post-image
CYS-1.96%
ETH+2.00%
LAB+1.92%
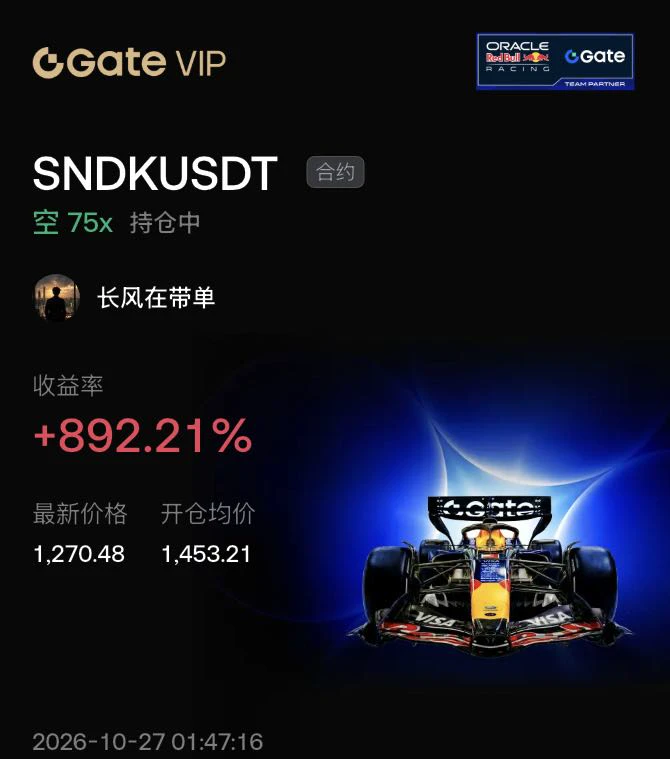
A few days ago, my hand trembled as I set the stop-loss; this morning, I realized that was unnecessary filial piety.
While everyone was still waiting on the sidelines, I saw that $SNDK had moved sideways at the bottom for a long time without breaking a key level—a classic bottoming structure. I went long around 1500.51 at the time. The logic was simple: a bottom that cannot be broken is a bottom to buy into; let those who missed the move keep the fear.
I just checked the chart, and the current price has already surged to 1765.13, with a +1253.15% return showing in the account. This result says
post-image
SNDK+0.91%
XRP+1.35%
BTC+0.43%
Load More

Join 40 M users in our growing community

⚡️ Join 40 M users in the crypto craze discussion

💬 Engage with your favorite top creators

👍 See what interests you

View More