



Share your thoughts
placeholder
Article
CPI news delivered a major move in both directions, but the bigger picture is still worth watching.
Bitcoin could still revisit the $69K area, especially with major events ahead:
• Clarity Act outcome
• FOMC meeting
The $69K zone has strong confluence. The inverse Head and Shoulders retest, 200-week EMA, previous ATH support, and the FVG are all lining up around this level.
Trade Setup: LONG from support
Entry Zone: $69,000–$70,500
Stop Loss: Below $67,500
TP1: $74,000
TP2: $78,000
TP3: $81,000
A clean hold above the $69K support zone could set up a strong move toward higher resistance levels.
post-image
BTC+0.58%
[Price Trend Analysis]
1. Candlestick Patterns:
- On the 4-hour chart, the candlestick at 20:00 on September 11 was a small-bodied bullish candle, with the closing price near the high, indicating that upward momentum is continuing, although the gains have narrowed.
- On the 1-day chart, the candlestick for September 11 was a huge-volume bullish candle that almost entirely erased the losses from the previous few days, reaching a high of 2666, showing extremely optimistic market sentiment, while the long upper shadow also indicates resistance above.
2. Technical Indicators:
- MACD: On the 4-hour
BTC+0.58%
ETH+2.62%
  • 7
I was just about to go in and curse it out, but then I looked at my account and thought, forget it—let it dump however it wants, I’ll keep quiet.

A few days ago in the afternoon, $JCT surged to a high, but volume didn’t follow and selling pressure above was obvious. I said to go long, but leaned bearish and expected a pullback.

It was pressured down from 0.002429 all the way to 0.001519, with the short position showing a floating profit of +918.68%. The timing was spot-on, and that profit felt great.

Close 80% first, leave the remaining +918.20% protected at breakeven. If it keeps dumpi
post-image
JCT+3.98%
BNB+2.56%
ETH+2.62%
CoinGecko trending searches gave $AI a boost, but volume was only a little over 30% of the monthly average: popularity didn't bring money
Good grief, CoinGecko trending searches pushed $AI up, but the market only gave it 2.31%—138681 USDT in 24h, with a volume ratio of 0.335; the money hasn't followed the hype. Direction: without volume below 0.018, I only lean bearish.

Trending searches bring traffic, not buying pressure. Volume on the 15-minute chart contracted three times in a row: 80552→37428→14788, while the average volume over the previous hour was still 101351. RSI is weak at 39, MA
AI+0.45%
Whoever this $2,510 $ETH seller is, I hope you lose your private keys.
post-image
ETH+2.63%
Today's Financial News and Crypto Updates
live-cover
LIVE70
$PI Even the bull has come to 0.127.
post-image
PI-0.68%
The ETF launched by platform #ETH5S is very unfair.
ETH5S-15.86%
JUST IN: Goldman Sachs sticks with a year-end 2026 gold price forecast of $4,900/oz, citing strong central-bank demand and potential ETF inflows; hedging mechanics could amplify moves, with risks from Fed rate expectations. $XAU USD
post-image
XAU+0.58%
$ETH Took another bite of meat, keeping a core position to see if there’s any more to eat ‌
ETH+2.62%
Insiders are quietly stacking shorts on PONS while the range traps longs.

$PONS /USDT - SHORT

Trade Plan:
Entry: 0.6028 – 0.6170
SL: 0.6781
TP1: 0.5587
TP2: 0.5246
TP3: 0.4734

Why this setup?
Why now? The 1h price sits at 0.6099 inside the entry zone, the 15m RSI reads 61.06 showing hidden momentum, and the 1h ATR of 0.028429 confirms enough volatility for a clean move. The daily trend is range, which means a directional break from this entry can run toward the first target at 0.5587 and the deeper target at 0.5246. The invalidation level is the line in the sand at 0.6781, and anything a
PONS-2.35%
This return has me feeling both thrilled and terrified, worried the market will wake up tomorrow and blacklist me. While everyone else was running, $BNB quietly emerged from a structural bottom: buying pressure kept intensifying, and pullbacks barely gave anyone a chance to hesitate.
The range I gave at the time was around 641.25, and after placing the order, I stopped letting it affect my mindset. I opened the chart today to find the current price at 729.05, with the floating profit on this position reaching +972.21%. Luck is determined by the market, but the plan was set in advance.
Reviewi
post-image
BNB+2.56%
ADA+0.78%
ETH+2.62%
A few days ago I was still calculating whether I had enough money for this month’s instant noodles; this morning I was already wondering whether to add sausage🍜. The confidence didn’t come from predicting anything, but from seeing before bed a few days ago that $BOME ’s rebound clearly couldn’t push any higher, with volume continuously shrinking and the bull-trap vibes being way too strong. I felt something was off then, so I put on a short in the opposite direction, locking in a cost of 0.0011263. When I opened the chart this morning, brother, 0.0008595 was sitting right there, with returns
post-image
BOME+3.18%
ETH+2.62%
ZEC+5.24%
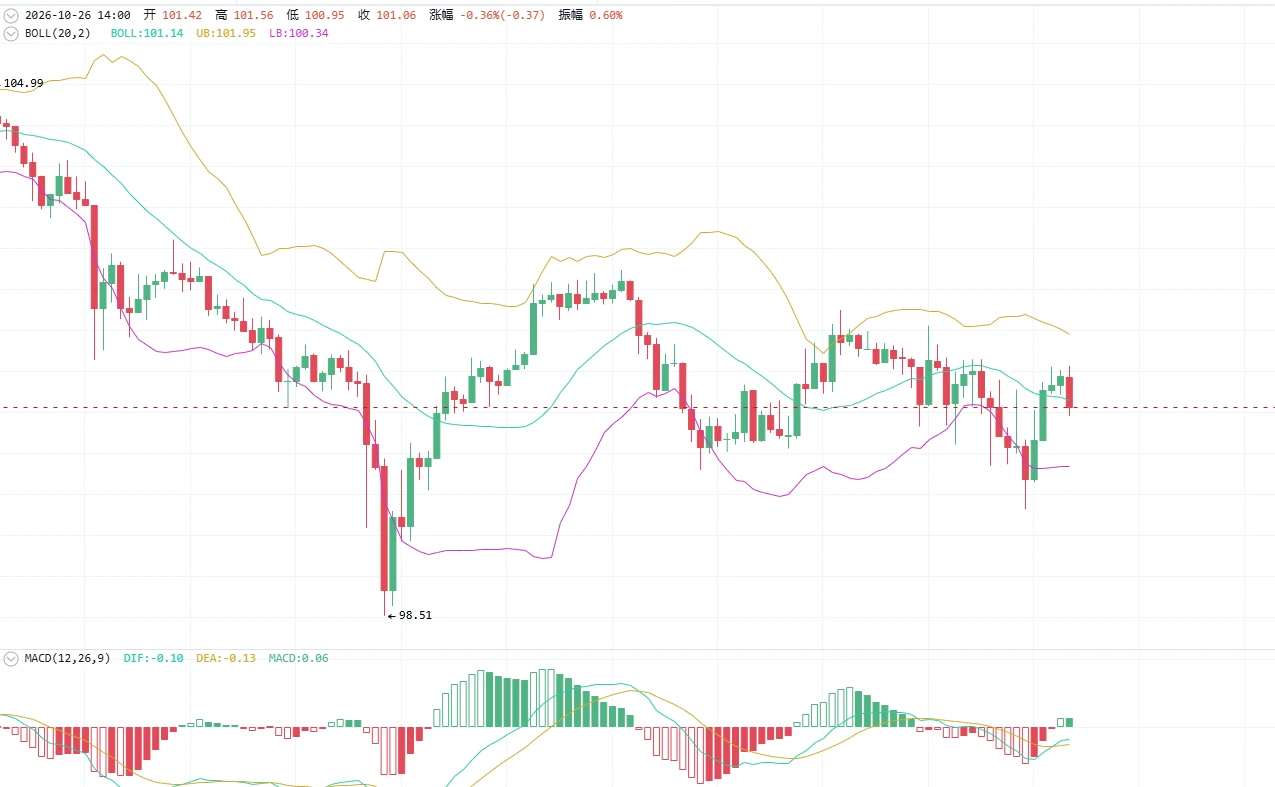
Yang Guang bit | September 12 $SOL CPI surged sharply back to 102, with the 100 level fluctuating ahead of FOMC
【Today’s Plan】
Entry timing: Position for shorts on a rebound into the 103.3—104.0 range
Stop-loss: Above 104.8
Staggered take-profit:
First target: 101.3—101.8
Second target: 100.0—100.5
Key conclusion
Geopolitically, the US-Iran conflict is trending toward becoming protracted; however, SOL, as the high-beta altcoin leader, has virtually no safe-haven appeal. Geopolitical conflict suppressing risk appetite constitutes an indirect bearish factor, and its high beta means that once the
post-image
SOL+3.20%
#AugustCoreCPIBeatsExpectations What the Latest Inflation Data Means for Markets
The Headline That Matters
The U.S. Bureau of Labor Statistics released its August 2026 Consumer Price Index report on September 11, and the core reading came in hotter than expected. Core CPI, which excludes volatile food and energy prices, rose 0.3% month-over-month, surpassing the 0.2% consensus forecast. On a year-over-year basis, core inflation registered 2.4%, a modest step down from July's 2.5% reading but still above the Federal Reserve's 2% target.
The headline CPI rose 0.4% month-over-month, matching exp
post-image
ZEC/USDT
ZEC is showing a strong recovery on the 15-minute chart after bouncing from the $1,054.57 low. Price is currently around $1,153, with a sharp bullish candle pushing above the short-term moving averages.
The key point here is the volume-backed breakout. MA5 is around $1,113.59, while MA10 and MA30 are near $1,105.63–$1,105.73, giving the current move a stronger bullish structure as long as ZEC holds above this zone.
Key levels I’m watching:
• Current price: $1,153
• Immediate resistance: $1,177–$1,183
• Major resistance / 24H high: $1,216.52
• Support: $1,113–$1,105
• Stronger support
post-image
ZEC+5.34%
$BTC Signal】Short: 1H moving-average pressure + rejection at the 77250 upper edge
$BTC The 1H price is consolidating narrowly between 77080-77250, with EMA20 at 77381 and EMA50 at 77586 exerting pressure from above. RSI is 47.61 on 1H and 41.50 on 4H, with momentum not yet recovered. Order-book depth imbalance is 76.58%, selling pressure above 77250 is persistent, and chasing buy orders are shrinking. The 4H Bollinger midline is 77803, with price continuing to trade below it. The MACD histogram has just turned positive, so chasing shorts risks getting caught in a rebound. OI Stable, with the
post-image
BTC+0.58%
Futures Trading Competition (Season 2)
First Place Prize: 2,888 USDT
Second Place Prize: 1,888 USDT
Third Place Prize: 666 USDT
Starting capital of $200, trade all types of futures for one month. Rewards will be awarded based on the highest returns.
  • 10
Has the crypto world’s reputation gotten that bad? 😂😂😂
Load More

Join 40 M users in our growing community

⚡️ Join 40 M users in the crypto craze discussion

💬 Engage with your favorite top creators

👍 See what interests you

View More