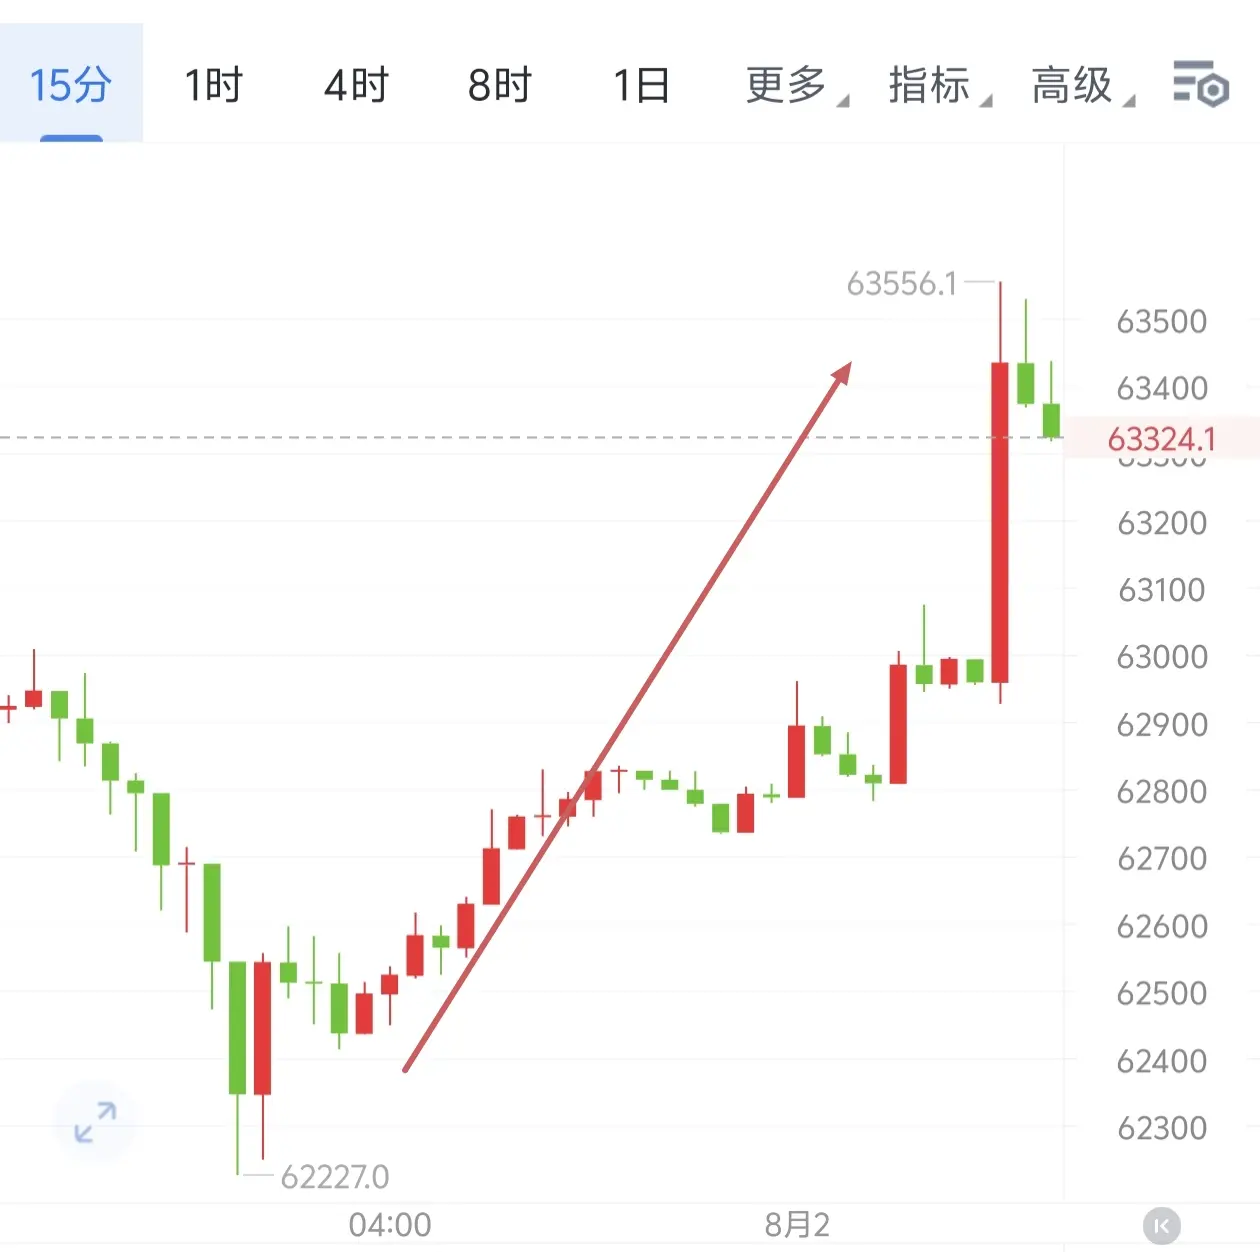
BTC on August 1 traded sideways and ranged intraday without a clearly noticeable breakout. It continued to oscillate within the 62,815 to 63,125 range. Looking back at July’s overall performance: a total of fifteen ?4? (left: 15 ?4?; combined 19 ?1? )—a total gain of about 22,100 + 960 points.
$BTC Mingyuan 8/1 evening: around 62,700-62,300 ?; looking at 63,500-64,300.
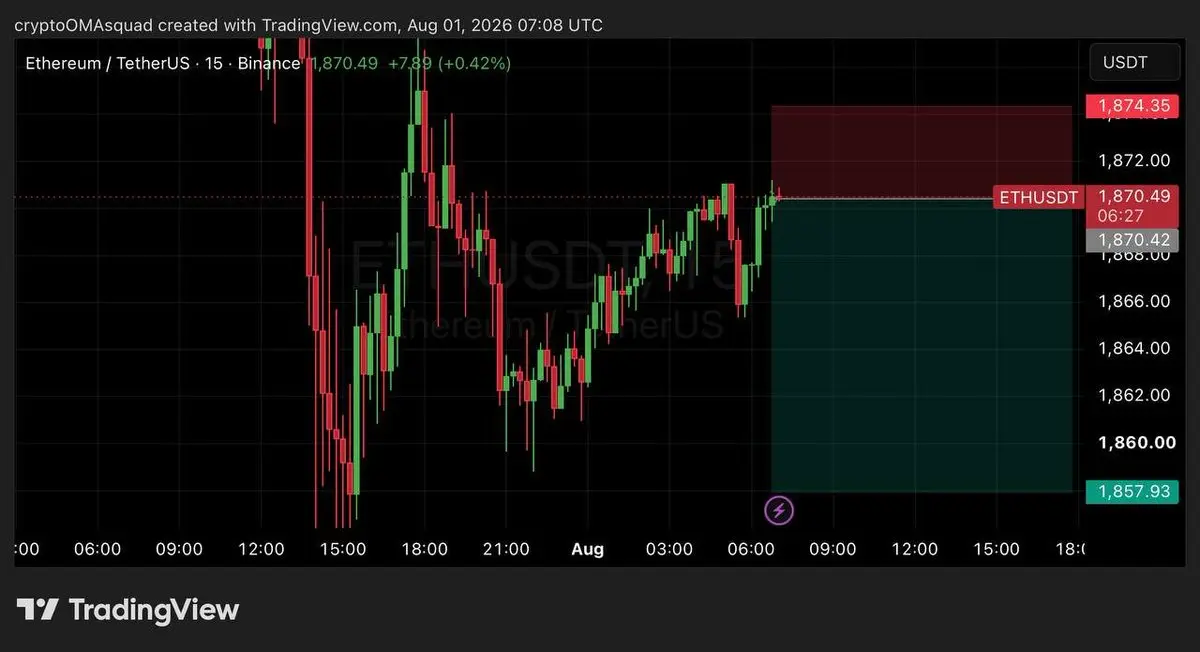
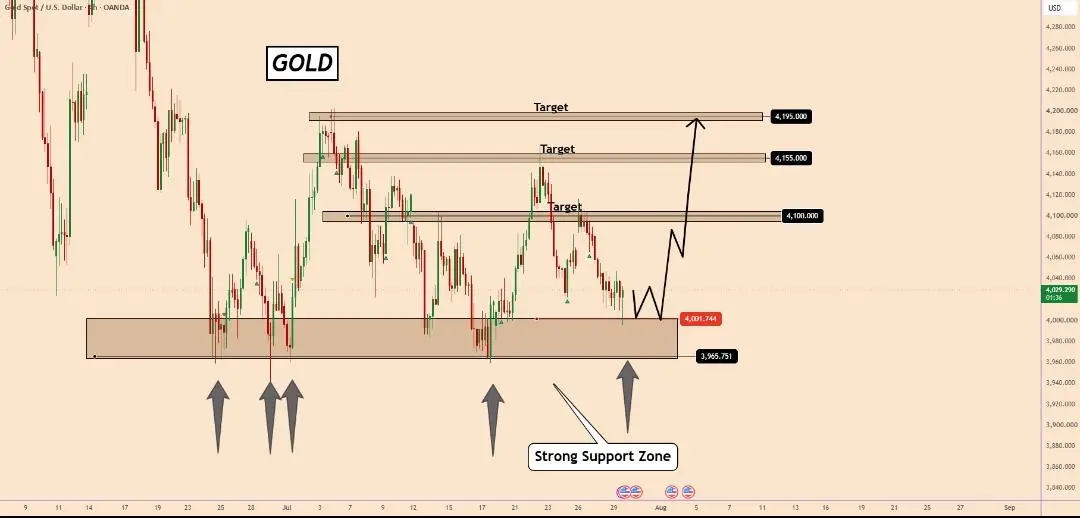
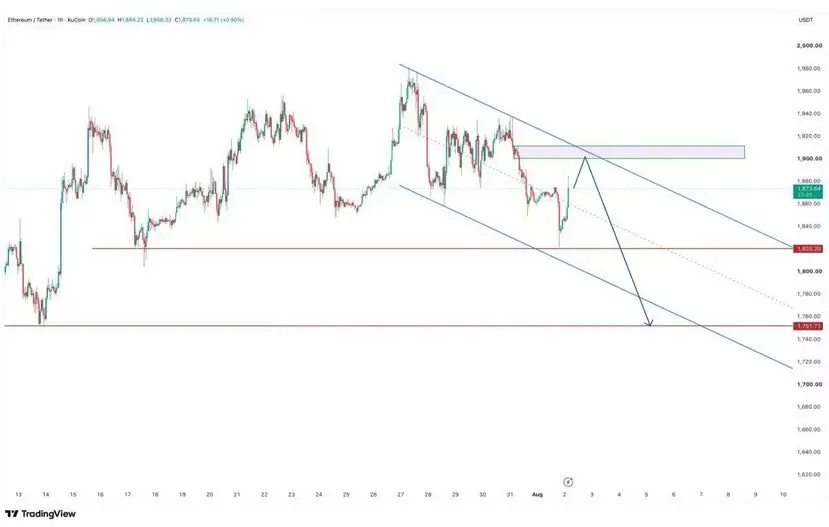
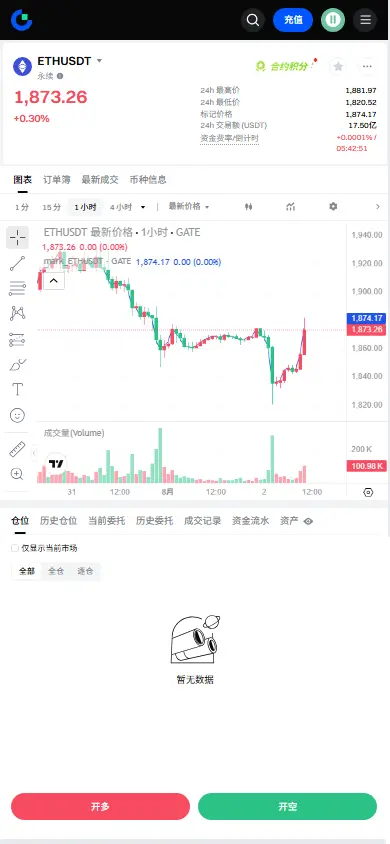
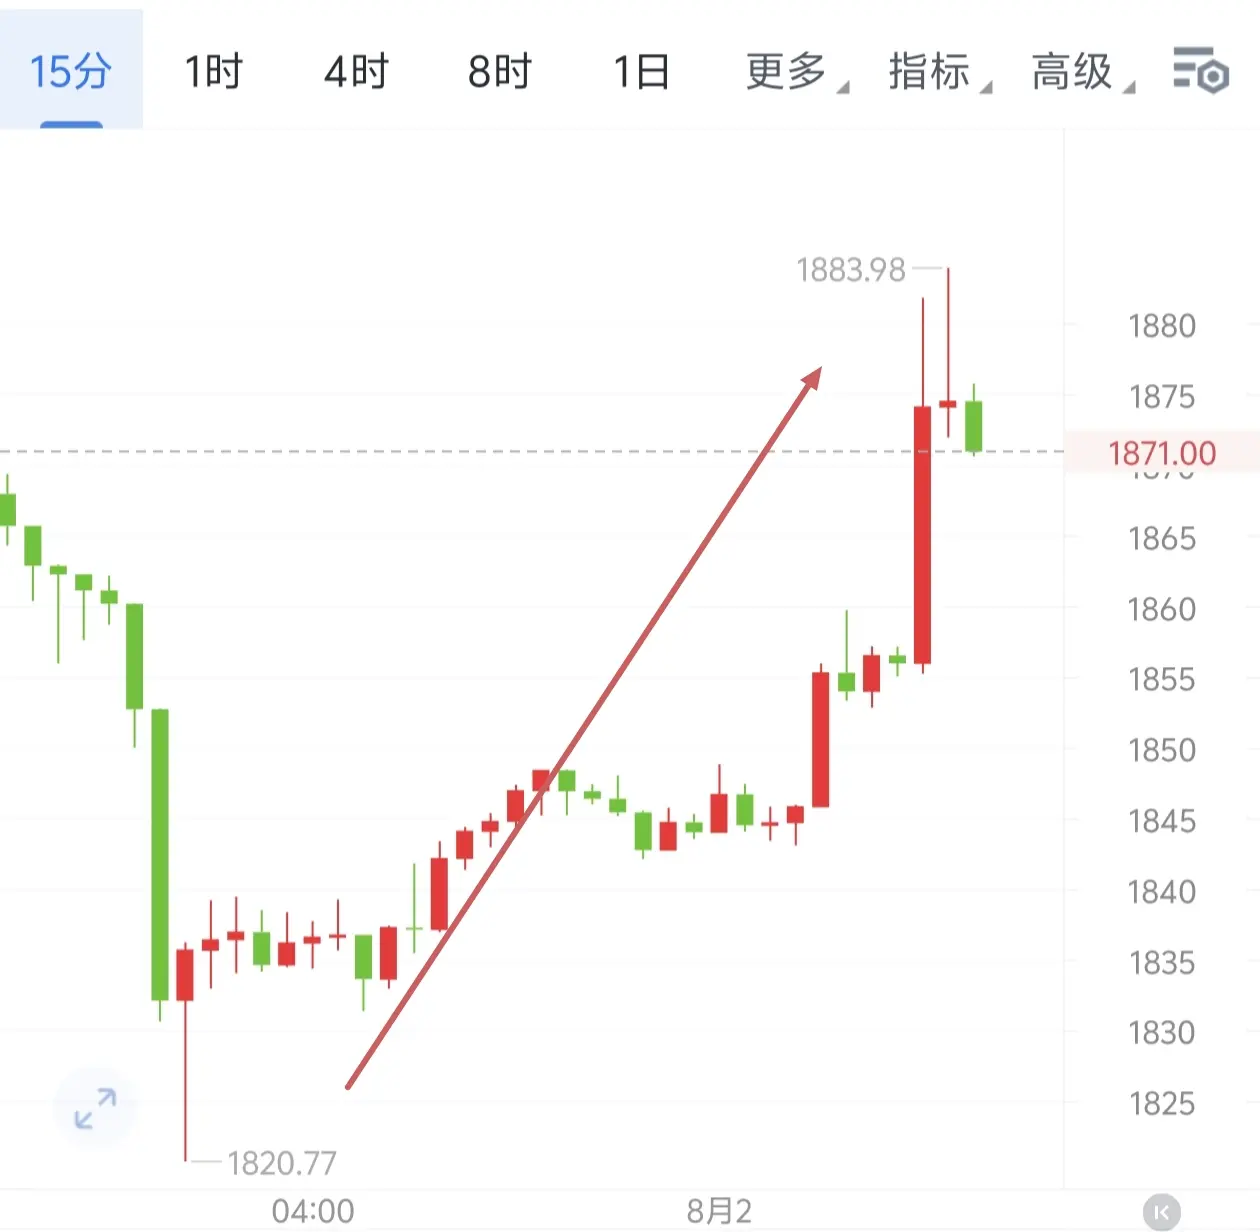
$ETH Mingyuan 8/1 evening: around 1,850-1,830 ?; looking at 1,885-1,915.
$BTC Mingyuan 8/1 evening: around 62,700-62,300 ?; looking at 63,500-64,300.
$ETH Mingyuan 8/1 evening: around 1,850-1,830 ?; looking at 1,885-1,915.