Share your thoughts
placeholder
Article
#BTCReclaims80K
#BTC ‌The $80K Battle Is Getting Interesting
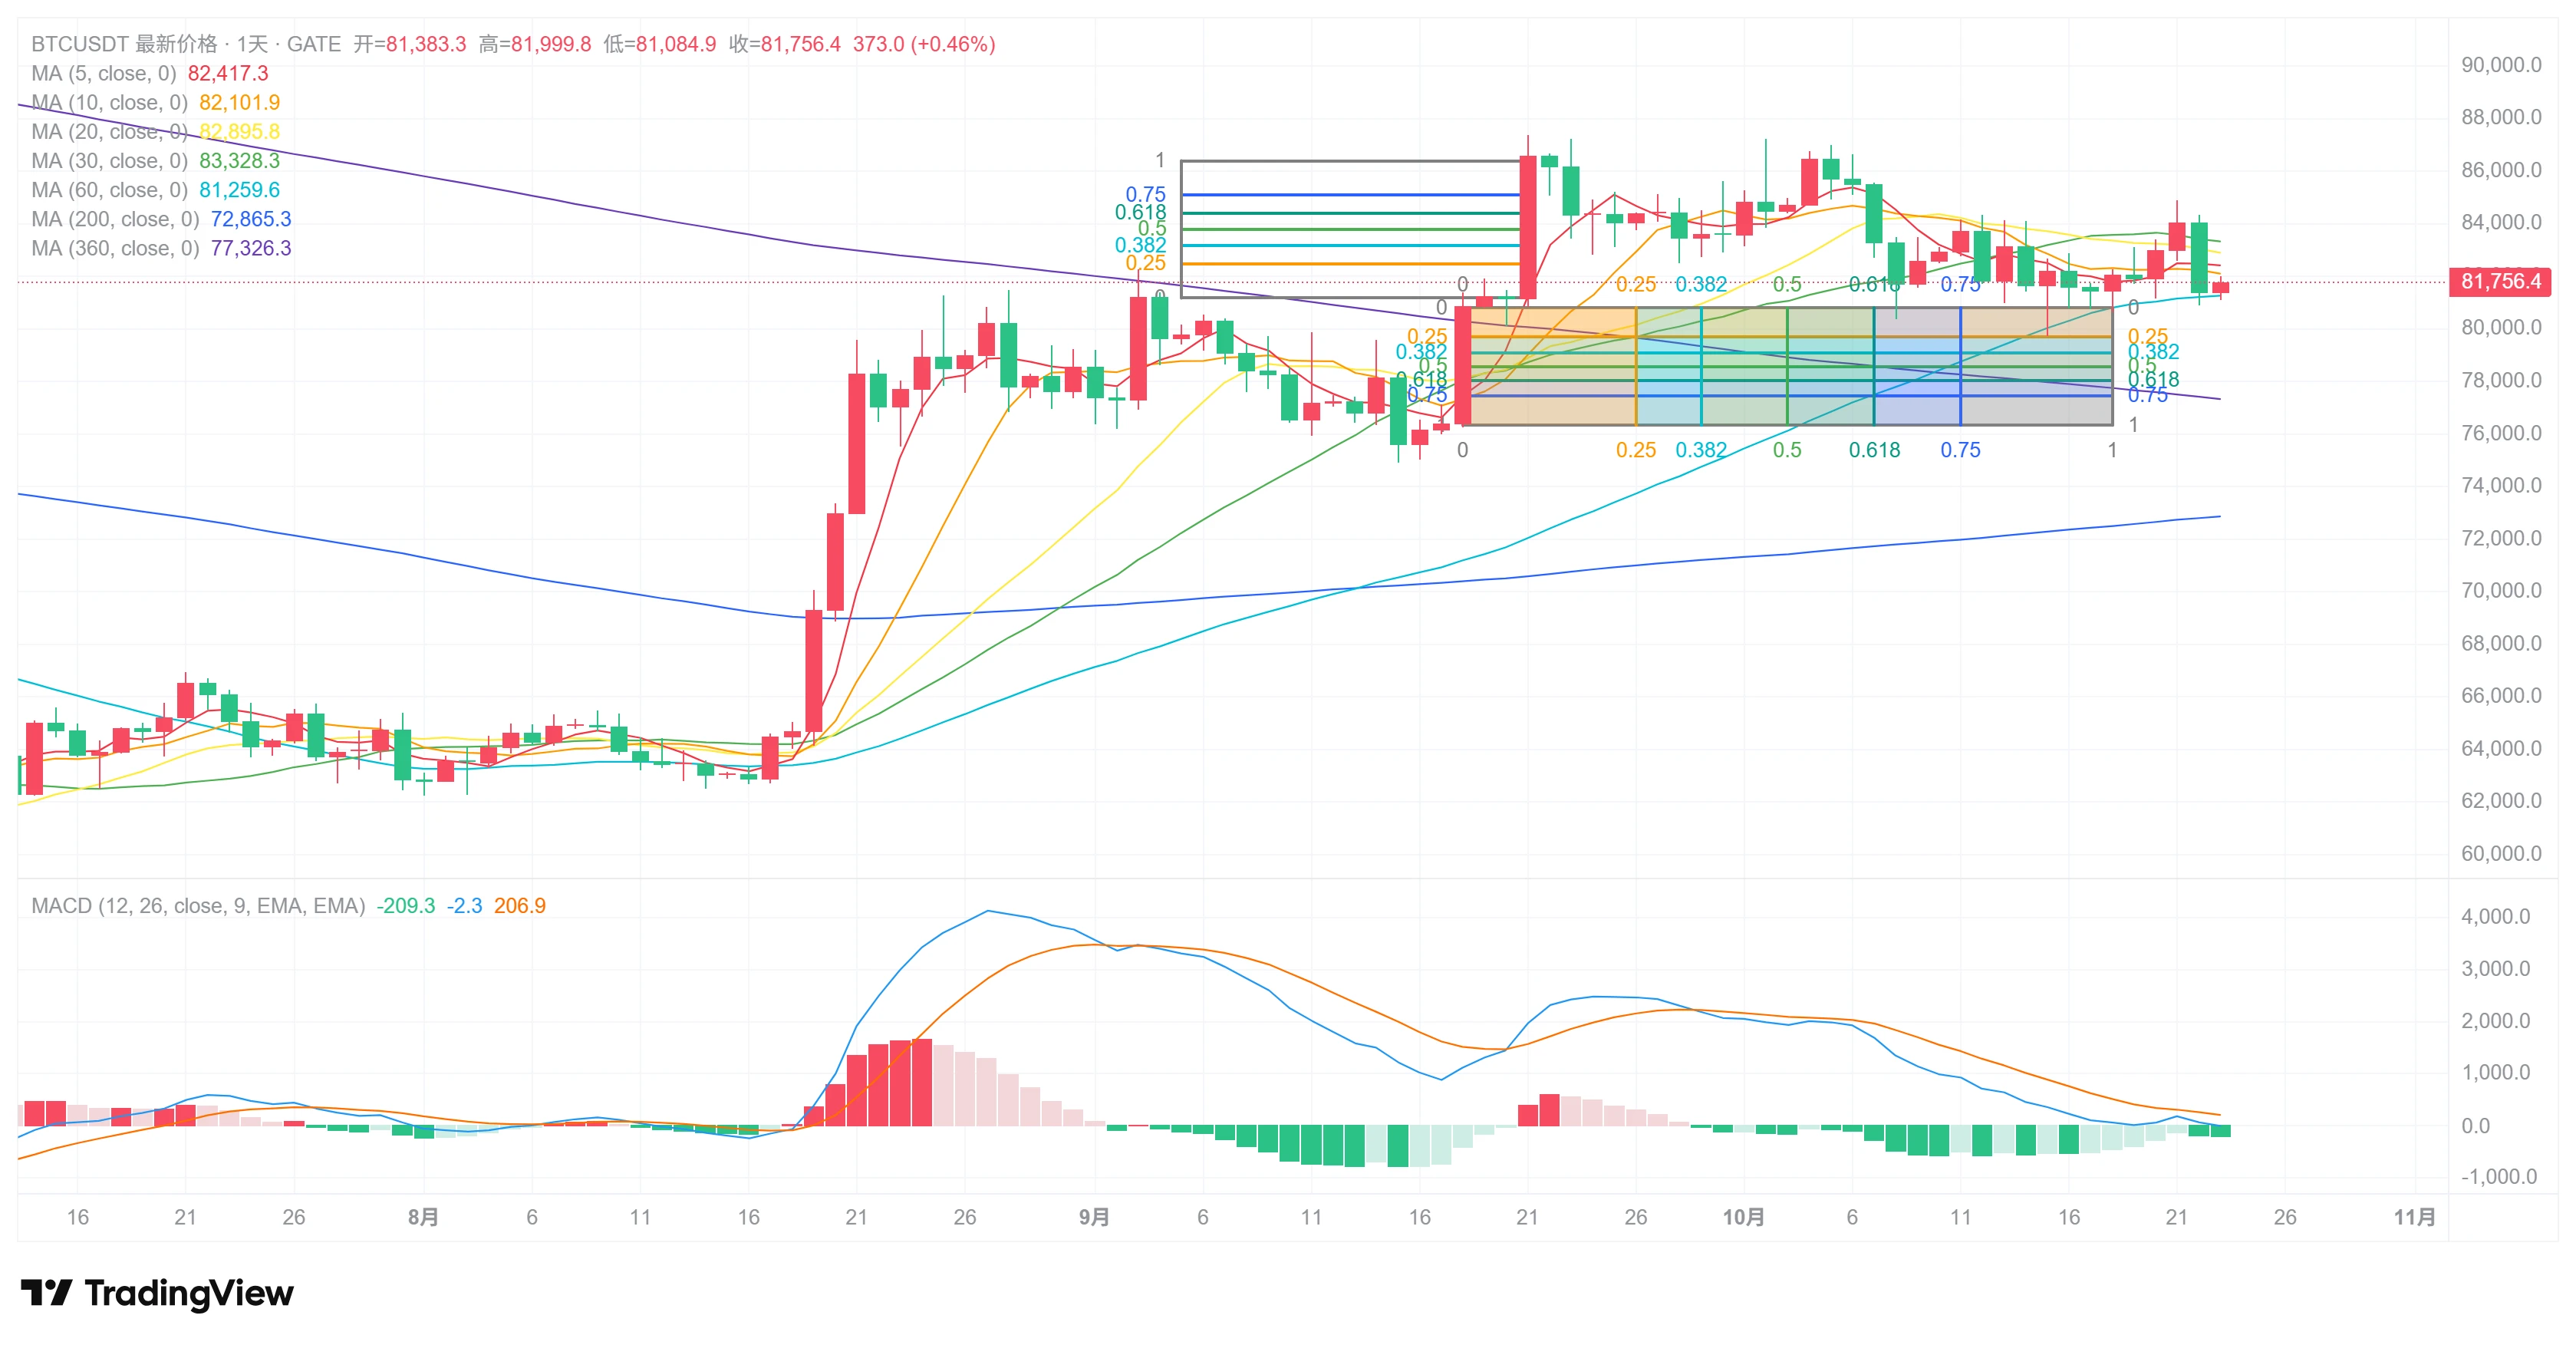
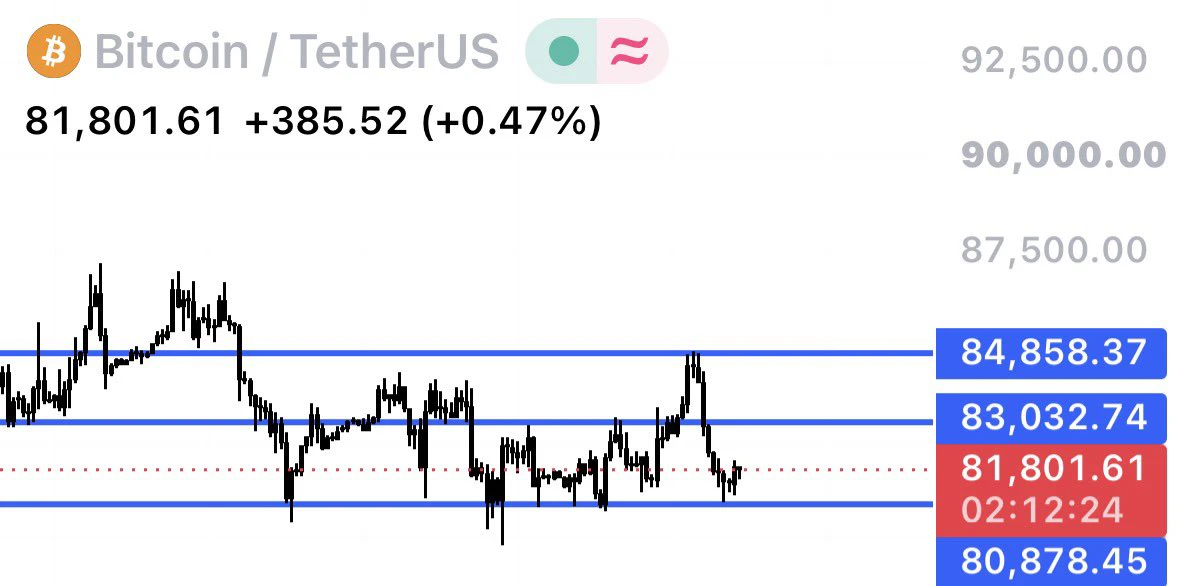
Bitcoin is trading around $79,950, with the current session holding a relatively tight range between roughly $79.5K and $80.1K. After the recent recovery from the June lows, BTC has managed to return to the $80K area, but the real question now is whether buyers can turn this level into support rather than another temporary resistance zone.
The broader structure is constructive, but it is not risk-free.
One of the strongest factors supporting BTC right now is institutional demand. U.S. spot Bitcoin ETFs recorded approximately $730.8
post-image
BTC-0.33%
Everyone’s chasing SUI’s bounce, but the 4H chart just whispered a secret the bulls missed.

$SUI /USDT - SHORT

Trade Plan:
Entry: 0.7861 – 0.7911
SL: 0.8126
TP1: 0.7706
TP2: 0.7585
TP3: 0.7405

Why this setup?
- RSI 15m at 35.72 – momentum is fading, not flipping.
- Price pinned at 0.7886, right under the 1H pivot – that’s rejection fuel.
- ATR 1H at 0.0100 means the squeeze is tight; a break below 0.7861 opens TP1 at 0.7706 fast.
- Why now? The “range” trend on 1D is a spring – shorts get the first pull before the snap back up.

Debate:
Are you fading this 0.7886 retest for a drop
SUI+0.08%
Layout for Bitcoin, Ethereum, and Dogecoin
live-cover
LIVE3,492
  • 1
BEN is the latest meme!!!
post-image
$UNI ‌ ‌#UNI / USDT - 7.061
Live Data: Price 7.061 +13.16% | 24h High 7.484 / Low 6.199 / Vol 4.26M UNI / Turnover 29.71M USDT | 4h EMA5:6.999 EMA10:6.826 EMA30:6.314 | MFI:64.568 | Today -1.04% / 7d +33.47% / 30d +75.27% / 90d +173.04% / 180d +82.09% / 1y -24.13%
1. PROJECT DETAILS
Uniswap is the largest decentralized exchange protocol on Ethereum and the core of DeFi.
UNI is its governance token. If you hold UNI, you vote on protocol fees, treasury, and future upgrades. Uniswap v4 and Unichain are the two biggest catalysts right now.
• Why it matters: Uniswap processes over 30% of all DEX
post-image
UNI+8.84%
  • 3
Crypto Academy: Ethereum (ETH) High-Level Consolidation on September 7 Is Not a Rest—Is Ethereum Completing a Major Shakeout of Positions? Latest Market Analysis Reference
  
Ethereum is currently priced at 2490, and the market has once again fallen into an agonizing state of neither rising nor falling. Many friends are now caught in a dilemma: they fear being trapped at the top if they chase the rally, but also fear that another upward move will sweep away their stop-losses if they go short, leaving them repeatedly battered by the market. Many people always want to catch a major surge or plun
ETH+0.40%
💰 Don’t let great content earn only likes! Have you activated Gate Social Subscriptions?
Share analysis in the Square or discuss market trends in livestreams—any content can be set as subscriber-only! Market reviews, trading strategies, market observations… Give subscribers access to deeper content while sharing and building a core following!
🔥 Set your own price with 0% revenue share! Activate now: https://www.gate.com/post
📖 Learn more: https://www.gate.com/help/community-center/moments/23369
  • 7
While monitoring the market just now, I noticed a subtle detail: after a sharp move in a low-liquidity area, volume failed to follow. I immediately sensed an opportunity. When the market pulled back, I didn't hesitate and quickly entered a short position.

Within minutes of entering, a rapid drop appeared, with the candlestick plunging particularly fast. I placed my first take-profit at the upper edge of the lower consolidation platform. After the order filled, I continued holding the remaining position. Since the selling pressure around $BR showed no sign of easing on the order book, while t
post-image
BR-16.80%
XRP-0.20%
ETH+0.40%
BTC Outlook and Trading Recommendations

Currently at 79705, with a slight pullback over the past 24 hours; market sentiment indicators show bears in control, and the short-term battle between bulls and bears is intensifying.

After surging at the four-hour level, the price has entered a range-bound correction, while the Bollinger Bands are narrowing; RSI has retreated from elevated levels, and the MACD red bars continue to shrink. The broader bullish structure remains intact. This is a technical consolidation following the rise, so do not be misled by short-term bearish market sentiment int
post-image
BTC-0.38%
BTC & ETH Retest the Breakout Zone! Could Buyers Turn Resistance Into Support?
live-cover
LIVE1,099
these paws need love too
post-image
$ETH ‌ ‌
1. PROJECT DETAILS
Ethereum is the dominant Layer1 for smart contracts and the settlement layer for Layer2s.
• Utility: Gas for DeFi, L2 settlement, staking, restaking, stablecoin settlement. Ranked NO.2 Spot and NO.2 Market Cap on Gate.
• Supply Model: Post-Merge PoS with EIP-1559 burn, net deflationary during high activity. Avg Price 4,289.10 is 41.6% above current price, showing long-term average holders are underwater and overhead supply exists above 2,594.96
. • Performance: 30d +30.77% and 90d +48.20% indicate strong recovery, while 1y -41.48% confirms macro correction still i
post-image
ETH+0.50%
#GateEventContractTradeSharingChallenge #ZEC
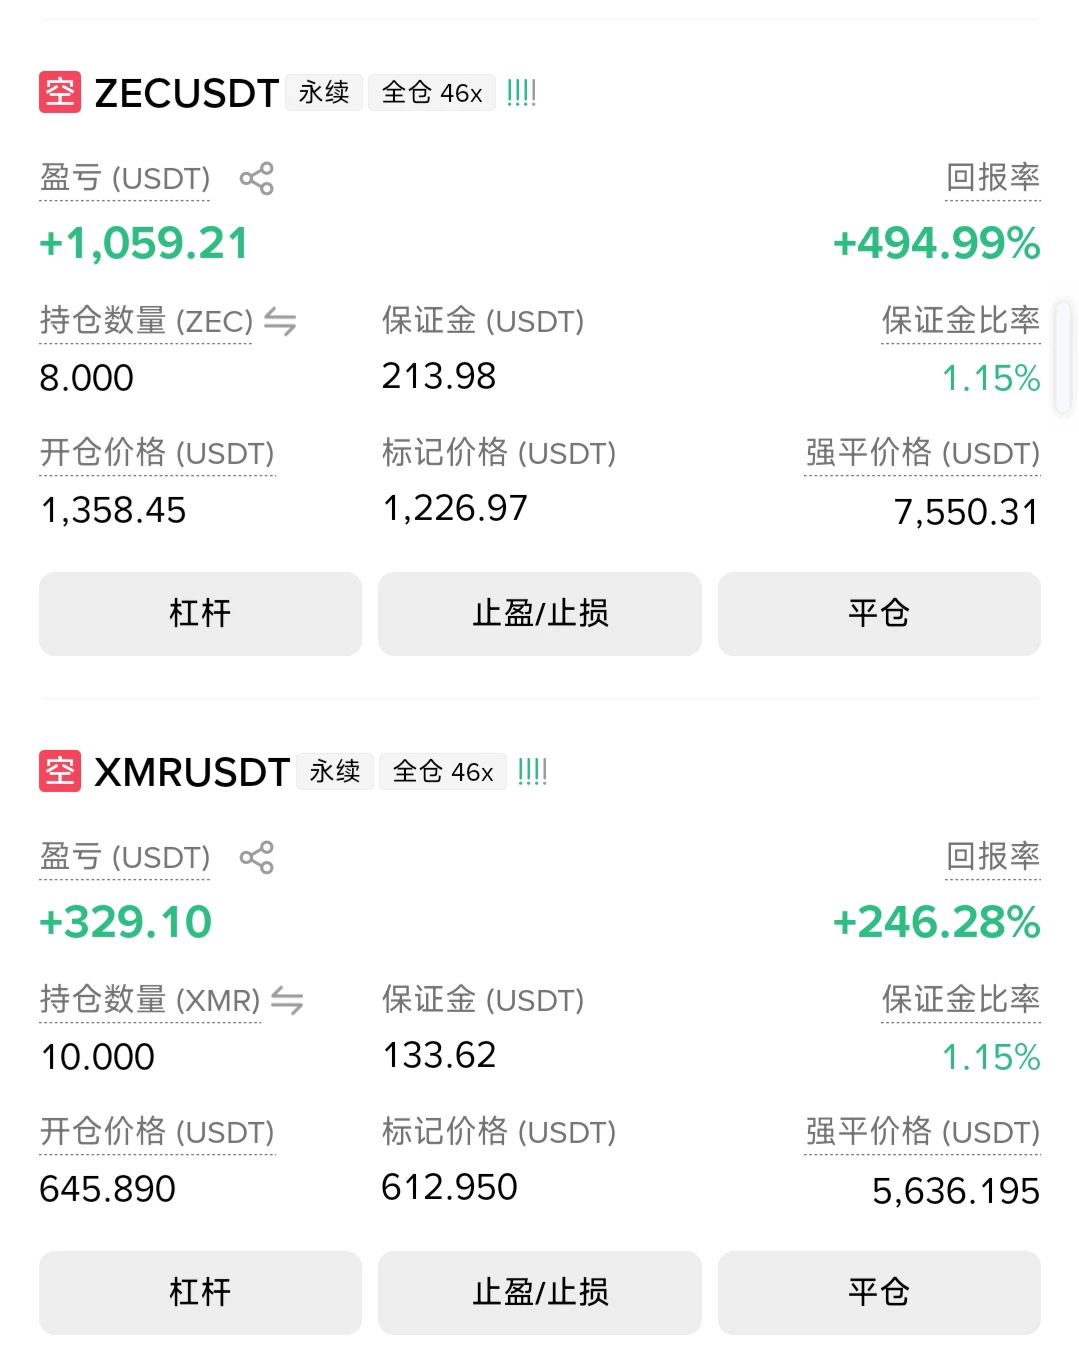
Zcash (ZEC) is showing exceptionally strong momentum. With your quoted current price around $1,189, the latest market data places ZEC around $1,184, with an intraday high near $1,204 and low around $1,005. That means the 24-hour move is roughly +16–19%, depending on the exchange and exact snapshot.
The most important development is that ZEC has successfully moved above the psychological $1,000 area after breaking through a major multi-year resistance zone. Recent reports attribute the acceleration partly to a short squeeze, with roughly $13M+ in Z
ZEC+15.10%
$SUSHI Signal】Long + 1H pullback to EMA20
$SUSHI After surging to 0.2828 on the 4H chart, price retraced to 0.2445 and is now near the 1H EMA20, with order book imbalance at -13.18% and 1H MACD bearish momentum expanding.
🎯Direction: Long
⚡Entry/Limit order: 0.243766 - 0.244500
🛑Stop-loss: 0.242055
🚀Target 1: 0.248167
🚀Target 2: 0.250001
🛡️Trade management:
- Execution strategy: After reaching Target 1, reduce the position by 50% and move the stop-loss up to breakeven. If the price falls back to the entry level, exit automatically to protect the principal.
In-depth logic: OI is stable, a
post-image
SUSHI+12.64%
After $ONDO rallied, I did not exit the entire position. I took profit on 80% first and moved the protection level for the remaining position above breakeven. Just now, a quick pullback swept out the remaining position, successfully locking in the profit.

The reason for entering was simple: on the hourly timeframe, the pullback to the previous high did not continue lower; instead, price reclaimed the moving average with increased volume. This was a typical pullback confirmation. After going long, I kept the stop-loss below the lower boundary of the small range.

After the pullback swept the
post-image
ONDO+2.69%
XRP-0.20%
SOL+2.66%
This was purely the market being in a good mood, casually sprinkling some gold coins that just happened to land on my head.
Right after lunch, when I checked the charts, $SNXX was still alarmingly red, but something felt off in the order book: the sell orders kept getting eaten away, while the buy orders were lined up neatly. Repeated choppiness is when it’s easiest to trick people into exiting, but I refused to leave and directly shared a long idea, telling those following me not to panic. The longer this buildup lasts, the more decisively it will break out.
Everyone saw what happened next:
post-image
SNXX+0.86%
BNB-3.75%
SNDK+0.39%
#GateEventContractTradeSharingChallenge #ZEC
Zcash (ZEC) is showing exceptionally strong momentum. With your quoted current price around $1,189, the latest market data places ZEC around $1,184, with an intraday high near $1,204 and low around $1,005. That means the 24-hour move is roughly +16–19%, depending on the exchange and exact snapshot.
The most important development is that ZEC has successfully moved above the psychological $1,000 area after breaking through a major multi-year resistance zone. Recent reports attribute the acceleration partly to a short squeeze, with roughly $13M+ in Z
post-image
ZEC+15.10%
#ZEC How to View ZEC After Breaking Above $1,200

Let’s start with the most compelling point in the bullish narrative: ZEC’s all-time high was actually $5,941 in 2016—the current $1,193 is still about 80% below its ATH. Against the backdrop of continued ETF inflows, the market can fully tell the story that “a decade high is just the beginning, with a return to the ATH ahead.” ZEC’s ETF assets under management have surpassed $400 million, SMA-200 is providing strong trend support near $440, and the daily structure remains healthy.

But in terms of pace, the risk is accumulating rather than di
post-image
ThisIsTranslateContent:
#ZEC How should we view ZEC after it broke above $1,200?
First, the most compelling point in the bullish narrative: ZEC's all-time high was actually $5,941 in 2016—the current $1,193 is still about 80% below its ATH. Against the backdrop of continued ETF inflows, the market can fully tell the story that a ten-year high is only the beginning and that ZEC is returning to its ATH. ZEC's ETF assets under management have surpassed $400 million, while the SMA-200 near $440 provides strong trend support, and the daily structure remains healthy.
But in terms of momentum, the risk is accumulating rather than dissipating:
First, the squeeze fuel is nearing exhaustion. On top of OI tripling from $700M to $2B, shorts have been squeezed for two consecutive days. The remaining horsepower of this engine is rapidly declining—once the shorts are fully cleared out, a vacuum in buying pressure will emerge.
Second, the pace of the rise has shifted from "violent" to "out of control." ZEC broke above $1,000 on Thursday (+20%) and went straight to $1,200 today (+17.8%). A 40% two-day slope has historically almost never occurred without a sharp pullback. The price is tracking a parabola, and every parabola eventually breaks.
Third, sentiment has already overtaken demand. PANews' review of the previous ZEC surge concluded that it "began with demand and ended with sentiment"—the share of privacy transactions fell rather than rose after the surge, indicating that capital speculation, rather than real usage, was driving the price. This round has a stronger demand base thanks to the ETF, but the slope from $1,000 to $1,200 is clearly being driven by sentiment.
Key levels
Upside: $1,200 has just been breached. The next round-number level drawing market attention is $1,500, followed by the 2016 ATH of $5,941 as the "narrative level."
Downside: $1,000 is the lifeline of this rally; a break below it would mean the squeeze-driven move is over. $1,100 is the first short-term support.
Conclusion
The medium-term logic (ETF + privacy narrative + ten-year high) remains intact, and this rally has not been invalidated. But the 40% gain in two days has turned the question of "how much further it can go" into whether it will "pull back first and then continue" or "finish the move directly."
So: Above $1,200 is a high-volatility zone, where the probability of wide-range consolidation or a rapid wick is far greater than that of a continued one-way surge. $ZEC
repost-content-media
ZEC+15.10%
  • 2
  • 1
$HYPE : Breakout or Confirmation?
HYPE reached ~$89.6, clearing its previous ATH near $86.7.
The breakout is now facing its first real test: can $86–87 hold as support?
Key levels: → $86–87 — first support
→ $84–85 — secondary support
→ $80–82 — structure weakens below here
Beyond price, Hyperliquid’s fee mechanism channels part of trading fees into HYPE purchases through the Assistance Fund, with acquired tokens burned.
But leverage remains elevated: futures volume is roughly 13× spot.
U.S. access could add another catalyst, but remains a possibility — not an approval.
For now, the key is con
post-image
HYPE+2.70%
The hand that set the stop-loss a few days ago trembled slightly; this morning I realized that was unnecessary filial piety.
When $USELESS was bottoming around 0.06822, I already felt something was off: it could barely fall, while every rebound kept testing higher levels—a classic sign that funds were quietly entering.
I watched the market for quite a while, and seeing someone steadily absorb every pullback, I knew the direction was highly likely to turn upward.
I decisively opened a long position, with the entry price landing right at 0.06822.
Hold as long as the trend remains intact; run if
post-image
USELESS-22.79%
BNB-3.75%
SNDK+0.39%
Load More

Join 40 M users in our growing community

⚡️ Join 40 M users in the crypto craze discussion

💬 Engage with your favorite top creators

👍 See what interests you

View More