


Square
Following
Hot
News
Profile
Share your thoughts
placeholder
Article
Battle Begins Tomorrow! WCTC S9 Countdown: 24 Hours
A total prize pool of up to 6,000,000 USDT and a grand champion gold medal worth 30,000 USDT—traders from around the world are about to compete!
Team Competition: Join your teammates to vie for honors across three leaderboards
Individual Competition: Climb the rankings based on your cumulative valid trading volume
⚔️ PK Competition: One 30-minute showdown per round, wins determine the outcome, and winning streaks earn extra points
Log in and register to get your first free Lucky Launch
The competition officially begins on 2026/10/23 16:00 (UT
post-image
  • 6
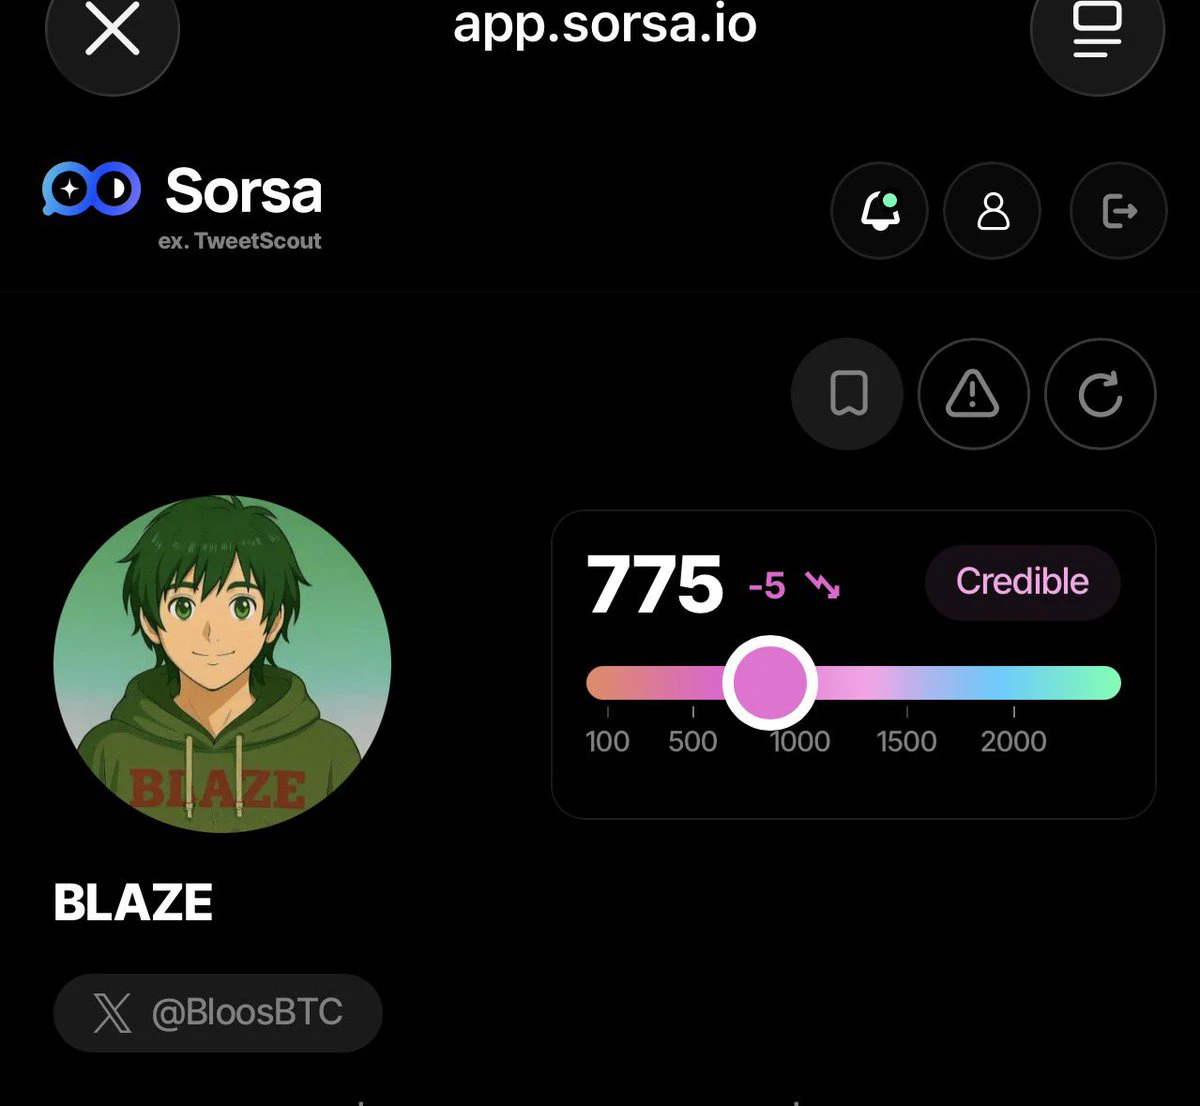
I heard Sorsa Score is the new currency
Everyone is arguing about it, but where do I stand?
post-image
Trenches
ZIG
Z
bade
b
ZIG
0x8c...1145
Market Cap
$.
Change
.
24h Vol
$.
Holders
.
CNPY
C
bade
b
CNPY
0xc6...ddd2
Market Cap
$.
Change
.
24h Vol
$.
Holders
.
STONK
S
bade
b
STONK
6GmA...UNgx
Market Cap
$.
Change
.
24h Vol
$.
Holders
.
BTC
B
bade
b
BTC
C5xp...pump
Market Cap
$.
Change
.
24h Vol
$.
Holders
.
LIGHT
L
bade
b
LIGHT
0x47...3c0e
Market Cap
$.
Change
.
24h Vol
$.
Holders
.
XRP market update
live-cover
LIVE1,481
$WET This -26.78% bearish candle is the price I paid for not cutting my position in time after the Fed minutes came out last Friday. The minutes were hawkish, and when real rates jumped, the 30-day correlation between BTC and the Nasdaq that I was watching surged to 0.78. Risk assets were drained of liquidity across the board, with altcoins hit first—WET plunged from 0.0762 to 0.0488. I caught the falling knife at 0.062 and exited at my 0.054 stop-loss, losing 13 points. Mentally, I just couldn't accept it and kept wanting to wait for a rebound.
The lesson is harsh: when the macro outlook turn
WET-13.53%
BTC-0.39%
#SpotGoldFallsBelow$4000 #ShareWeekly
Spot Gold Falls Below $4,000: Full Analysis of the Breakdown, Drivers, Current Levels, Outlook, and Trading Considerations
Spot gold has slipped below the psychologically important $4,000 per ounce level, marking a notable technical and sentiment shift in the precious metals market. Recent trading saw prices trade as low as approximately $3,975–$3,986 before hovering near $3,990–$3,997 in late sessions. Futures also reflected the pressure, with weekly declines of roughly 4% in some reports, representing the steepest weekly drop since June. This move comes
XAU-0.11%
USIDX+0.13%
I recently saw an interview in The Intellectual with Fields Medalist Deng Yu, and there was one thing he said that I especially agree with:
“For AI companies, you can’t openly distill the internet literature and knowledge of all humanity when you’re the only one doing it; in fact, no one wants to distill you. People just want to understand the chain of thought, and then you decide they want to distill you and start saying this isn’t allowed, that isn’t allowed.”
Over the past few years, these companies have scraped vast amounts of human knowledge from the internet, including papers, books, cod
WUZZY FUZZY YES HE WUZZY
$BTC
post-image
BTC-0.23%
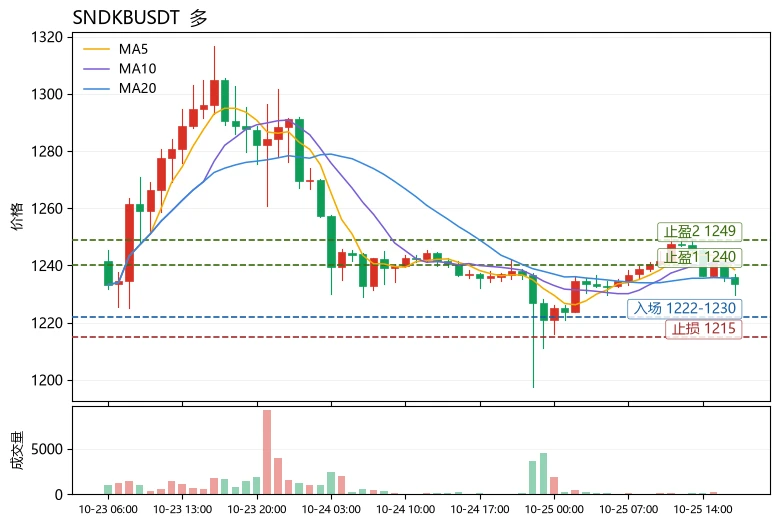
The moving averages are in a bullish alignment, yet the price has been slow to rise—is it building momentum or a false breakout? The answer leans toward the former: although the price is tracking near the lower Bollinger Band, MA5 remains above MA20 and the MACD histogram is still positive, indicating a pullback within a strong structure rather than a trend reversal.
Technical breakdown: The current price of 1233.61 is near the lower edge of the Bollinger Bands [1221.02, 1249.92], just about 1% above the lower band. Short-term oversold pressure has partially eased. MA5=1238.51 is above MA20=12
post-image
SNDKB
SNDKBSNDKB
Four.meme
MC:$3.87KHolders:1
0%
KAT-11.20%
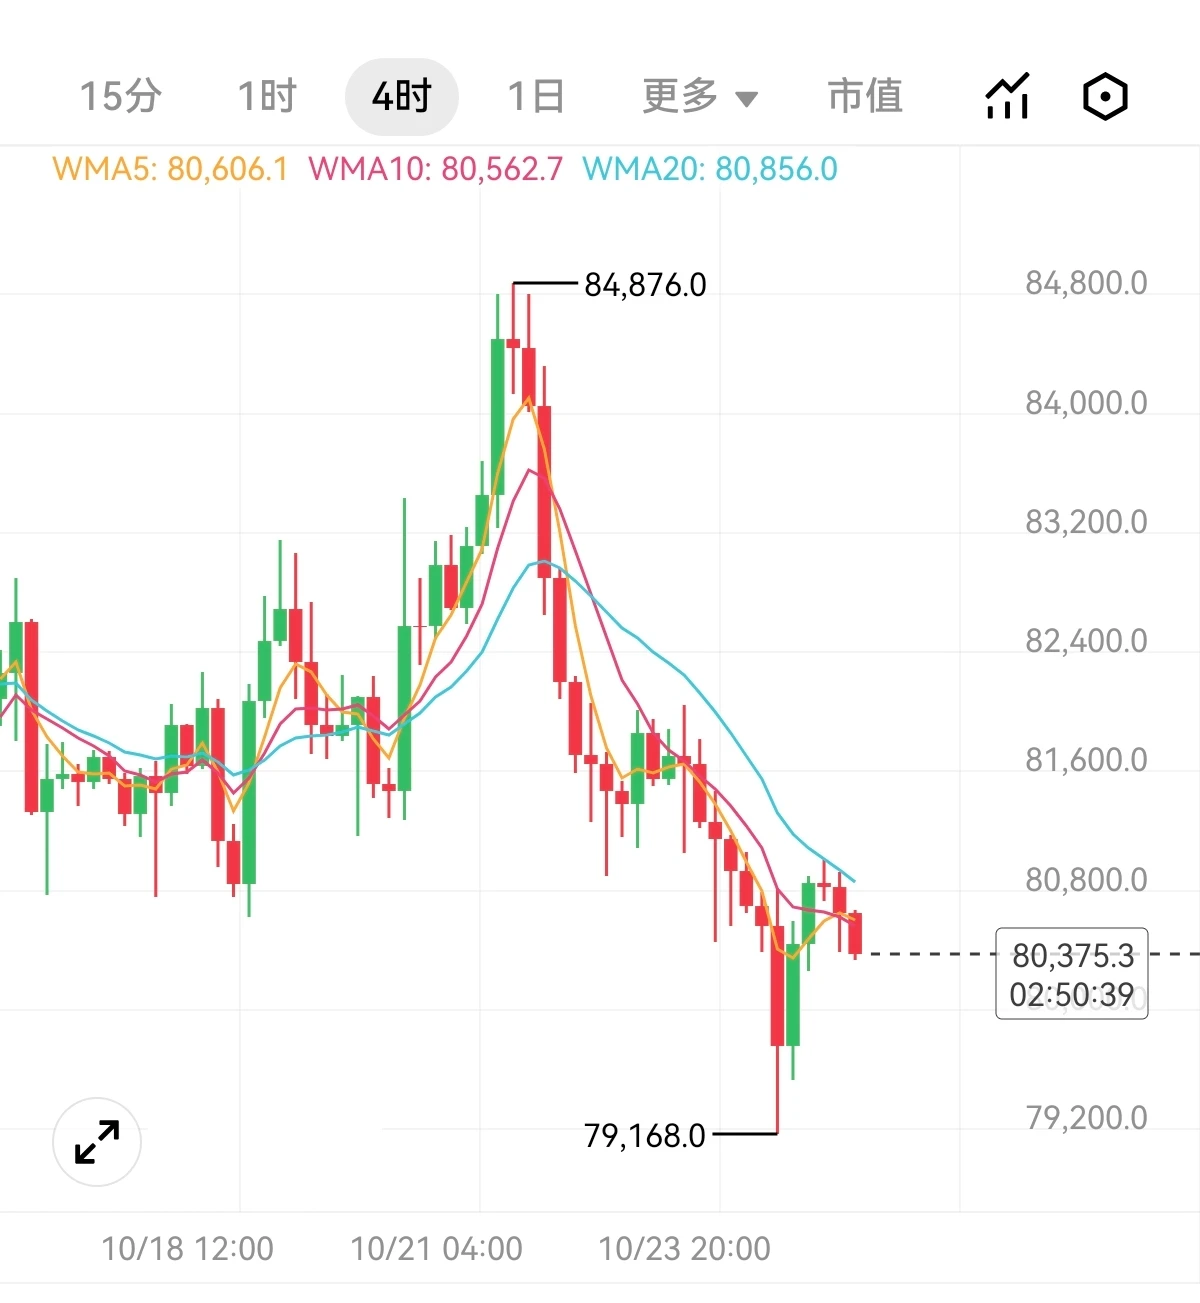
Last night's news triggered the market's decline, and the weekend has also started moving. Before the range breaks down, continue maintaining a buy-the-dip setup. After all, it has already fallen so much, so the downside potential for shorts won't be that great. The chart shows support at 79100, with an extreme level of 78400. Longs can be opened at support, with an entry near 79300; conservative traders can enter at 78600. If 78000 breaks, abandon the long setup. Targets are 81200–82200, with a breakout opening the way to 83800$BTC $ETH #美股财报季
post-image
BTC-0.39%
ETH-1.71%
market price $xua
live-cover
LIVE1,886
$XRP is sitting right at the knife-edge $1.291 with price crushed under both EMAs and a clear bearish structure.
Price just rejected the $1.292 resistance zone and is coiling under the EMA20/50 cluster (1.297 / 1.300). RSI is neutral at 51.7, MACD histogram is still negative, and both 4H + Daily bias are firmly bearish. This is a classic “wait for the retest” environment — no FOMO needed.
K-Line (Candlestick) Structure.
Looking at the 1H chart:
Strong sell-off from the $1.33–1.35 high earlier, followed by a lower high and aggressive red candles into the $1.25 area.
Price then bounced and is
XRP+0.78%
Today's most abnormal market detail is this: the Fear & Greed Index is stuck at a neutral 54, and the broader market lacks direction, yet MUB rose +0.45% against the trend on thin 24h trading volume of just 5.7M USDT. MA5 (886.346) remains above MA20 (885.648), and the price is holding firmly at the Bollinger midline—this is typical low-volume resilience, not a follow-the-herd rebound. Neutral sentiment means neither bulls nor bears have an overwhelming advantage, and sector rotation is leaning toward assets with independent narratives; MUB's narrow-range resilience is a sign of funds buying t
MUB
MUBMubbin
Pump.Fun
MC:$3.42KHolders:1
0%
TAO-0.82%
#SpaceX
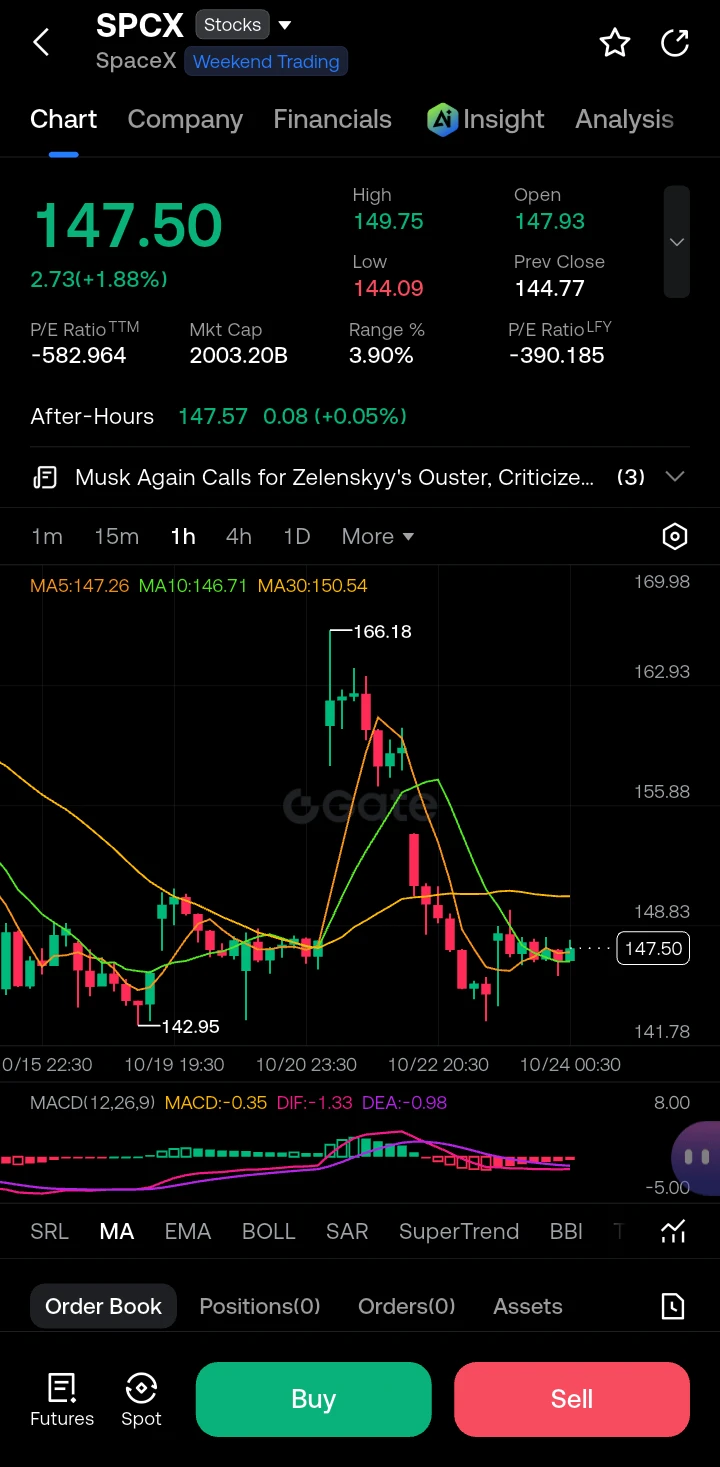
$SPCX ‌Sharp impulsive rally (tall green candle) to 166.18, followed by a clear pullback/distribution phase. Price has made lower highs and is now consolidating in the 144–150 zone.
Moving averages.
MA5: 147.26
MA10: 146.71
MA30: 150.54
Price is hugging MA5/MA10 and still below MA30 → short-term neutral-to-slightly-bullish, medium-term still under pressure.
MACD (12,26,9): MACD -0.35 | DIF -1.33 | DEA -0.98. Histogram is negative and lines are below zero → bearish momentum still dominant, no clear bullish crossover yet.
Candlestick character: After the big green spike, we see a serie
post-image
SPCX+1.88%
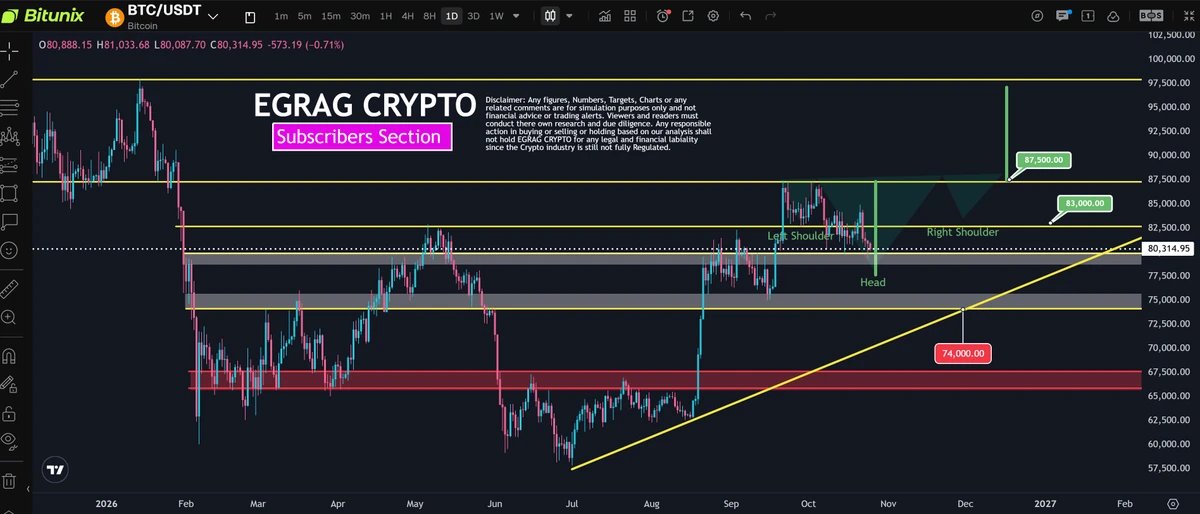
#BTC – 🐂#BULLS WILL BE REWARDED. 🐻#BEARS WILL BE SLAUGHTERED! ⚔️
INVERSE HEAD & SHOULDERS LOADING! 🚀
This is my ANTICIPATION, not a confirmed formation!
THE ROADMAP:
🔴 Below $78K → $75K–$74K
🟡 $74K holds → Potential HEAD formation
🟢 Reclaim $83K → RIGHT SHOULDER developing
🚀 Break $87.5K → $97.5K in sight!
MY NEXT 3-MONTH OUTLOOK:
▫️last Week of OCTOBER: Potential HEAD
▫️first 2 Weeks Of November: Completer Right Shoulder
▫️18 November and on Ward Break out the $88K Region
▫️ DECEMBER: New Local High and potentially retest the The break-out point $88K
Even a retest of $74K DOES NOT au
post-image
BTC-0.39%
$ETH Bearish factors still dominate today, with a bearish short-term outlook. Although it fell to 2282 yesterday, it rebounded to above 2370 this morning. Remember, this is only a rebound, not a bullish signal.
The rebound is merely an oversold recovery; whether it can hold remains uncertain.
Don't chase shorts now; wait for a rebound to 2355-2380 to meet resistance before shorting. Don't chase longs; wait for 2300-2310 to stabilize before taking a short-term long. For reference only.#美国消费者信心接近历史低点
ETH-1.71%
🔥 WCTC S9 starts tomorrow. Just 24 hours to go!
Get ready to compete for a total prize pool of up to 6,000,000 USDT and an overall champion's gold medal valued at 30,000 USDT.
🏆 Teams: challenge three leaderboards with your squad
📈 Individuals: climb the ranks with eligible trading volume
⚔️ PK: face off in 30-minute rounds, compete on wins and earn streak bonuses
🎁 Register while logged in and get 1 free Lucky Launch
⏰ Trading begins October 23, 2026, 08:00 UTC
Only eligible data after registration and within the relevant competition period counts. Registration stays open until November 2
Gate_Square
🔥 WCTC S9 starts tomorrow. Just 24 hours to go!
Get ready to compete for a total prize pool of up to 6,000,000 USDT and an overall champion's gold medal valued at 30,000 USDT.
🏆 Teams: challenge three leaderboards with your squad
📈 Individuals: climb the ranks with eligible trading volume
⚔️ PK: face off in 30-minute rounds, compete on wins and earn streak bonuses
🎁 Register while logged in and get 1 free Lucky Launch
⏰ Trading begins October 23, 2026, 08:00 UTC
Only eligible data after registration and within the relevant competition period counts. Registration stays open until November 25, 2026, 08:00 UTC; it does not close at the start.
Teams ready. Targets set. See you in the competition!
👉 Join now: https://www.gate.com/competition/wctc-s9
‍#Gate #WCTCS9 #Countdown
repost-content-media
  • 3
#KOSPIFallsNearly4% #ShareWeekly
The KOSPI, South Korea’s primary stock market index, recently experienced sharp declines of approximately 3.7% to over 4% in single sessions during mid-to-late October 2026, contributing to a broader monthly slide that has been among the steepest for major global indexes. On one key session the index closed at 5,552.74, down 215.27 points or 3.73% from the prior close. Intraday moves saw it briefly threaten levels near 5,500 and fall as much as 4.3% to 4.8% at points. Later sessions showed continued volatility, with a close near 5,533.77 (down 3.52%) and a sub
SKHYNIX+4.92%
  • 6
  • 1
Versace @Versace, seriously? Half a year ago you sold me a pair for over 5,000, and now it’s down to 2,800. Even the shitcoins I bought haven’t fallen as hard as you have.
post-image
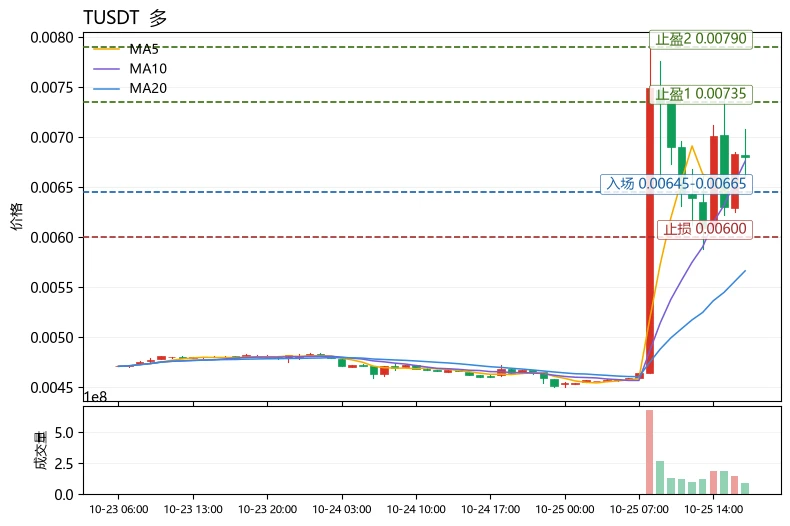
$T Short-term bias is bullish, but this is a high-volatility momentum-chasing trade, so position sizing must come before direction. The current price is 0.0068, up 47.19% over 24h, with a range of about 50.15% across 30 candles and volatility at an extremely high level; MA5=0.006606 has crossed above MA20=0.005664, the MACD histogram is positive, and the trend remains bullish, while RSI 63.1 is not yet overbought. The key contradiction is the funding rate of -0.9521%: shorts are paying, creating squeeze momentum, but this also means any pullback could be very sharp. The strategy is to take onl
post-image
WL+2.77%
STRK-6.29%
#SpotGoldFallsBelow$4000
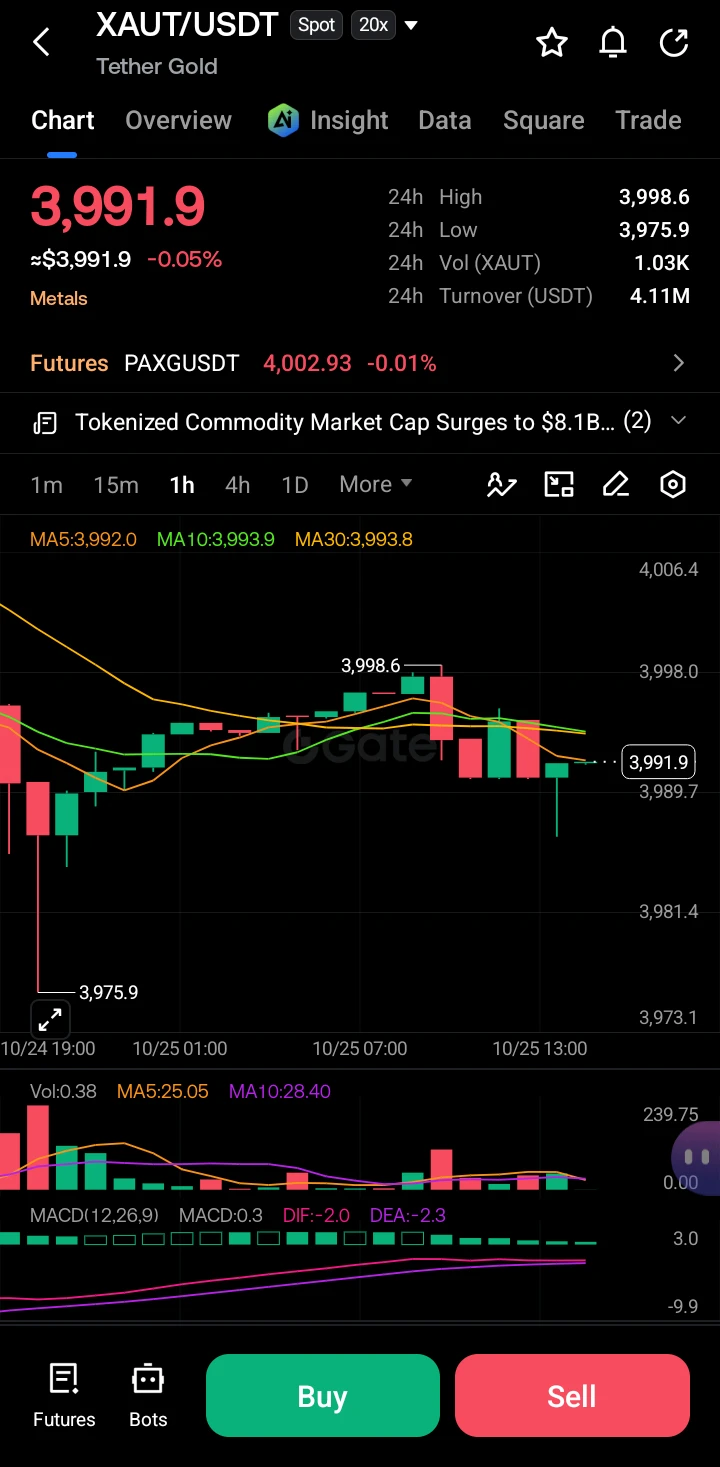
A Coiled Spring at the 4K Battle Line
The market is holding its breath. XAUT is currently compressing into a razor-thin tightrope walk just beneath the psychological 4,000 barrier. With the 5, 10, and 30 moving averages fused together like a knot and volatility flatlining, the chart is practically screaming for an explosive breakout. But which way will it snap? Let’s break down the technicals and map out the trade.
📊 Chart Analysis (1H Timeframe)
1. Price Action & Structure:
· Current Price: 3,991.9
· The Setup: The price recently probed upward to 3,998.6 but faced i
post-image
XAUT-0.11%
Load More

Join 40 M users in our growing community

⚡️ Join 40 M users in the crypto craze discussion

💬 Engage with your favorite top creators

👍 See what interests you

Trending Topics

USEarningsSeason

87.72k Views3.45k Discussing

The U.S. Q3 earnings season is in full swing, with major tech companies including Tesla and Meta reporting results. Market focus is shifting beyond revenue and profit toward AI spending, capital expenditure, margins and forward guidance. Which company’s earnings are you watching most closely?

GateWCTCS9GlobalTradingCompetition

684.91k Views8.01k Discussing

USConsumerSentimentNearRecordLow

9.41k Views267 Discussing

View More