Square
Following
Hot
News
Notifications
Profile
Share your thoughts
placeholder
Article
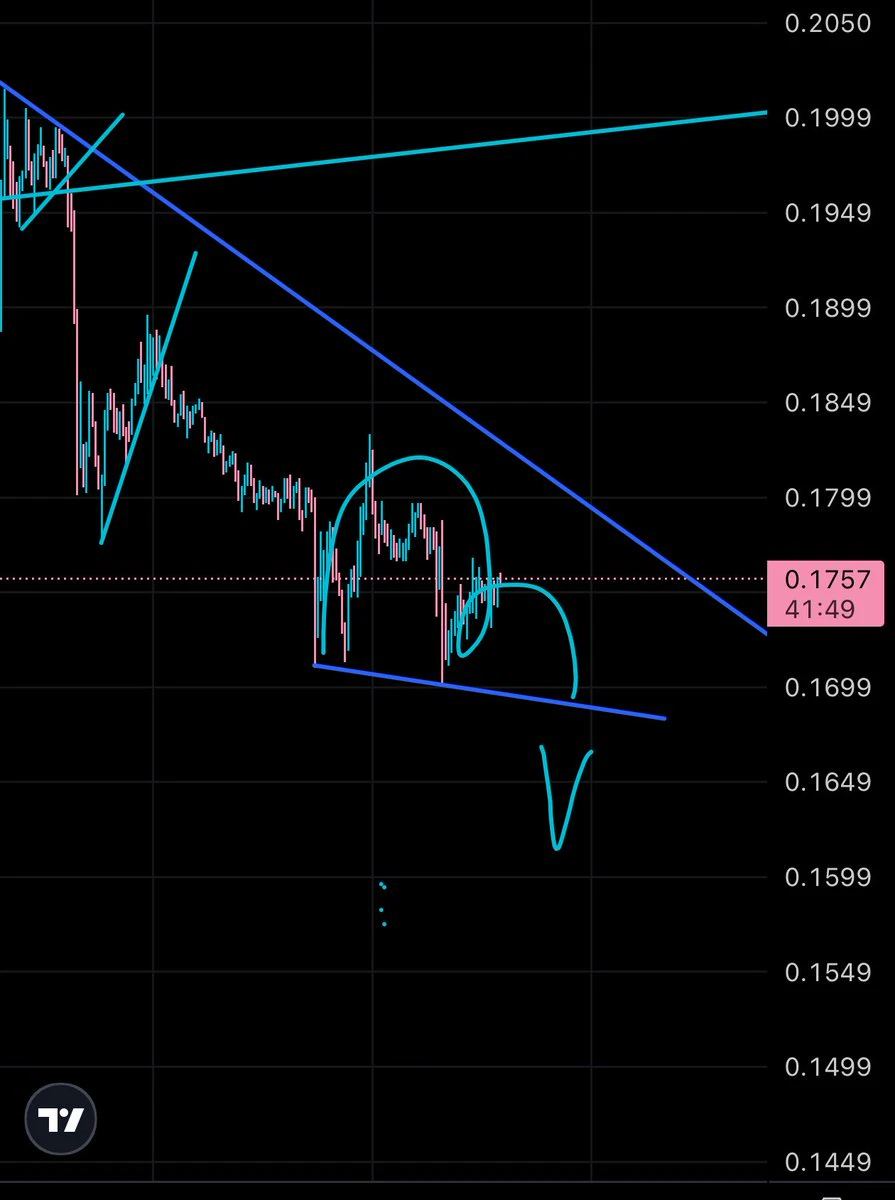
Trading is so simple, you don’t need a million strategies and indicators and try new things every other day
Keep it simple.
Draw trendlines, wait for break of trendline, wait for confirmation (break of structure / rejection), done.
Been trading with my VIPs for years, never changed my strategy, and somehow they all are happy and tune in almost every live stream or ask for 1:1’s
post-image
🎁 Gate Square Comment Challenge: Last Week’s Winners

Congrats to the users who turned comments into rewards 👇
🏆 @北辰Alpha: Gate merch worth approx. 150 USDT
⭐ @蜡笔小小小新, @Belalelbanna, @GateUser-c08c5c8b: 5 USDT each

💬 Keep commenting this week: share insights, experiences or thoughtful questions. Could you be next?
🎉 Register, then post your first valid comment for a 10 USDT Futures Position Voucher.
👉 Register first, then comment : https://www.gate.
post-image
Trenches
mihao
m
bade
b
mihao
4Cxj...pump
Market Cap
$.
Change
.
24h Vol
$.
Holders
.
AGT
A
bade
b
AGT
0x5d...e274
Market Cap
$.
Change
.
24h Vol
$.
Holders
.
Dacity
D
bade
b
Dacity
nxPq...pump
Market Cap
$.
Change
.
24h Vol
$.
Holders
.
HOLD
H
bade
b
HOLD
4iJ7...pump
Market Cap
$.
Change
.
24h Vol
$.
Holders
.
DacityCoin
D
bade
b
DacityCoin
DKYc...pump
Market Cap
$.
Change
.
24h Vol
$.
Holders
.
$WLD A small gain today, then another Black Friday tomorrow—you really know how to mess with us
post-image
WLD-5.61%
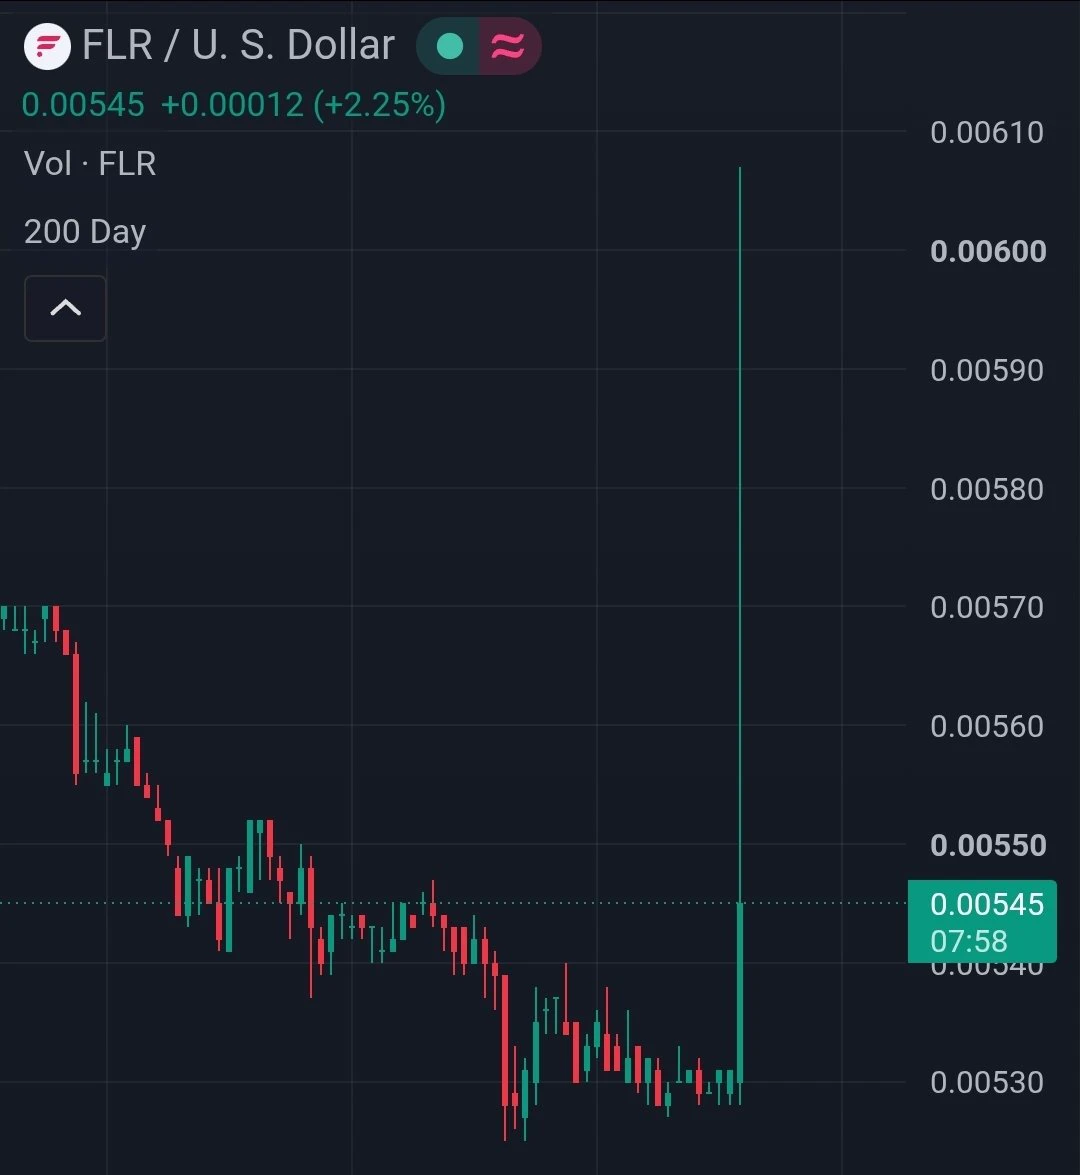
$FLR just spiked 15% out of nowhere!! 👀🚀
Looks like a whale is accumulating and taking advantage of these discounted prices.
Still a small move compared to the upside potential, but it's good to see stuff like this! 📈
post-image
FLR-0.24%
Market volatility reveals true skill, and the cycle of gains and losses puts it to the test.
With one precise market forecast after another, I have delivered results that stand up to scrutiny.

Things are accomplished through human effort, and knowledge must be put into practice. Real ability has never been proven by words alone—I believe everyone can see that for themselves.
#美国10月CPI全面超预期
2026.11.12
Daily opening line: 2074
Support below: 2070-2060–2050-2040-2010
Resistance above 2004: 2079-2090-2106-2115-
2120-2132-2143-2150-2160-2170
For all support and resistance levels, stop out on the first break; if they hold, look for a rebound. Once they hold firmly, follow the trend.
If 2158-2166-2181 holds, favor buying dips; otherwise, favor selling rallies. Break below 2050-2040-2004 and go short; if they hold, favor buying dips. Personal opinion for reference only!#Gate全球合规版图扩展 $ETH
ETH-1.23%
not going to mince words - but markets have a way of humbling everyone. Fortune favors the bold, but only if they survive.
post-image
CRWV save all chip and Memory trade.
$CRWV +21%
$MU +12%
$SNDK +14%
$STX +10%
$WDC +8%
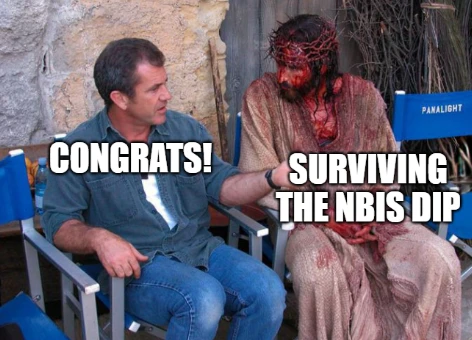
$NBIS +6%
$DELL +11%
Nasdaq 100 +1.70%
S&P 500 +0.80%
Near $700 billion added to the US market.
post-image
CRWV+25.85%
MU+13.90%
SNDK+17.27%
STX+12.62%
WDC+9.58%
$ARIA $ARIA The 4-hour chart is starting to waterfall! All I can say is: blindly short! There’s still time to get in! Target: 0.2! Welcome aboard!
post-image
ARIA+22.03%
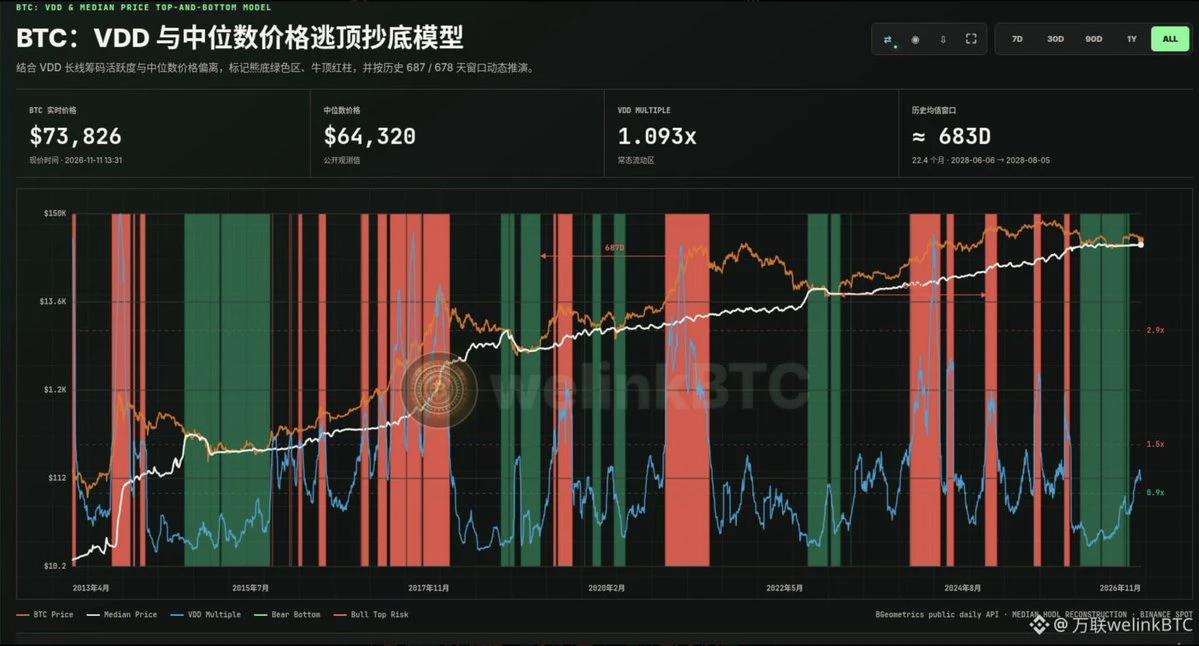
BTC: VDD and Median Price Top/Bottom Buying Model
The model currently gives the following combined signal: "Bear bottom completed, early stage of new cycle".
The latest daily VDD Multiple is 1.093x, which is in the normal liquidity zone; BTC is approximately $73,826, the median price is approximately $64,320, and the price/median ratio is approximately 1.15x. The last green zone ended on August 24, 2026, approximately 79 days ago (on-chain date November 10, 2026).
How to interpret this model? The green zone requires VDD to be below 0.9 and the price to be no higher than 1.25 times the median p
post-image
BTC-0.67%
Short-term bullish $SOL ‌ shows a bullish bias. The price is at 84.88, trading above the MA5, MA10, and MA30. A positive MACD indicates that buying momentum remains quite strong. - Resistance: 85.25 – 85.40 - Support: 84.00 – 83.50 - Scenario: Potential to test 85.40. A successful breakout could lead to further gains, while a failure to break through may result in a temporary correction. Conclusion: The bullish trend remains dominant, but be wary of potential rejection in the 85.40 area.

#每周来晒

#美国10月CPI全面超预期

#WCTCS9

Note: Crypto and stock transactions carry the risk of loss. Please co
post-image
SOL-0.74%
The $278 Billion Cash Shortfall Over Five Years Is the Real Answer to Whether AI Is Profitable

Discussions of OpenAI’s quarterly profit and loss can easily fall into a trap: using quarterly data to infer a trend. OpenAI’s financial constraints are not measured in quarters, but in years.

Financing documents disclosed by Bloomberg show that OpenAI expects to generate $278 billion in cumulative negative free cash flow from 2026 to 2030, with about $856 billion in compute and infrastructure investments over the same period. Its 2030 revenue target is $350 billion, while revenue in 2026 is expect
OPENAI-0.03%
$SNDK Up 17.51% in a day, peaking at 1007.29 and now at 1002.85, with trading volume of 2.64 billion—this isn't the kind of volume retail traders can generate. The 24-hour low was 828.38 and the high was 1007.29, a range of over 21%, a classic short squeeze plus high-volume breakout setup. I'll state the trading logic plainly: this kind of price-and-volume rise shows that new money is actively buying near the 1000 level, not that it's a bull trap.
My trading framework is simple. Entry logic: don't chase; wait for a pullback. The current price of 1002.85 is already close to the 24-hour high of
SNDK+17.27%
  • 9
  • 1
Damn, OpenAI’s financials look like it’s burning cash at the speed of a money printer, turning “go big or go home” into “massive losses in exchange for growth”!

The newly released Q3 financials are a real eye-opener: quarterly revenue surged 50% sequentially to $10 billion. But the cost of that growth was an adjusted quarterly operating loss that widened from $10.1 billion to $10.9 billion.

A lot of people’s first reaction might be “losses are narrowing” or “economies of scale are kicking in,” but a closer look at the numbers shows it’s not that simple.

Revenue jumping 50% in just three mon
post-image
MSFT-2.66%
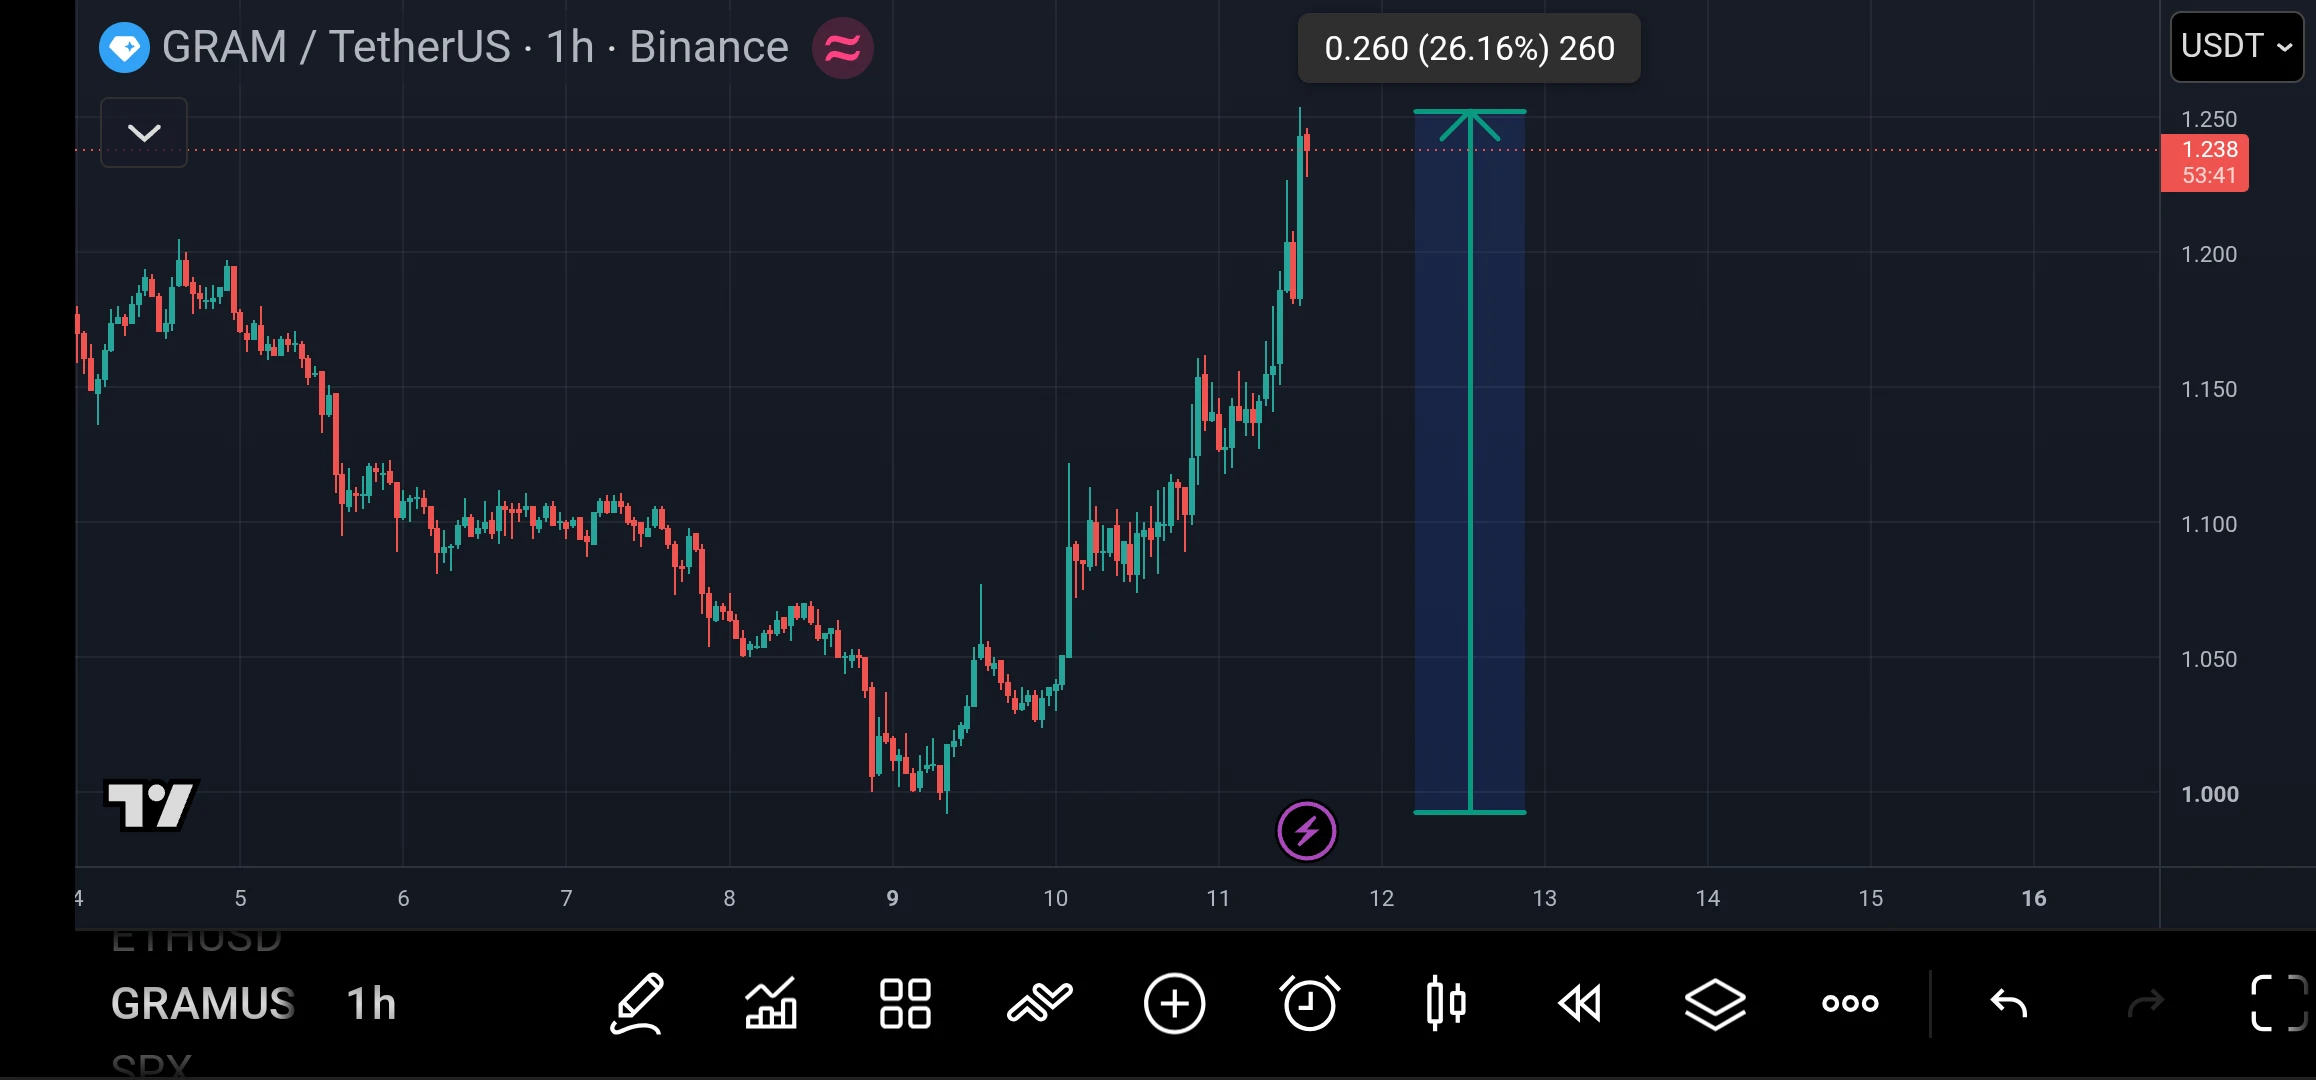
$GRAM bounced about 26% from just under $1.00 to $1.25 before easing to $1.24. On the hourly chart, buyers have stepped in at higher prices on each dip.

I’m watching for an hourly close above $1.25 to show buyers still have momentum. On a pullback, I’d watch whether $1.20 holds as support.
post-image
GRAM-0.97%
  • 3
Keep it steady, brothers! We still gotta eat! Follow Ah Gui all the way to the other side, okay, brothers! $ETH ‌$BTC
ETH-1.23%
BTC-0.65%
Long/short account ratio 2.0239; $SUI shrugs off shutdown rumors
The market is trading the rumor that the Suiet wallet will shut down after November 14, but $SUI rose instead of falling: buyers pushed it from 0.8273 to 0.8484, up 2.55%. This buying support makes me bullish.

Money is more honest than words. The long/short account ratio is 2.0239, and the funding rate is 0.0001—not crowded or overheated, with plenty of ammunition to add to positions. The current price is near the top of the 24h range of 0.8033 to 0.8492; it just needs one more push to break through.

Down 8.7% over 7 days and 1
SUI-1.05%
Load More

Join 40 M users in our growing community

⚡️ Join 40 M users in the crypto craze discussion

💬 Engage with your favorite top creators

👍 See what interests you

Trending Topics

GateIPOAccessAnthropic

2.42k Views1.47k Discussing

Gate IPO Access Phase 3 features Anthropic (ANT), with USDT subscription interest starting from 100 USDT. Successful allocations will be delivered as real shares to Gate Stock Accounts. Indicative price: $70–$78/share Subscription: Nov 12–17 (UTC+8) Allocation is not guaranteed. Please manage risk accordingly. [👉 Subscribe Now](https://www.gate.com/ipos/ipo-access/anthropic-ipo-access/69)

USOctoberCPIBeatsExpectations

98.98k Views2.76k Discussing

GateGlobalComplianceExpansion

22.34k Views387 Discussing

View More