Share your thoughts
placeholder
Article
Got it, got it. Welcome to the livestream.
I didn’t do anything—I just went to the restroom, and when I came back, the candlestick chart had already done the work for me. I was watching $BSB as soon as the market dumped in the morning session. It had a strong bull-trap feel, with volume failing to follow—classic price going up with no one buying—so I opened a short at 0.61559. Many people panicked and cut their losses during that sharp drop, but I saw an opportunity emerging. When I came back, the current price was 0.1082, with a return of +1622.9%. That was a satisfying bite.

The market is waited out, and profits are held out. A qui
post-image
BSB+0.01%
SNDK+10.31%
XRP-3.82%
My hand trembled as I set the stop-loss a few days ago, only to discover this morning that the filial piety was unnecessary. When I opened the chart this morning, the current price had already surged to 0.07955, with floating profit directly reaching +444.75%. Taking off! All I want to say now is, this round of holding on was worth it.

Looking back at the entry, $COLLECT was still bottoming and moving sideways around 0.06495, holding for most of the day without breaking down, while volume gradually declined—a typical buildup before a breakout. I placed a long order and left the rest to time.
post-image
COLLECT-3.30%
DOGE-4.96%
XRP-3.82%
Nonfarm market conditions fluctuated violently, leaving many traders trapped in losing positions and hoping for a swift reversal to escape them.
But the market will not cater to subjective expectations; the more deeply one clings to them, the greater the account losses tend to be.
Knowing when to make timely trade-offs is the most difficult—and most crucial—required lesson in trading. ​​​$BTC $ETH #BTC收复8万美元
post-image
BTC-1.63%
ETH-1.72%
$Lobster
$BICO
Lobster vs. BICO
post-image
龙虾+19.63%
BICO+11.21%
ethereum:0x07f5b6823751c2e2cd4560f28af75ff887102241 just exploded.
$535M MC. $178M volume. 3,105% in 1 month.
Robinhood Chain's launchpad king.
705M supply. 35% vol/MC ratio.
I bought at $0.02.
You're buying at $0.75.
We are not the same. 🚀🔥
#PONS #RobinhoodChain
post-image
PONS+35.92%
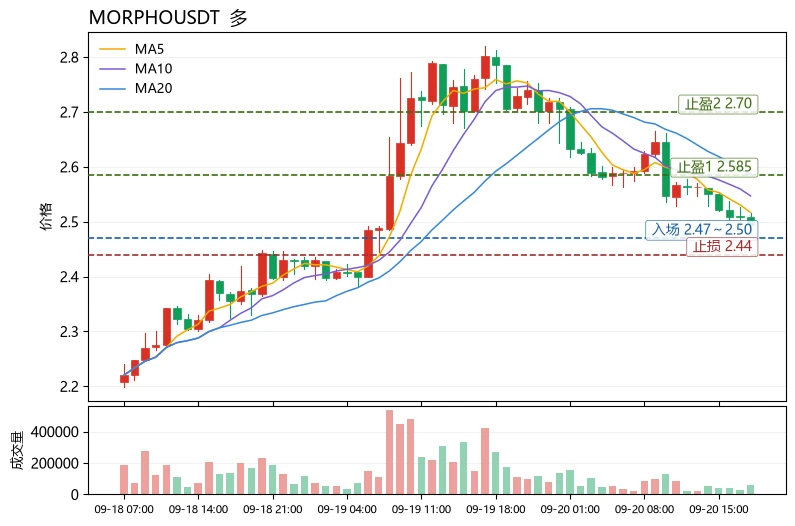
$MARSCOIN Signal】Long continuation + pullback support
$MARSCOIN RSI 1H 69.28, after spiking to 0.19688, it pulled back to around 0.17591 and moved sideways. The 4H bullish candle closed with its body at 0.18565, while the 1H MACD red bars shortened and volume declined from its peak. Order-book bids are concentrated around 0.1690, with selling pressure slightly higher but no sustained selling.
🎯Direction: Long
⚡Entry/limit order: 0.1753823 - 0.1759100
🛑Stop loss: 0.1740412
🚀Target 1: 0.1787132
🚀Target 2: 0.1801148
🛡️Trade management:
- After reaching Target 1, reduce the position by 50% a
post-image
MARSCOIN+55.71%
Crypto + stock market updates
live-cover
LIVE1,629
I had just switched the software to the background, and it plunged in an instant—was it playing hide-and-seek with me? When I checked the chart after lunch, I noticed that selling pressure had clearly strengthened, the rebound was getting weaker and weaker, and volume hadn’t followed. With obvious resistance above, I knew it was time to open a short position. Entered at 0.9133, now at 0.5745, +2633.73%—I caught the rhythm of this move perfectly.

No operation, no analysis, just pure luck—this track record is embarrassing even to mention. But the market did indeed present an opportunity. Take
post-image
ZEC+6.09%
XRP-3.82%
Technical Analysis of a ZECUSDT Short
ZEC price just made a new ATH at 1.029 before being rejected and is now consolidating around 981. The medium- to long-term trend remains strongly bullish (strong pump + Grayscale ETF news + privacy coin narrative), but signs of exhaustion have already appeared on lower timeframes.
MACD Divergence
Yes, there is clearly a bearish divergence:
Price made a higher high (1.029 vs. the previous high of ~980).
MACD made a lower high (the second peak is lower than the first peak).
MACD is currently negative (MACD -1,39 / DIF -0,85 / DEA 0,54) and the histogram is s
ZEC+6.09%
  • 8
I did nothing—just went to the bathroom, and when I came back, the candlestick chart had already done the work for me😏.

While the market was repeatedly swinging intraday, $BILL was still hovering at high levels. The upward push was weak, while the selling pressure kept getting harsher. Seeing how weak the support was, I immediately opened a short position at 0.07826. I didn't have high hopes at first, but when I came back to check the market just now, the price had dropped straight to 0.01559, +1576.49%? This was a huge profit🍗.

The market is waited out, and profits are held onto. But wh
post-image
BILL-9.93%
BNB-0.37%
DOGE-4.96%
$ZAMA This short trade went exceptionally smoothly, with returns approaching 4.7x.
The entry opportunity for this coin was shared earlier in the chat, and the price is now nearing the first take-profit level. The short-term decline has been substantial, and a rebound shakeout could come at any time.
At this stage, don’t expect to capture the entire downtrend. Take partial profits first, and keep holding the remaining position with a stop-loss in place. The market will not continue moving in one direction forever, so risk management must never be neglected.$AIO #BTC收复8万美元
post-image
ZAMA-8.27%
AIO+0.91%
$AZTEC Signal】Bullish momentum continues, strong 1H consolidation
$AZTEC 4H MACD histogram expanding, RSI 86.25 flattening at high levels. The 1H Bollinger upper band at 0.0179 was touched, order book depth imbalance at -9.13%, selling pressure present, price has not broken below 0.0177.
🎯Direction: Long
⚡Entry/Limit order: 0.0177267 - 0.0177800
🛑Stop-loss: 0.0168910
🚀Target 1: 0.0191135
🚀Target 2: 0.0197803
🛡️Trade management: - Reduce the position by 50% upon reaching target 1 and move the stop-loss to breakeven. Exit if the price falls below the entry zone.
4H RSI 86.25, funding rate
post-image
AZTEC+11.02%
BTC-1.63%
ETH-1.72%
SOL-2.33%
SOL at $101—are you buying the dip?
First, on the surface: a strong jobs report crushed rate-cut expectations, and the price was rejected from $109 back to $100.
Today's August jobs report showed +162k jobs, far above the expected 56k, while the unemployment rate held at 4.1%. Is the hawkish Fed going to toughen its stance again? The probability of a September rate hike has been pushed back up. SOL plunged directly from $105 to $101, with panic sellers fleeing in droves.
The K-line tells you: the daily price remains above the 20/50/200 moving averages, and the bullish moving-average alignment
post-image
ETH-1.72%
SOL-2.33%
BTC-1.63%
  • 1
Already up 17% on the trade! 🚀
Who held it longer than I did....
Is this really a rebound? It’s CPR for my empty account, isn’t it? I was just about to curse it a couple of times, but then I saw that the current price had already reached 95.13, with unrealized gains at +338.3%—this move gave us the answer! The trend was clean and decisive; everyone on board should be waking up laughing.
Looking back at the repeated intraday fluctuations, $INTC hovered around 90.88. I watched it for half an hour and noticed that funds quietly entered every time it dipped, while the key levels on the sell side became increasingly thin. Details like these don’t lie. I said at
post-image
INTC+5.72%
LAB-0.96%
SOL-2.32%
$ZEC
🎯 TARGET ACHIEVED:
Remember when we watched this at 825 with that 803 support line holding the trend?
It broke clean through and just hit 1,028 that was the move.
Now consolidating around 980 after the rip, which is healthy. Supertrend still green at 888.35.
This one delivered exactly what the structure promised.
Next zone to watch is 918 support on any pullback
post-image
ZEC+6.04%
  • 5
HOOD at $122—would you buy it?
First, look at the surface: normal consolidation after a massive bullish candle.
The spot price surged 16.57% in a single day yesterday, with volume exceeding 51 million shares. It hit an intraday high of 124.88, while perpetuals touched 126 before pulling back. Today, it retraced to around 122, narrowing its 24-hour gain to approximately 11%. But from the March low of 64 to now, it has nearly doubled. All moving averages are in bullish alignment, and the medium-term trend is clearly upward, but RSI is already overbought, so the short term needs consolidation.
Fi
post-image
BTC-1.63%
HOOD+0.55%
UNI+2.56%
Load More

Join 40 M users in our growing community

⚡️ Join 40 M users in the crypto craze discussion

💬 Engage with your favorite top creators

👍 See what interests you

View More