Square
Following
Hot
News
Notifications
Profile
Share your thoughts
placeholder
Article
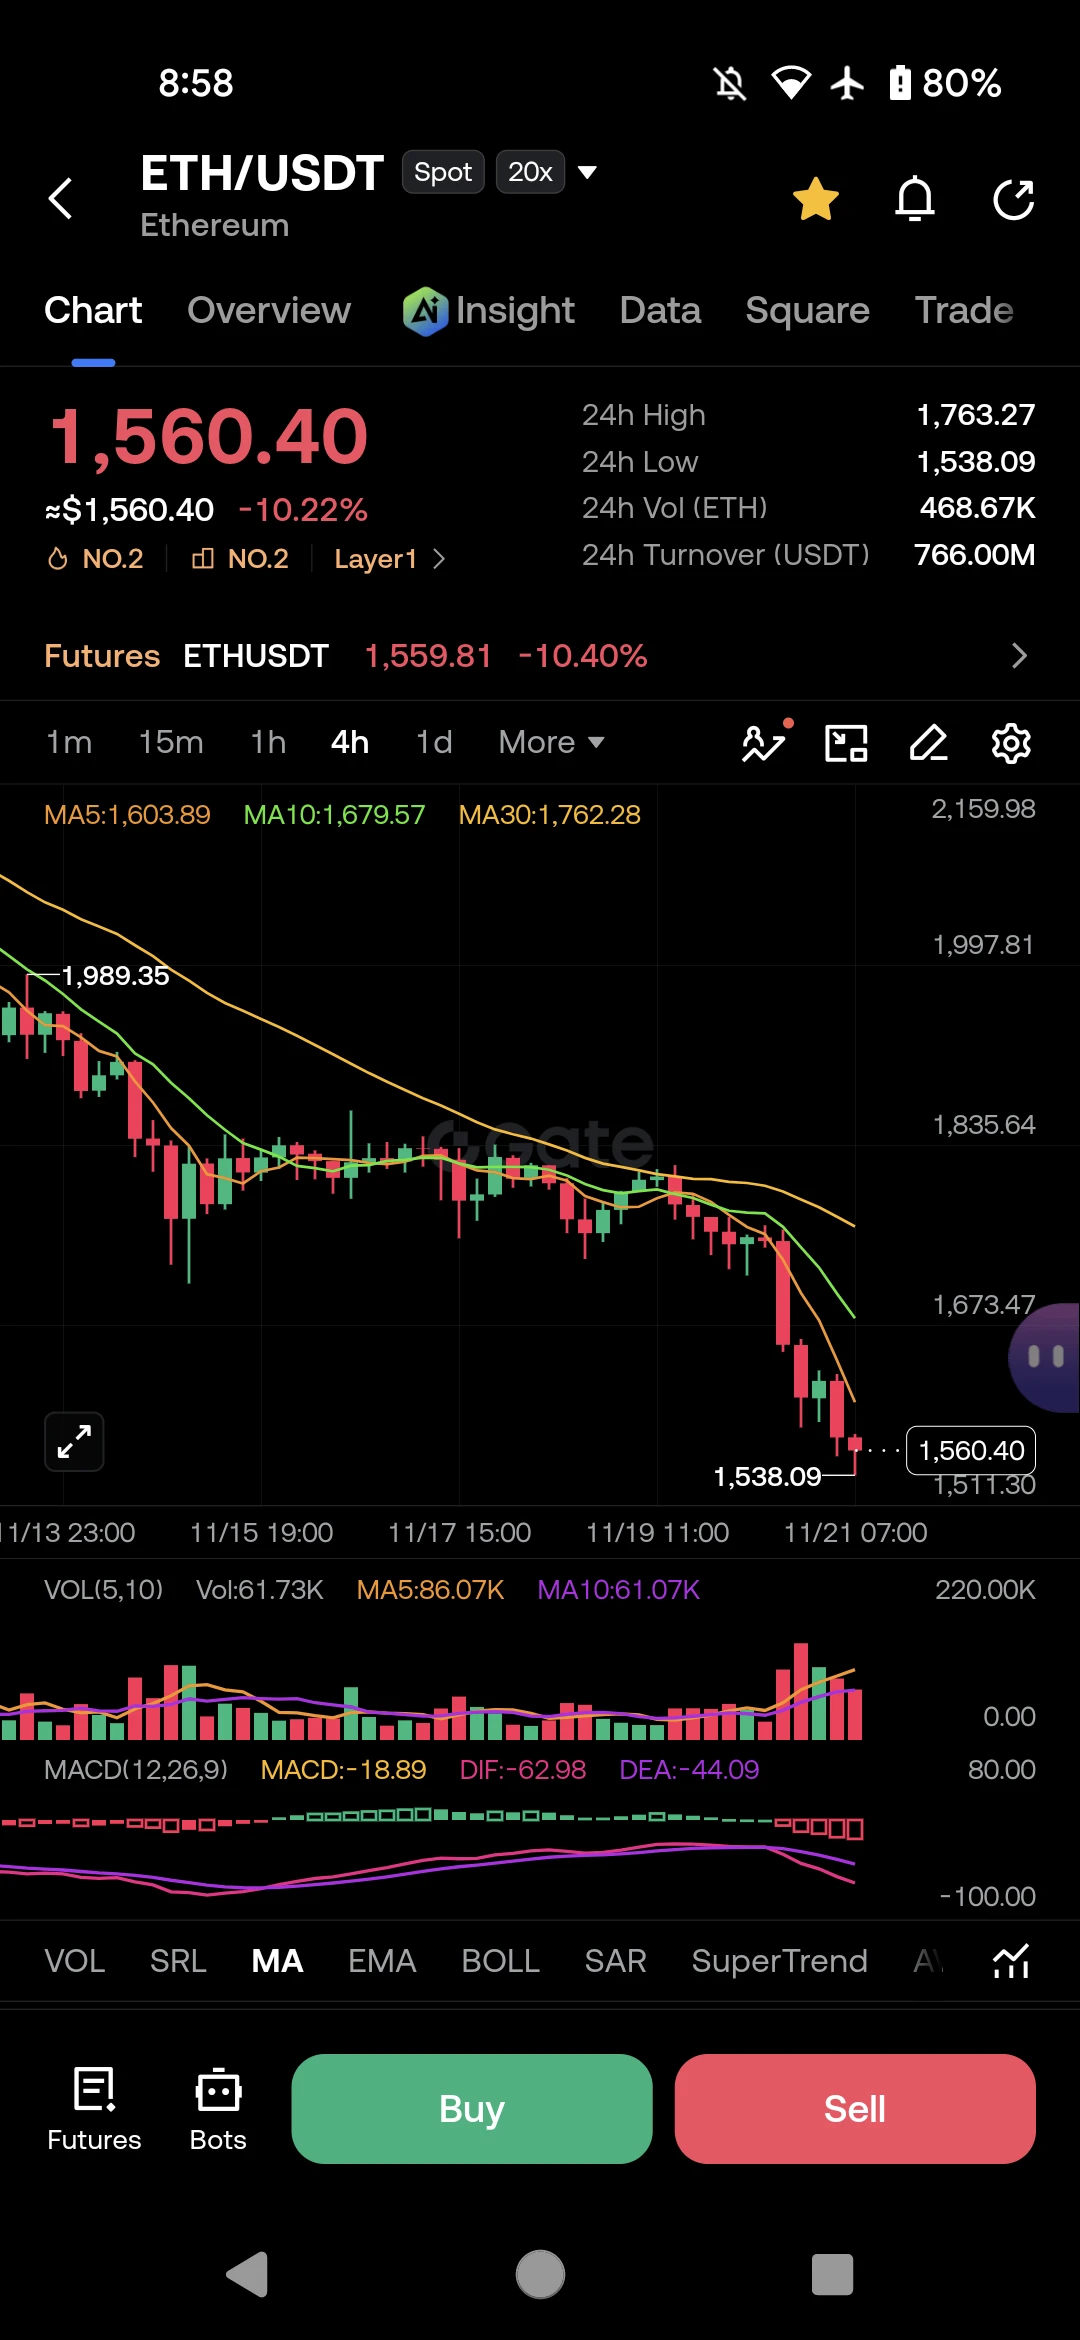
$ETH LIQUIDATION CASCADE: NO BOTTOM IN SIGHT 🩸

Price is in a complete freefall, trapped far below all major moving averages. Sellers are relentlessly dominating the chart with zero signs of a bounce. Fade the weakness!

Trading Ideas Short $ETH
Entry: 1,560 - 1,580
SL: 1,620
TP1: 1,538
TP2: 1,500
TP3: 1,450

trade $ETH here :👇
post-image
ETH-1.23%
  • 2
  • 1
I got liquidated on futures, so I’m taking a couple of days off. Now I can’t look at anything without first calculating how much money I’d have to put in and how long I’d have to wait.
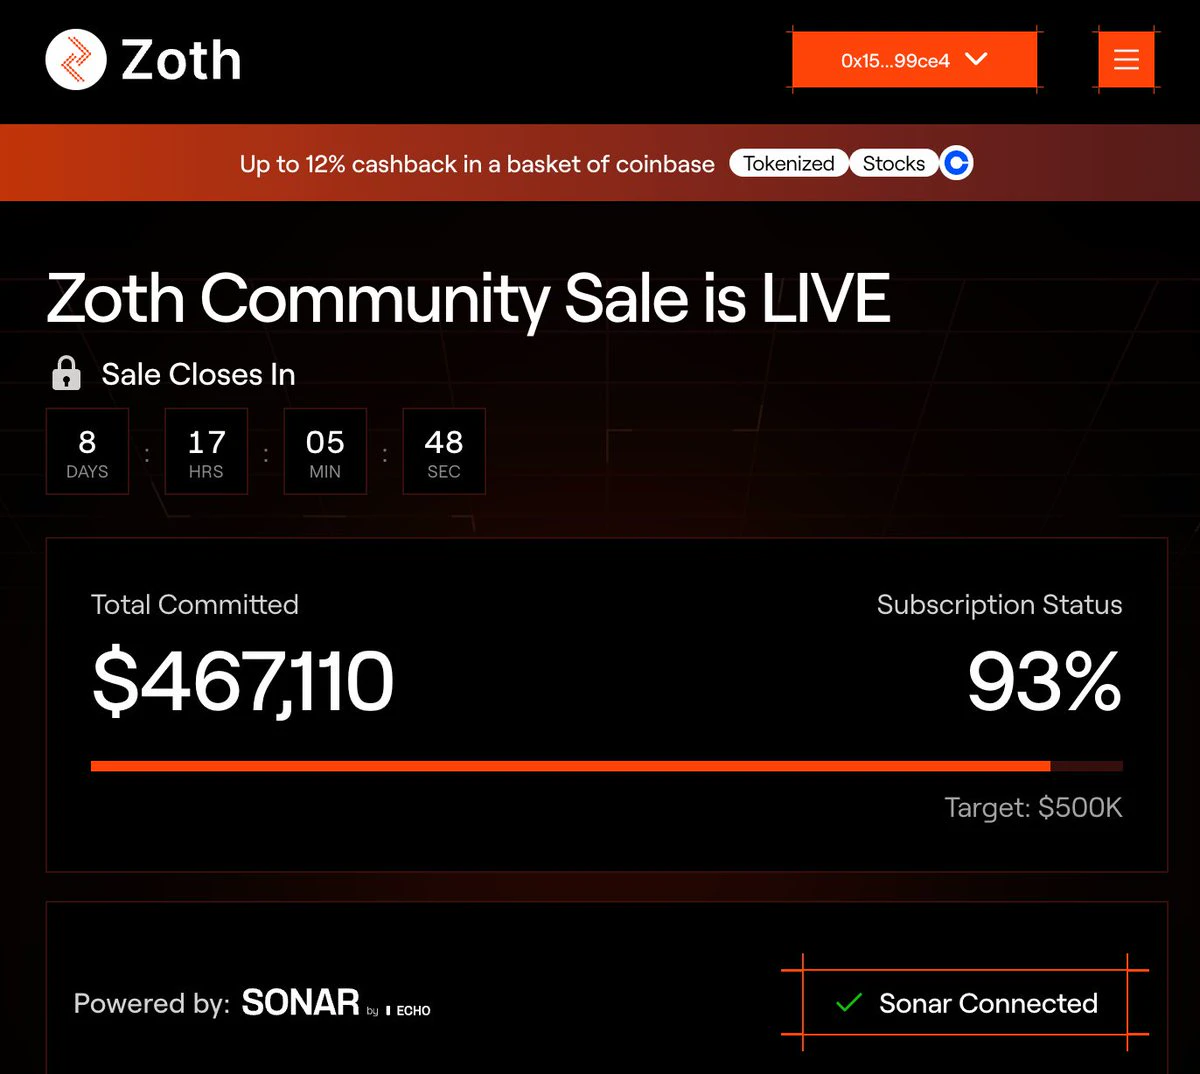
@zothdotio The terms for the Platinum tier in this Sonar community sale are pretty easy to calculate: $0.18 per ZOTH, with 35% unlocked at the token generation event (TGE), and the remaining 65% locked for two months before being released linearly over five months.
As a round-number example, $100 would get you about 555 ZOTH, with around 194 available in the first tranche. Running the numbers like this makes thi
post-image
Trenches
FIONA
F
bade
b
FIONA
B34n...pump
Market Cap
$.
Change
.
24h Vol
$.
Holders
.
PIEVERSE
P
bade
b
PIEVERSE
0x0e...25a9
Market Cap
$.
Change
.
24h Vol
$.
Holders
.
mihao
m
bade
b
mihao
4Cxj...pump
Market Cap
$.
Change
.
24h Vol
$.
Holders
.
PROS
P
bade
b
PROS
0x8b...9832
Market Cap
$.
Change
.
24h Vol
$.
Holders
.
CLAUDIA
C
bade
b
CLAUDIA
2j5S...W2ZM
Market Cap
$.
Change
.
24h Vol
$.
Holders
.
#Analytics

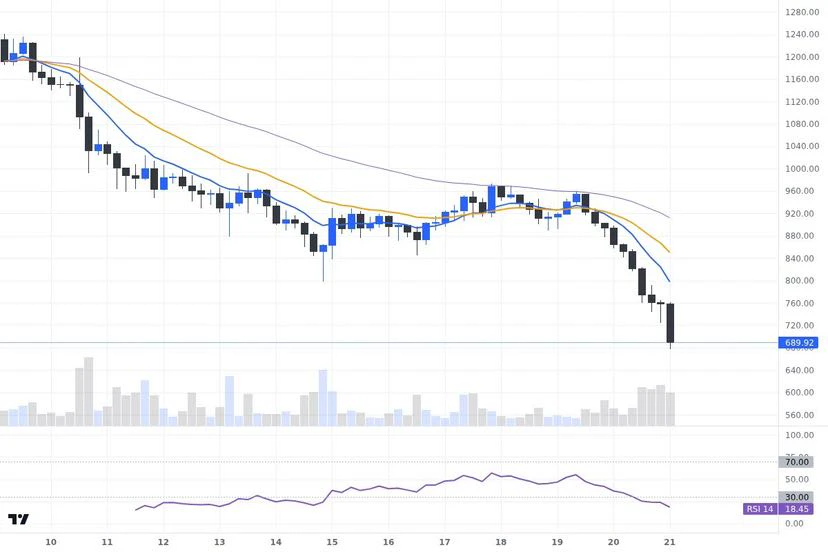
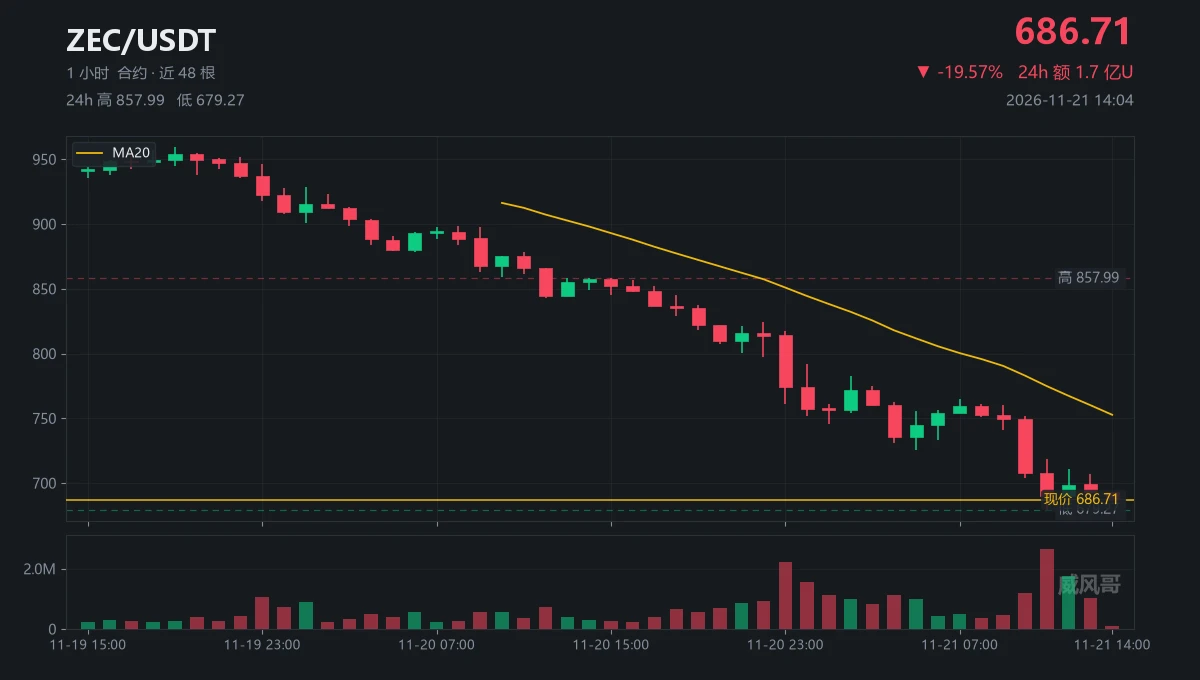
#ZEC High volume does not soften the picture of decline

ZEC stands at $689.9 after falling 20.27% in 24 hours. The assessment is negative: on the four-hour chart, the price is below the EMA 20 ($850.4) and EMA 50 ($916.8) moving averages, with the short-term average below the long-term one. Weakness is evident not only in the 24-hour change but also in the price’s position relative to both averages.

The volume of the most recently closed four-hour candle is 1.99 times higher than the average volume of the previous twenty candles. This is notable activity amid a sharp 24-hour decl
post-image
ZEC+1.16%
  • 1
BTC drops below $60K for first time in a while, altcoins plunge
Bitcoin has broken below $60,000 for the first time since early July.
Bitcoin continued to face heavy selling pressure and fell below the $60,000 mark for the first time since July. At the time of recording, BTC dropped approximately 3.08% to $59,610, breaking the key psychological level of $60,000.
⚠️ Personal market analysis only. NFA — manage risk and DYOR.
Educational content, not investment advice or a recommendation to buy, sell, deposit, or withdraw any asset. No paid promotion or referral/affiliate links.
post-image
BTC-0.67%
Another weekend where BTC fell more than ETH
If I remember correctly, last weekend was the same
It was the same during the June bottoming: BTC broke support 【ETH didn't】
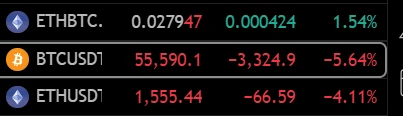
Same today: BTC has already broken support 【even dropping below $2,000】
ETH still hasn't broken below its June low
So strange, so strange
post-image
BTC-0.67%
ETH-1.26%
  • 1
Evidence: The 12:00 candle, with 1.77 million contracts, lifted the price from 679.27 to 710.65.
One question: Who paid for those 31 bucks?
Characterization: The 11:00 candle had the day's highest volume at 2.63 million contracts, 2.5 times the average.
Then look: At 13:00, just 1.01 million contracts were enough to pull it back from 706.8 to 692.8.
It took 1.77 million contracts to push the price up and 1.01 million to smash it back down. Who's benefiting?
Third question: $ZEC The funding rate is still positive, at +0.005%. Longs pay to hold overnight every day—what for?
Position: Now around
post-image
ZEC+1.29%
  • 2
  • 1
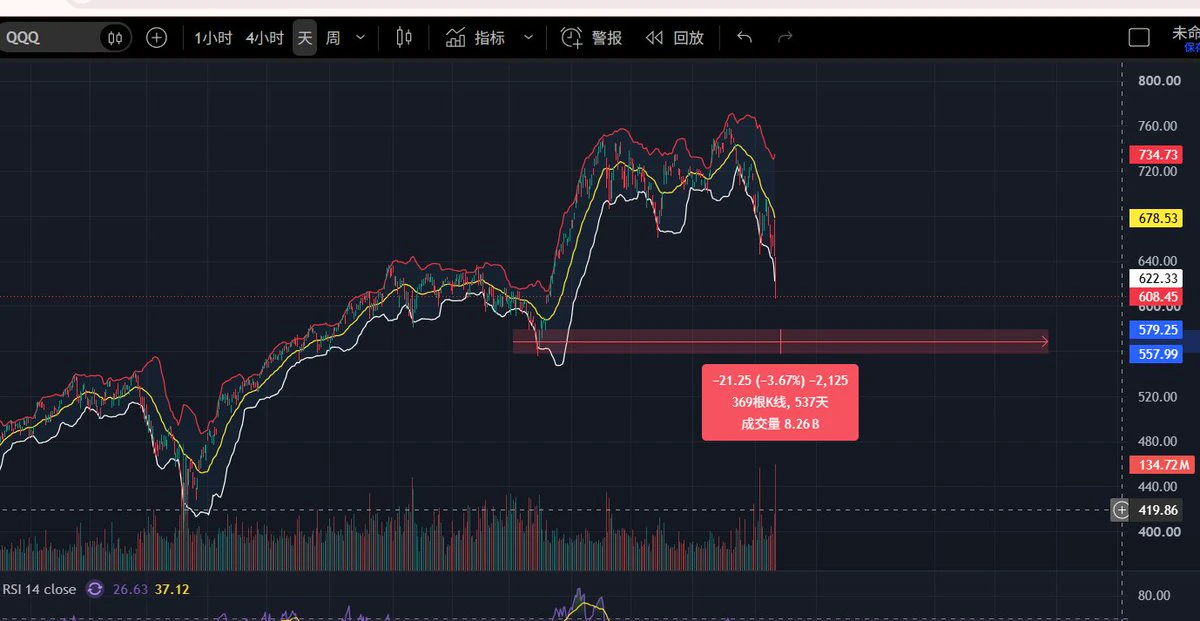
Don't buy the dip! Don't buy the dip! Is anyone listening?! Bitcoin has bounced slightly—don't be fooled! There's still plenty of room to fall, and selling pressure overhead continues to weigh on the market. Whatever you do, don't assume that because it's fallen a lot, it has to rise, and buy the dip. A reversal is unlikely in the short term.

Once a trend is established, it won't change easily. Keep the same strategy: a rebound is an opportunity to open short positions at higher levels!

Sell short in batches if it rebounds to the 579-586 range, with 553 as the initial target. Follow the bear
BTC-0.67%
Whatever hardship you endure, you’ll definitely make it up from others in one way or another.
post-image
The Bank of Communications stock I bought in 2007 finally broke even after 20 years.
Ladies on Xiaohongshu, as long as you can hold on to the gold and silver you bought, you’ll definitely break even 😂😂😂
post-image
BANKCOMM-0.28%
GLDX-0.40%
PAXG+0.37%
Bullish news is being rolled out again
Is a major comeback rally coming?
post-image
  • 3
  • 2
$PI This PI coin has trapped three waves of buyers so far: the first wave bought in near the highs, from $3 to $1; the second wave bought in at mid-range prices, from $0.9 to $0.1; and the third wave is buying in near the lows, from $0.09 to $0.01, and is happening right now—!!!
post-image
PI-0.60%
Analysis new crypto coin
live-cover
LIVE1,746
GT-2.41%
ETH-1.26%
BTC-0.67%
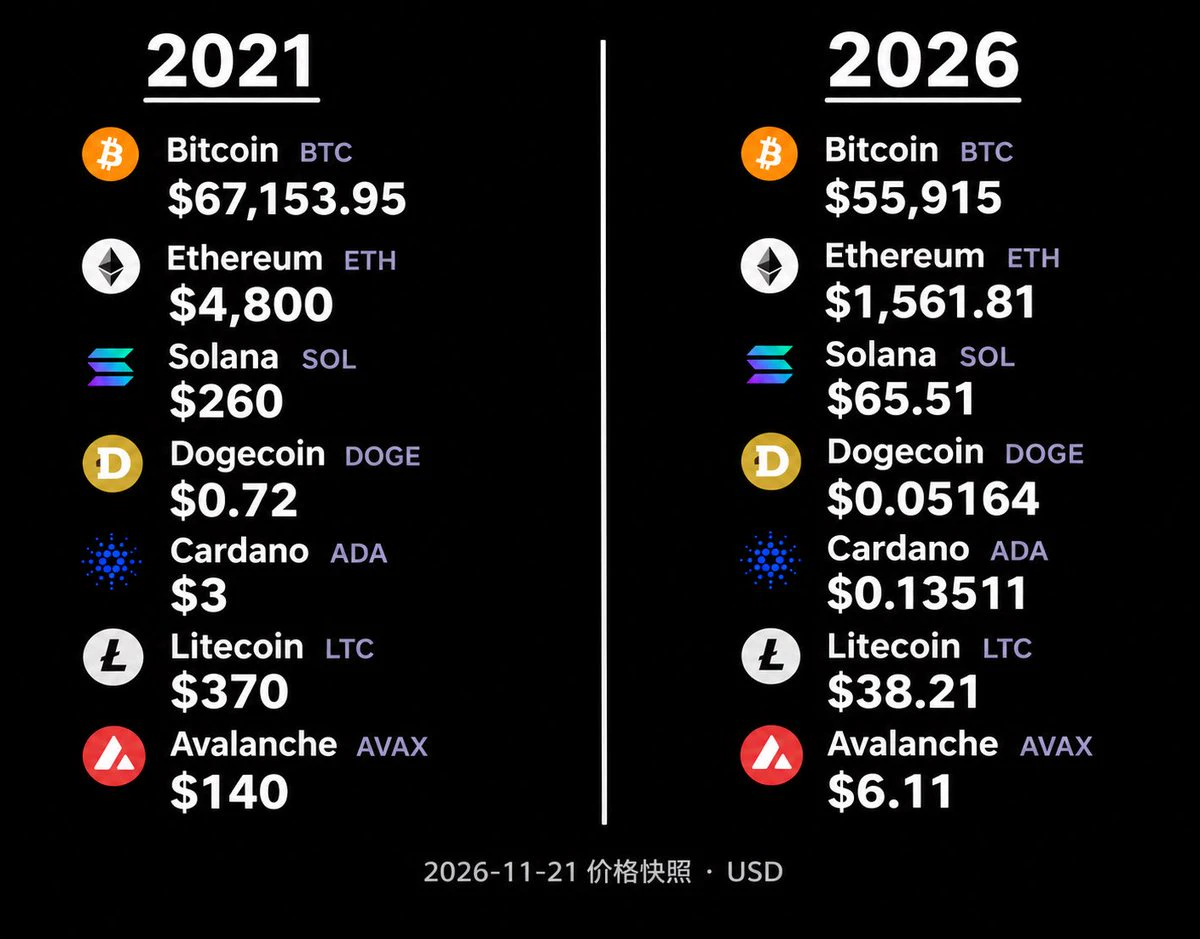
Five years have passed, and $BTC is back at its price from five years ago. Many altcoins have even fallen by more than 90%.
Over these five years, we experienced bull markets, bear markets, surges, and crashes.
Some people saw their investments grow tenfold, only to lose it all and end up back where they started.
Some endured the entire bear market, only to exit just as the bull market was beginning.
Others did nothing and held on for five whole years, yet their accounts are still in the red.
The most ironic thing is that even though we experienced so many rallies, we may never have actually
post-image
BTC-0.67%
  • 1
Those who have been in the market for a long time were probably all fooled by this bull trap
As of today, I've lost about 4% of my total position in this move
I'm already a very conservative person, and I still don't know how much I'll lose
The long squeeze is almost over too, [by next week at the latest?]
At this rate of decline, I don't think anyone could take another five days of this next week
That's unlikely, and I guess a big rebound is coming soon
I'm really hoping we reach the red-line zone [there's definitely going to be a massive rebound there]
I still have to say something here—if I
post-image
Last night was Black Friday for U.S. stocks: the Philadelphia Semiconductor Index fell 10.73%, Nvidia dropped more than 14%, and Micron and SK Hynix’s U.S.-listed shares both fell more than 13%.

$SKDD was the other side of the trade: On the morning of 11/20, it was still at 12.37 to 12.48, and this position opened at 12.641, right around there. Based on Seoul’s closing price, it likely rose to around 15.3 to 15.6 overnight.

Looking further back, its low on October 5 was 6.21, and it was still around 8.7 in early November, more than doubling in just over three weeks. This night merely amplif
post-image
SKDD-1.02%
BTC-0.65%
ETH-1.23%
  • 1
#ShareWeekly #BTC #WCTCS9

BTC Breaks Below $58,000: Is Bitcoin Entering a Deeper Market Correction?

Bitcoin has reached another critical moment as BTC/USDT breaks below the psychological $58,000 level. According to the latest market update, Bitcoin is trading around $58,000.35, with a 24-hour decline of 6.33%. This is more than an ordinary daily pullback. It reflects growing selling pressure, weakening short-term confidence, and increasing uncertainty across the cryptocurrency market.

In my view, the most important question is no longer simply how far Bitcoin has fallen. The real question
BTC-0.67%
  • 3
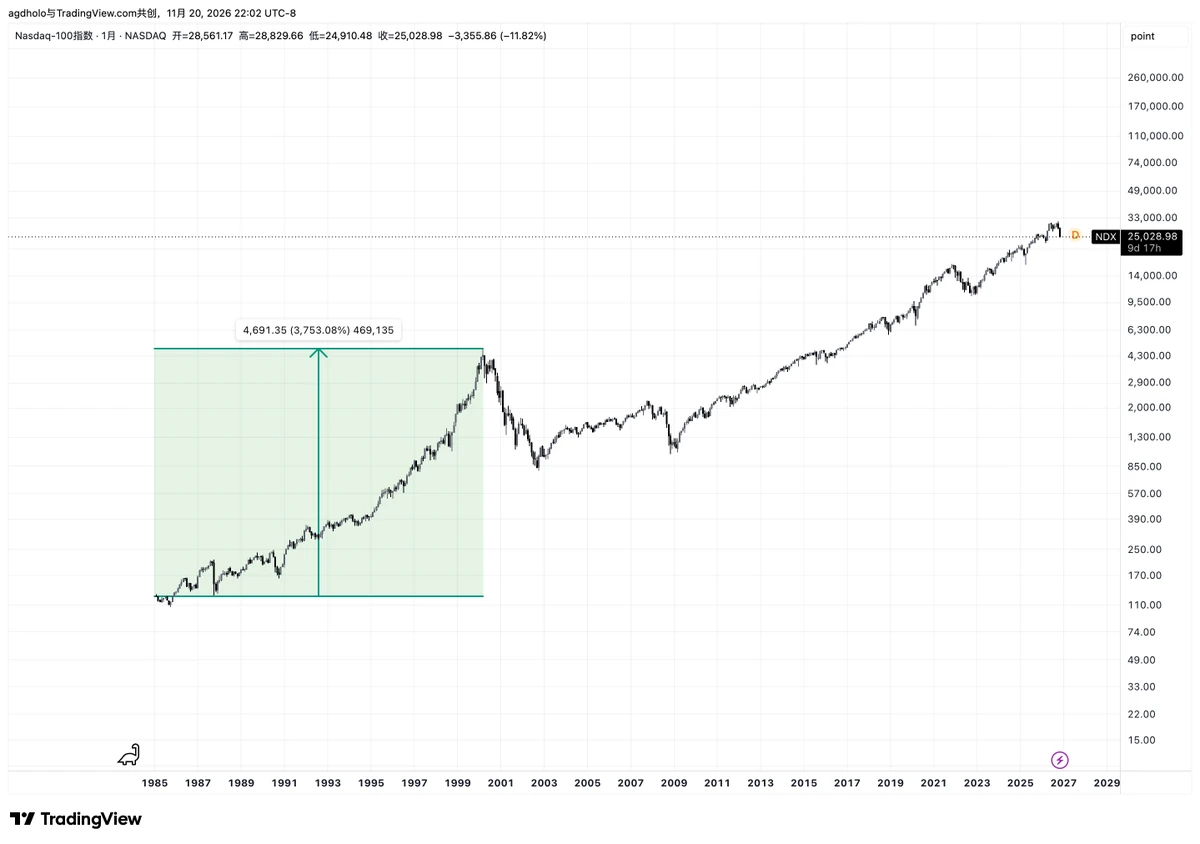
Someone tells you the Nasdaq fell 83% in 2000 and took 16 years and 5 months to return to its previous high, warning you not to buy the dip,
but doesn’t tell you that from 1985 to the 2000 bubble peak, the Nasdaq rose 37-fold,
nor that the right way to invest is dollar-cost averaging, holding positions in proportion, and dynamically rebalancing,
nor that the most worthwhile U.S. stock market index to follow is the S&P 500,
nor that investing everything at the 2000 peak is called buying the top, chasing highs, and going all-in.
They only point to the decline and being stuck for 16 years to tell
post-image
NAS100-4.60%
US500-3.01%
11.21 BTC Analysis

Yesterday's small rebound also let us capture around 1,000 points before exiting. BTC's hourly chart has once again seen a sharp drop on increased volume, and daily support has been breached. The Bollinger Bands continue to open downward, confirming a clear bearish trend. After falling continuously, the market is deeply oversold, with short-term selling pressure being released in a concentrated burst, making a long wick that lures buyers highly likely. The rebound's staying power is hard to guarantee. The balance between bulls and bears is currently skewed, with insufficien
post-image
BTC-0.67%
I still can’t think of any downsides to being good-looking.
Load More

Join 40 M users in our growing community

⚡️ Join 40 M users in the crypto craze discussion

💬 Engage with your favorite top creators

👍 See what interests you

Trending Topics

BTCBreaksBelow60K

2.1M Views29.1K Discussing

BTC fell below $60,000 on November 20 for the first time since July, alongside a tech stock selloff and broader pressure on risk assets. Will $60K become resistance, or can BTC quickly reclaim it? What price or volume signals would convince you that selling pressure is easing?

GateDirectIPOPhase3ANTAllocates92100Shares

739.5K Views4.8K Discussing

NvidiaDropsNearly14Percent

310.5K Views7.5K Discussing

View More