Square
Following
Hot
News
Profile
Share your thoughts
placeholder
Article
Excellent, Gate is powerful!
post-image
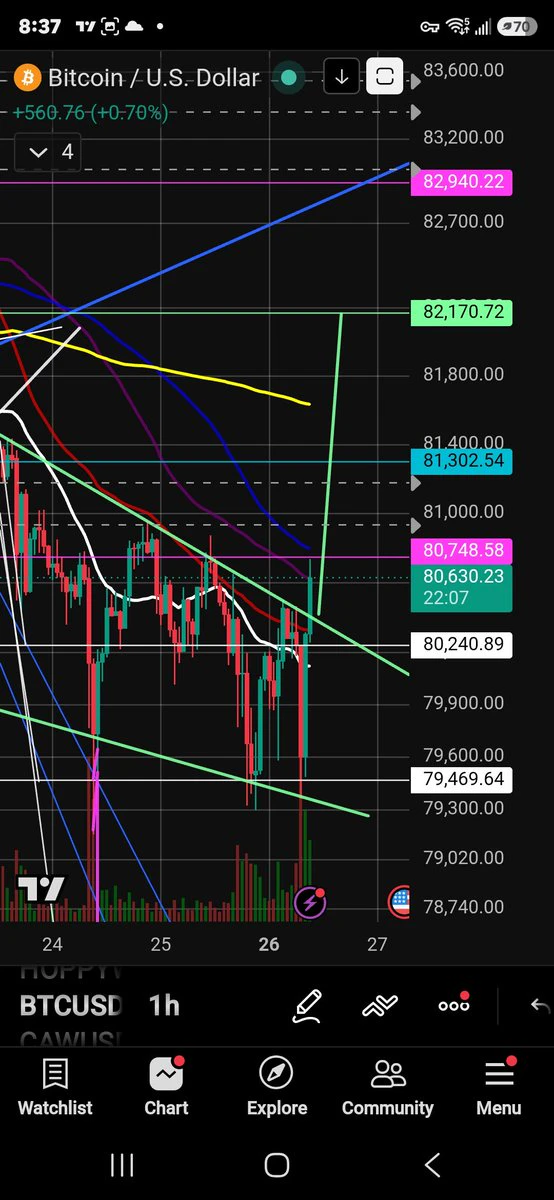
BTC strategy given this morning: hitting the 80200 structural level, it rebounded directly by 1000 points
post-image
JiaheSisterPing
10.15 BTC intraday market
Last night, the market moved sharply downward following the release of the CPI data; overall, the market still favors shorting at high levels.
Bitcoin needs to complete its correction on the 2-day chart; a rebound is underway on the daily timeframe. The 81,200 level has already been retested three times; after the large bearish candle on the 12-hour chart; underwater rebounds on the 4/6/8-hour timeframes
The 15/30-minute timeframes are bottoming; pay attention to the strength of the intraday rebound
Upside resistance: 82578 83624 84433
Downside support: 81200-80800 80200 79100-78500$BTC
repost-content-media
BTC-3.42%
For those trapped in longs opened at 83,500 and down 2,500 points, $BTC if it crashes to 81,000, keep holding and you could be wiped out at any time!
The most brutal thing in crypto isn't the drop—it’s knowing the danger and still refusing to let go.
BTC is now hovering around 81,000. The 1-hour chart clearly shows heavy-volume selling all the way down from the highs, with a bearish MACD crossover and RSI plunging into the oversold zone at 30. But trading volume continues to rise, indicating distribution by major players rather than an ordinary pullback.
The fund flows are even more alarming:
post-image
BTC-3.47%
ETH-6.23%
today morning update
live-cover
LIVE2,188
🔥XLM has collapsed! The short sellers’ feast has begun!
XLM has completely crashed today, plunging 5% in 24h, with a trading volume of $16 million and shrinking liquidity. Support levels have been breaking one after another, and the bulls have already surrendered. Those entering short positions now are simply picking up free money. After the breakdown, every attempt to buy the dip is like catching a falling knife—reaching out will only get you cut. Panic selling and stop-loss orders are trampling over each other, and the bears will not stop until they have squeezed out every last bit of profi
post-image
XLM-6.41%
#USSeptemberCPITopsEstimates
US CPI Report: September 2026
Micro- and Macro-Level Analysis with Implications for the US Stock Market.
The Bureau of Labor Statistics reported on October 14, 2026, that the Consumer Price Index for All Urban Consumers (CPI-U) rose 0.6% month-over-month (seasonally adjusted) in September and 3.7% year-over-year.
This marked an acceleration from August’s 3.4% annual rate and was slightly above or in line with most consensus forecasts (around 3.6%).
Core CPI (all items excluding food and energy) rose 0.3% monthly and 2.6% annually, up from 2.4% the prior month and
post-image
GAS-5.28%
XAU-0.39%
SPX500-1.60%
US500-0.45%
10.15$BTC Silk Road
# Market Analysis
After surging to 84146.72, the market quickly plunged, falling to a low of 81398.37 before briefly stabilizing and moving sideways. The Bollinger Bands are opening downward, the MACD is in a death cross, and the green bars have narrowed somewhat, indicating slight exhaustion in bearish momentum. In the short term, the market is in a low-level consolidation and recovery phase following the sharp drop. Resistance above: 82200; support below: 81398.37.
## Bullish Strategy (Long)
✅Long rationale: After several consecutive sharp declines, the price stabilized a
post-image
BTC-3.47%
#USSeptemberCPITopsEstimates
U.S. September CPI Tops Estimates: October 15 Market Outlook for BTC, ETH, Gold & SNDK
Inflation Surprise Triggers Market Volatility as Traders Reassess Risk
Global financial markets are facing renewed uncertainty following the hotter-than-expected U.S. September CPI report. The latest inflation surprise has put Federal Reserve policy expectations back in focus, increasing volatility across cryptocurrencies, precious metals, and equities.
Bitcoin (BTC) and Ethereum (ETH) remain key assets to watch as traders reassess market direction, while gold (XAU) and silver
post-image
#StrategyRepurchases369MSTRC Strategy’s $192.4 Million STRC Buyback: Reducing Dividend Obligations While Bitcoin Accumulation Slows
Strategy Inc. executed one of its most notable capital-management moves of the year between October 5 and October 11, 2026. The company repurchased 1,932,145 shares of its Variable Rate Series A Perpetual Stretch Preferred Stock (STRC) for an aggregate $192.4 million. In the same week it acquired only 250 bitcoin for $21.5 million. The preferred-share buyback was nearly nine times larger in dollar terms than the Bitcoin purchase.
This contrast defines the current
post-image
STRC-0.10%
BTC-3.42%
MSTR-5.89%
  • 2
It looks like this is going to reach 70000万. I still have 1,500 U, so I’ll buy some on the dip then.
post-image
#DrLinHanSpeaksAtOxfordUnion Dr. Lin Han Speaks at Oxford Union: A Proud Moment for Gate
The invitation of Dr. Lin Han, Founder and CEO of Gate, to speak at the prestigious Oxford Union marks an important milestone for the global cryptocurrency industry. This opportunity highlights the growing recognition of crypto leaders and the increasing importance of digital assets in the global financial landscape.
According to the Oxford Union’s official event listing, Dr. Lin Han is scheduled to speak on November 12, 2026, at 3:30 PM at the Oxford Union in Oxford, United Kingdom. The event offers an op
post-image
  • 1
US September Cpi tops estimates
live-cover
LIVE1,907
Bitcoin mining company BitFuFu released its September 2026 operational data, holding 1,388 BTC at month-end. Its total Bitcoin production for the month was 167 BTC, including 98 BTC from self-mining, up from 88 BTC in August; cloud mining produced 69 BTC, with average daily production remaining around 5.6 BTC.
post-image
BTC-3.42%
If rate hikes are paused in October, can BTC and U.S. stocks rebound?
Don’t rush to treat a pause as bullish! The market has already priced it in. The real variable is whether the Federal Reserve will continue tightening after the pause.
If core CPI and services inflation continue to fall, risk assets may have a chance to see their valuations recover. If inflation remains sticky, the pause may only be a lull before the storm.
What you should really watch is whether rate expectations can decline, Treasury yields can fall, and liquidity can genuinely improve.
The turning point for BTC and U.S. s
post-image
BTC-3.42%
  • 5
  • 1
Just do it—the wick is only clearing the runway for takeoff. #BTC
After CPI came in above expectations, expectations for Fed rate hikes are basically unchanged. Inflation has been suppressed by oil for half a year; it’s good that it finally shot up.
U.S. Treasury yields plunged, and the dollar index fell sharply. Suppressed gold and silver rebounded. Risk assets have now entered their “sage time”; they should rebound before long as the pressure can’t last. Bitcoin’s dip here is just shaking out the weak hands. Sit tight and hold on.
post-image
BTC-3.42%
USIDX-0.57%
GLDX-0.20%
PAXG-0.38%
XAG-5.39%
  • 1
Does a high Sharpe ratio mean a strategy is safe?
The Sharpe ratio measures the efficiency of excess returns relative to volatility, not the maximum loss.
The OWL V2 demo portfolio page displays “1-year Sharpe” alongside “maximum drawdown.” Check the period, calculation methodology, and whether fees have been deducted before reading them together. Don’t just look at the score.
post-image
OWL-8.42%
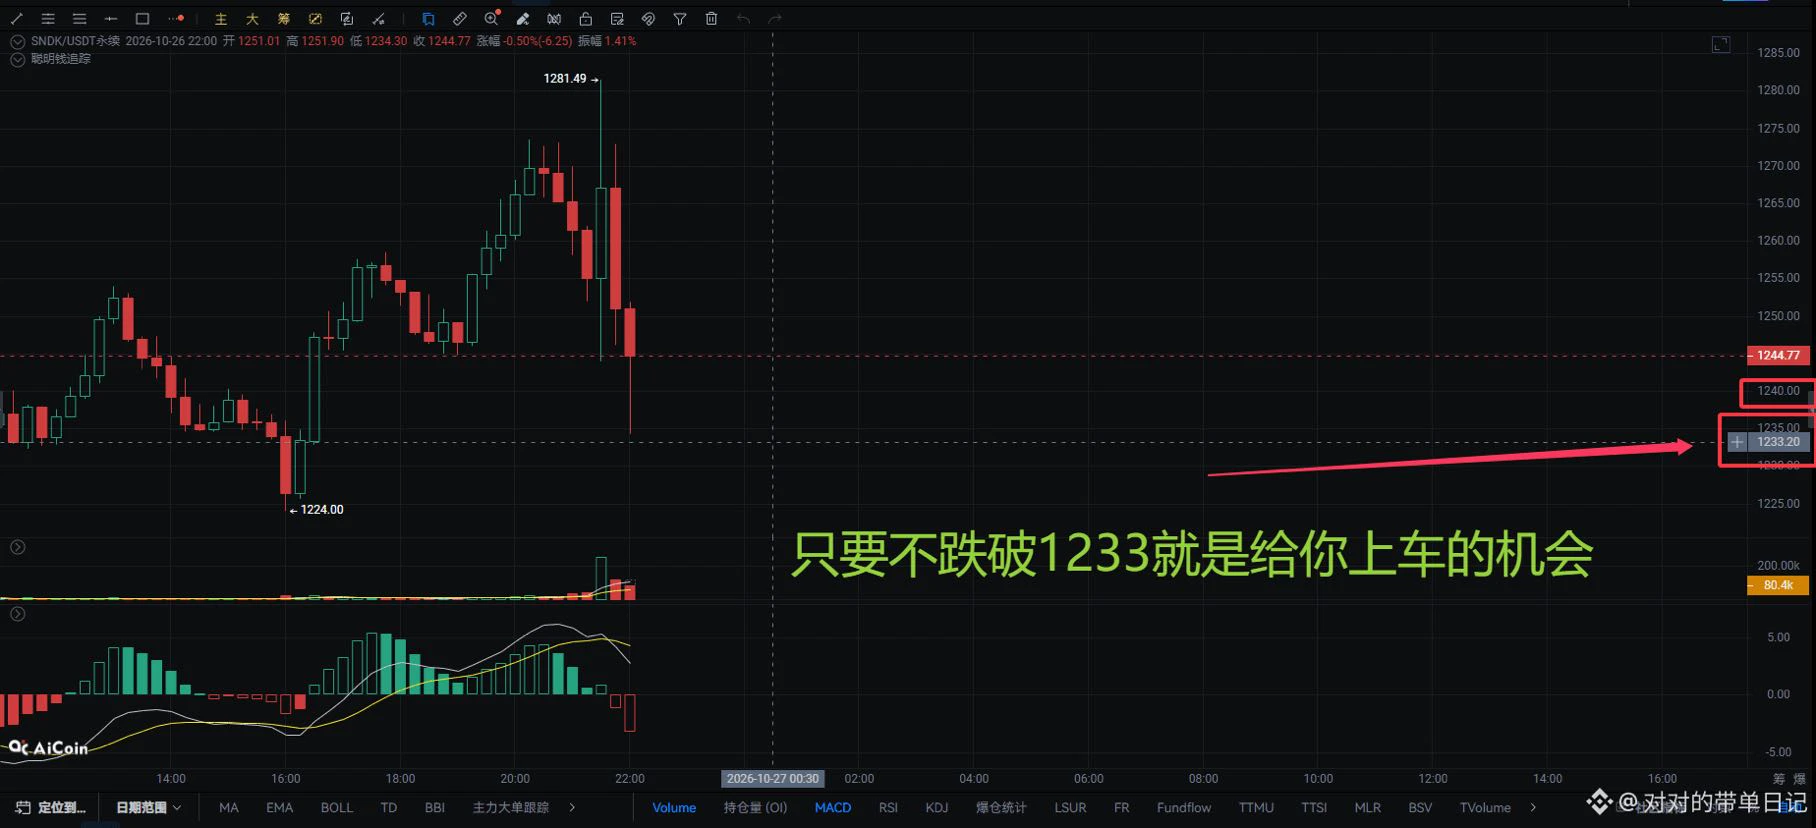
🚨 𝗦𝗡𝗗𝗞 𝗠𝗔𝗥𝗞𝗘𝗧 𝗨𝗣𝗗𝗔𝗧𝗘
SanDisk Corporation ($SNDK ) closed down 5.33% at $1,403.34, dropping $78.99 during the session. After-hours trading showed continued weakness, with shares hovering around $1,356–$1,365.
📊 𝗞𝗘𝗬 𝗦𝗧𝗔𝗧𝗦
• Day Range: $1,402.02–$1,461.80
• 52-Week Range: $130.50–$2,354.39
• Market Cap: ~$202.8B
• P/E (TTM): 19.04
• EPS: $73.70
📉 𝗠𝗔𝗥𝗞𝗘𝗧 𝗢𝗨𝗧𝗟𝗢𝗢𝗞
SNDK faced significant selling pressure during the session, while after-hours weakness indicated continued downward momentum. Traders are monitoring price stabilization and potential support levels f
post-image
SNDK-8.39%
  • 4
  • 1
Shortly after the outlook was posted, the market began a sharp decline, breaking straight through the preset target, with the downside move even larger than expected.

The provided 81800-82100 short-entry range was reached at 81886.7, after which the price continued falling, hitting a low of 80188.9. The bears fully capitalized on this move.

The trend is right in front of us, and the market can only follow the forecast. $BTC #美国9月CPI超预期
BTC-3.47%
A $352 million long position is carrying an unrealized loss of $18.87 million, and the ETH whale is nearing its liquidation line.
According to monitoring by on-chain analyst Ember, a whale or institution holds a long position of 79,260 ETH, worth approximately $187 million, with a liquidation price of around $2,290 to $2,301. It also holds a long position of 1,140 BTC, worth approximately $92.6 million.
What is truly worth watching is not the unrealized loss itself, but whether a continued decline in ETH will trigger forced liquidation and further amplify selling pressure in the market.
Howeve
post-image
ETH-6.23%
BTC-3.47%
$eth
Getyour self ready for the below level if we close below $2356 in weekly
post-image
ETH-6.15%
Load More

Join 40 M users in our growing community

⚡️ Join 40 M users in the crypto craze discussion

💬 Engage with your favorite top creators

👍 See what interests you

Trending Topics

USSeptemberCPITopsEstimates

36.49k Views2.61k Discussing

US September CPI rose 3.7% YoY, above the 3.6% estimate; core CPI rose 2.6%, also above the 2.5% estimate. With inflation topping forecasts across the board, how will rate hike expectations shift? How will BTC react? Share your view.

DrLinHanSpeaksAtOxfordUnion

135.31k Views1.85k Discussing

WillYouBuyDipInKoreanStocks

47.05k Views1.72k Discussing

View More