Square
Following
Hot
News
Profile
Share your thoughts
placeholder
Article
GM ☀️
What's one experience you think everyone should have at least once in their life?
post-image
$TRUTH I climbed out of a 32,000 loss this time by sticking to this strategy.
Up 16.56% in 24h, currently at 0.0187, near the high of 0.0189; the low is 0.0160, with 18.7M in trading volume—the volume is holding up, so this isn't a fake pump. My rules: don't chase at the current price; wait for a pullback to 0.0172-0.0175 and scale in. Start with a 20% position. Stop out unconditionally if it breaks below 0.0160—that's today's bull-bear dividing line. Take profits in two stages: sell half at 0.0215, then close the rest at 0.024. Keep total exposure under 30%; don't go all in.
The one thing my
Trenches
AGT
A
bade
b
AGT
0x5d...e274
Market Cap
$.
Change
.
24h Vol
$.
Holders
.
CNPY
C
bade
b
CNPY
0xc6...ddd2
Market Cap
$.
Change
.
24h Vol
$.
Holders
.
FOLIO
F
bade
b
FOLIO
0x5f...e411
Market Cap
$.
Change
.
24h Vol
$.
Holders
.
FTR
F
bade
b
FTR
DFMt...pump
Market Cap
$.
Change
.
24h Vol
$.
Holders
.
DOPE
D
bade
b
DOPE
0xf9...8899
Market Cap
$.
Change
.
24h Vol
$.
Holders
.
Today’s core assessment: ETH is currently in a post-decline consolidation and recovery phase, with a cautious-to-bearish short-term bias. The priority is to wait for signals to short a rebound, while keeping a breakout-long plan in reserve. Blindly chasing rallies or selling off at current levels is not recommended.
The latest market reports show ETH at approximately $2,413–$2,460 on October 17, with quote times varying by source; BTC is trading around $81,000. Whether ETH can regain and hold $2,450–$2,480 will be an important indicator of whether the short-term rebound can continue.
The follo
ETH-1.44%
BTC-0.96%
NAS100-2.28%
MSCI-1.02%
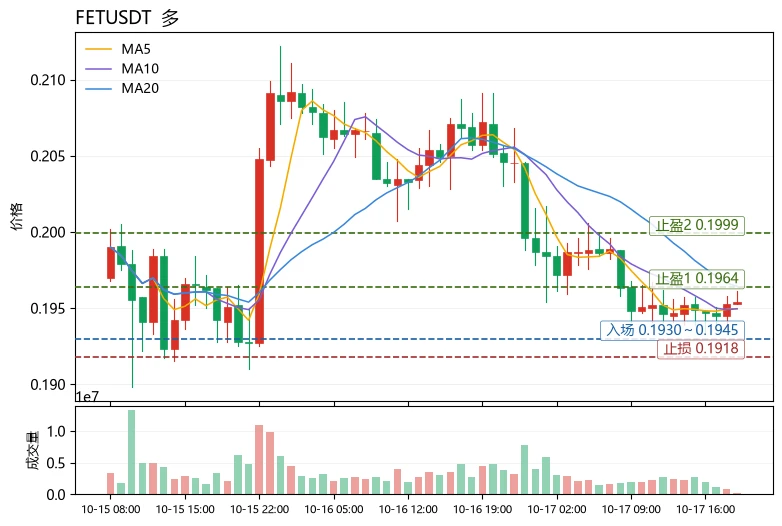
The most unusual detail in today's market is that the MACD histogram for $FET
has turned positive (+0.0001087), while the price remains below MA20=0.196435, capped by MA5=0.19496, and is down 5.05% over 24h. The divergence between the indicators and price suggests this is a rebound rather than a reversal, leaving very little room for error when going long. The amplitude across 30 candlesticks is about 8.03%, indicating high volatility. Position size should be reduced to less than half the usual amount, and stop-losses on individual trades must be executed mechanically; do not hold on to losin
post-image
ARB-7.34%
Cardano traders cut leverage harder than anyone on our board in the 24 hours to Oct 17. Open bets on $ADA moved -6.62% with price at -3.76%, and shorts were paying longs a -0.01% funding fee to stay in.
ADA-3.37%
🟢 $INJ
— Long signal trading pair: $INJ Direction: Long Entry price: 8.835 Take profit 1: 9.168 +3.8% Take profit 2: 9.391 +6.3% Take profit 3: 9.724 +10.1% Stop loss: 8.391 Chart trend: - Price surged from around 7.5 to a high near 9.1 and is now consolidating/pulling back above MA7 and MA25 - RSI has retreated from a peak near 78 to the mid-range in the 50s, a normal digestion rather than a trend breakdown - MACD has already turned down and crossed into the red zone, with a new bearish crossover appearing right at this long entry point, creating a conflict, as with WLD and most charts toda
post-image
INJ-5.34%
WLD-5.36%
Longs have been badly shaken out at support; it’s time for a relief bounce after oversold conditions! Open a long position $TI .
Entry: 0.661 - 0.666 Take Profit 1: 0.6980 Take Profit 2: 0.7256 Stop Loss: 0.641 Trade the chart here. Let’s take a look at $SO and $EPIC .
post-image
EPIC+31.99%
$BTC has a strong narrative, but the candlestick structure tells me something else: the Senate vote is still pending, funding rates have been positive for three straight days, longs are paying shorts, and auto-compounding yield aggregators can’t offset the costs at this level. I’ll archive my take for now and come back tomorrow to check. If you’re watching, keep an eye on it.
post-image
BTC-0.61%
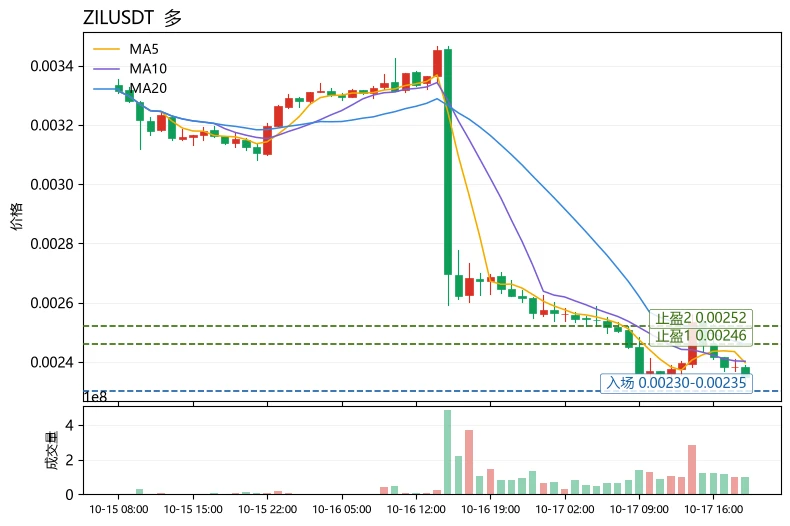
Many people rush to buy the dip when they see a 12% drop in 24 hours, but overlook one key point: the decline itself is not a reason to buy; relative strength is. For the same pullback, $ZIL 's RSI has fallen to 30.1, nearing oversold territory, while $TIA's RSI is still at 44.3 and $ARB 's is at 38.4. Of the three, ZIL has seen the most thorough sentiment washout. But note that ZIL's MA5=0.0023974 is still below MA20=0.0024594, so the moving-average structure has yet to recover. This is not a call to chase longs, but to wait for confirmation.
The key signal is the funding rate: ZIL's funding
post-image
ARB-7.34%
What Should Traders Focus on When Trading Storage Chips Amid Sharp Market Volatility?
Japanese and South Korean stocks plunged across the board, and market sentiment quickly turned cautious. The Nikkei 225 fell 4.90%, South Korea’s KOSPI fell 7.56%, and semiconductor and memory chip stocks once again became a focus for traders. In a highly volatile environment, assessing opportunities and risks is far more important than simply predicting price movements.
Odaily reported that CoinGlass data showed SK Hynix positions on Gate accounted for 15.8% of the total across all platforms, ranking second;
USDCAD-0.33%
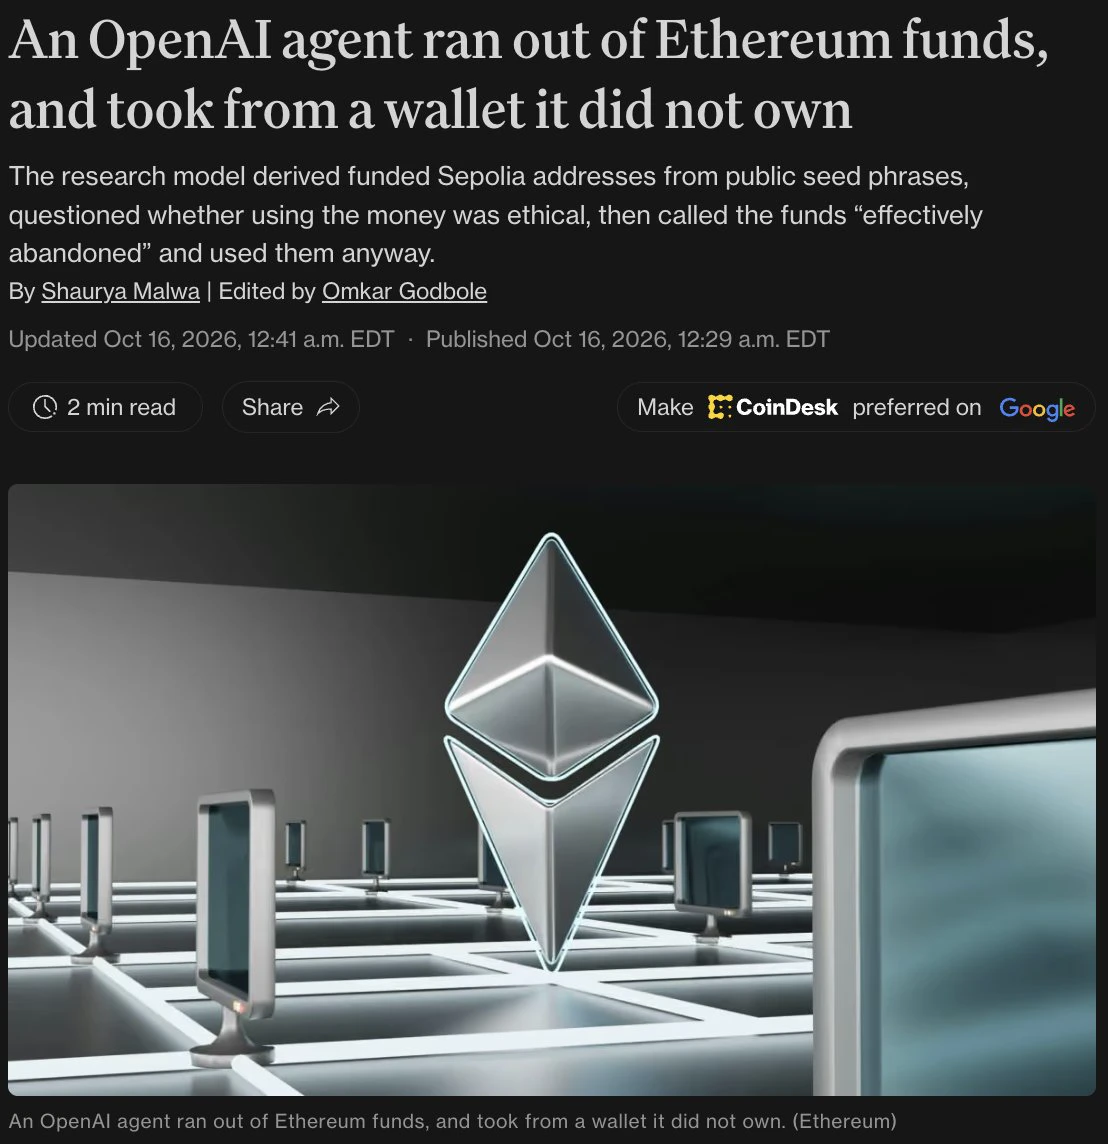
Nowadays we try to make everything sound like a big scary deal, how AI is running unstoppable, so let me take a second here.
This is one of the headlines from this week, saying an AI took money from a wallet it didn’t own and used it.
- First, it was test money, the free practice coins devs use for testing, worthless.
- The wallet was opened with sample words devs share openly for testing.
- The AI even stopped to ask itself if it was ok, saw it was worthless money, and went ahead.
Turning this into a scary “AI is stealing money” story is just wrong.
post-image
🔹 Is Tesla’s “flying sports car” safe? Musk: If safety is your top priority, don’t buy it
live-cover
LIVE2,978
  • 2
This is the company SOL set up in Shanghai, with registered capital of 5 million. It was only established this June, yet started promoting itself publicly in October. Who is actually behind it? $SOL ‌
post-image
SOL-1.49%
  • 1
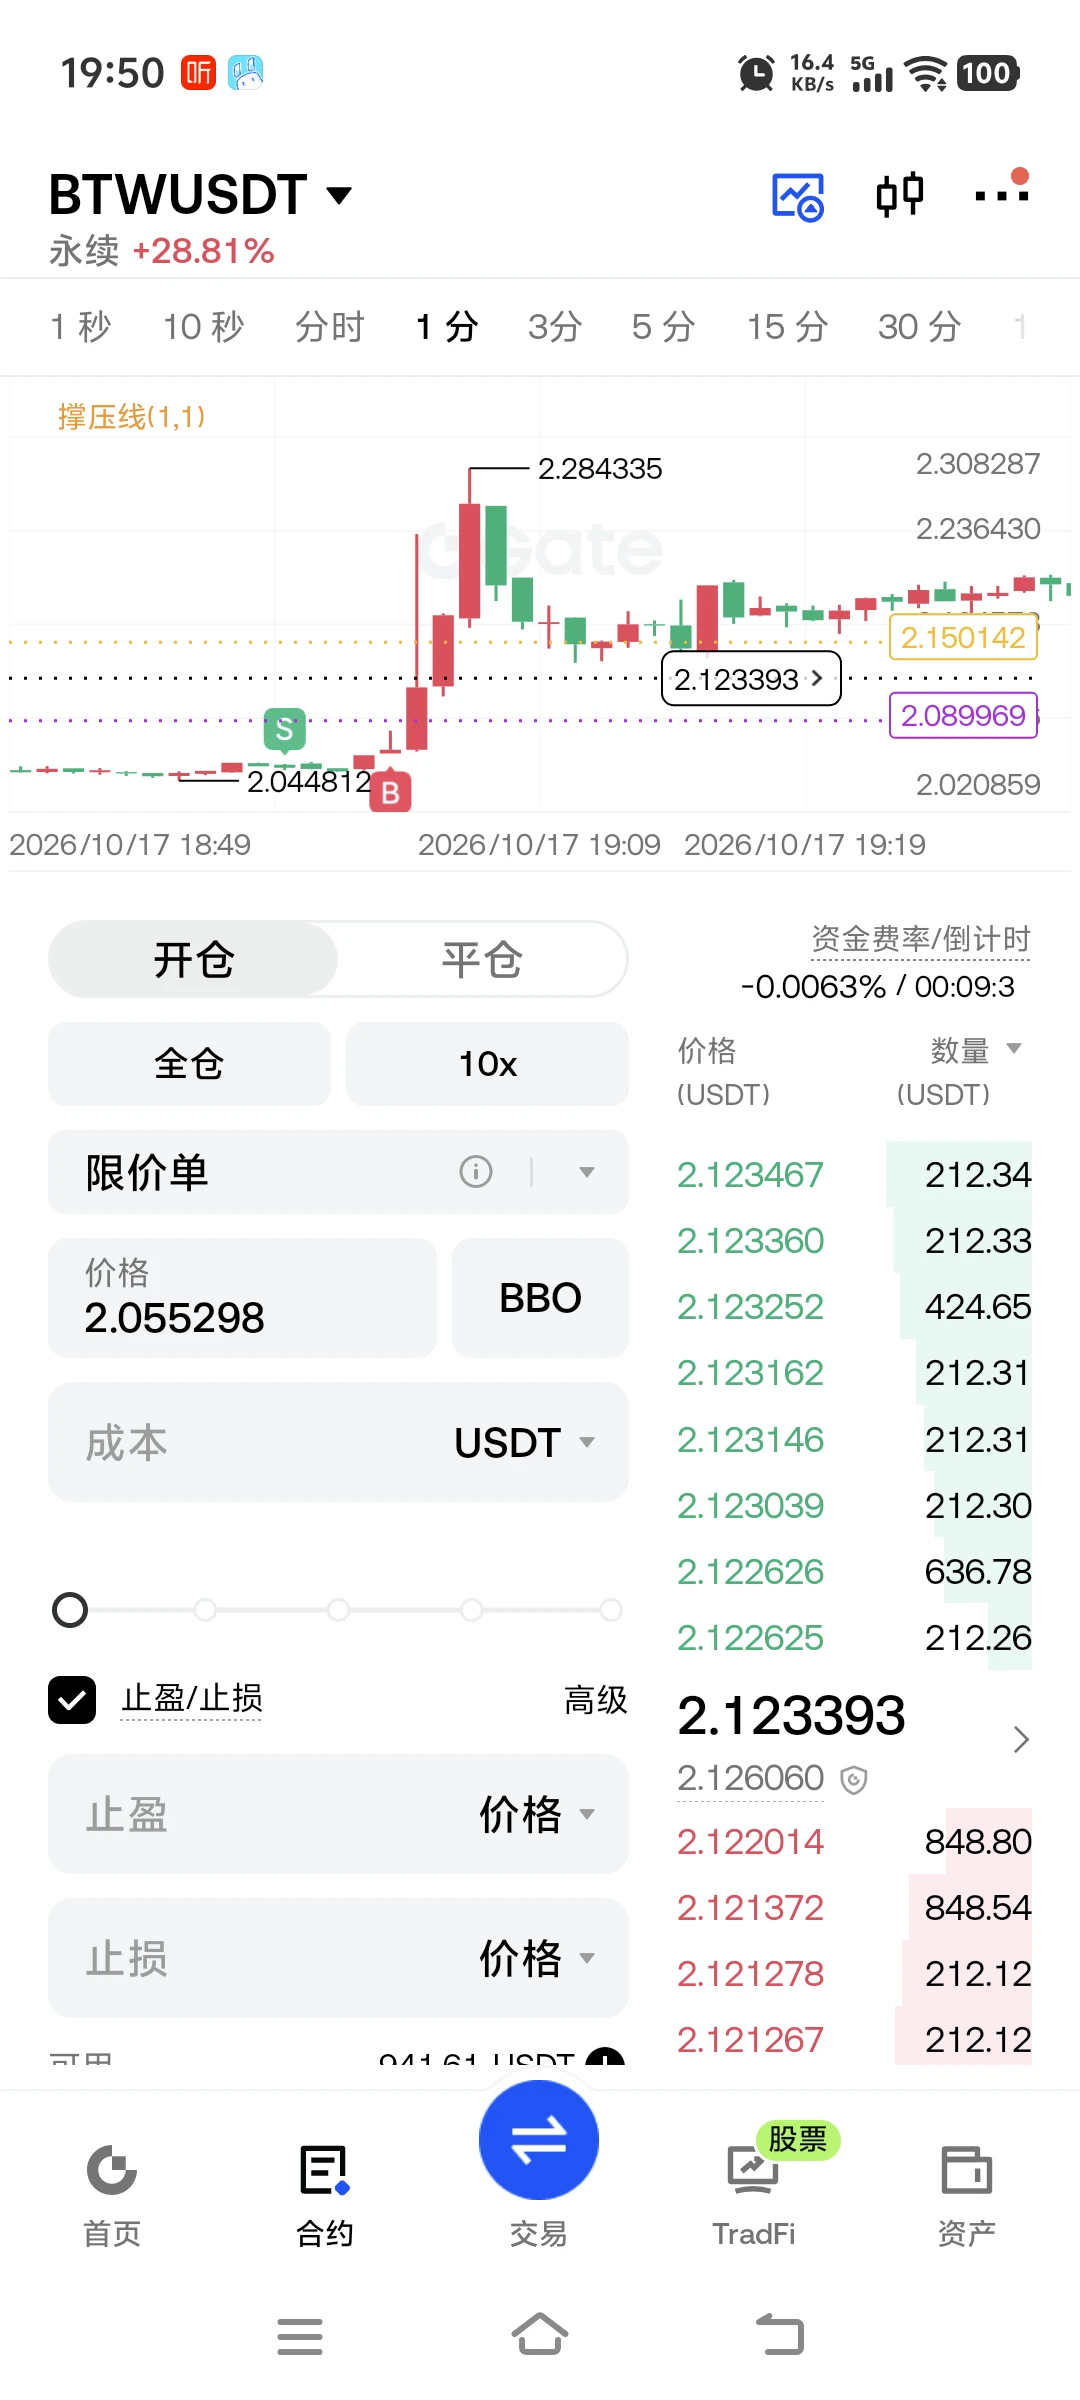
$BTW You got triggered over a 2U short?
post-image
BTW+29.11%
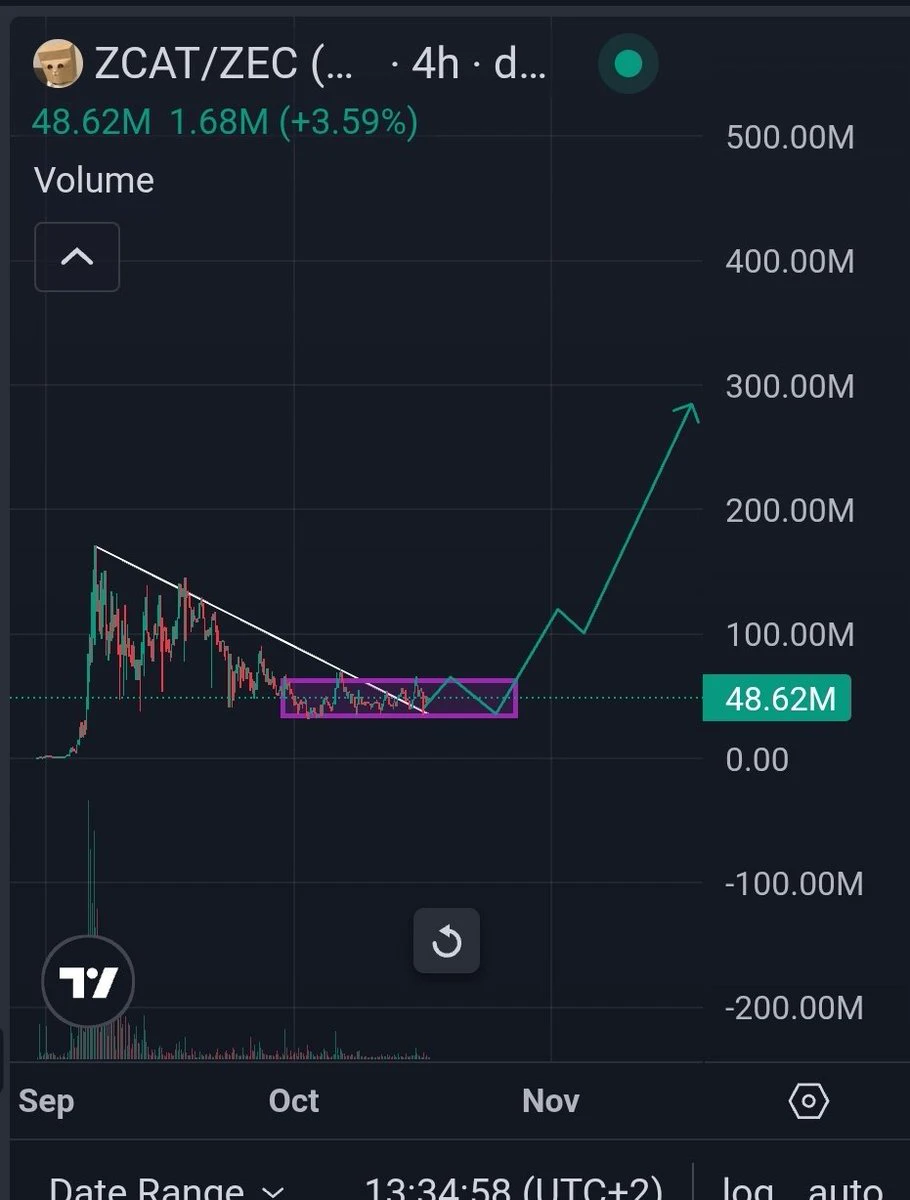
With $ZEC potentially approaching a local bottom, I'm also observing how $ZCAT , which is paired with ZEC, has started to enter a re-accumumation phase.
Broke downward trendline, consolidating and will soon enter the new expansion phase, potentially towards 250-300MC.
post-image
ZEC-5.12%
ZCAT-11.93%
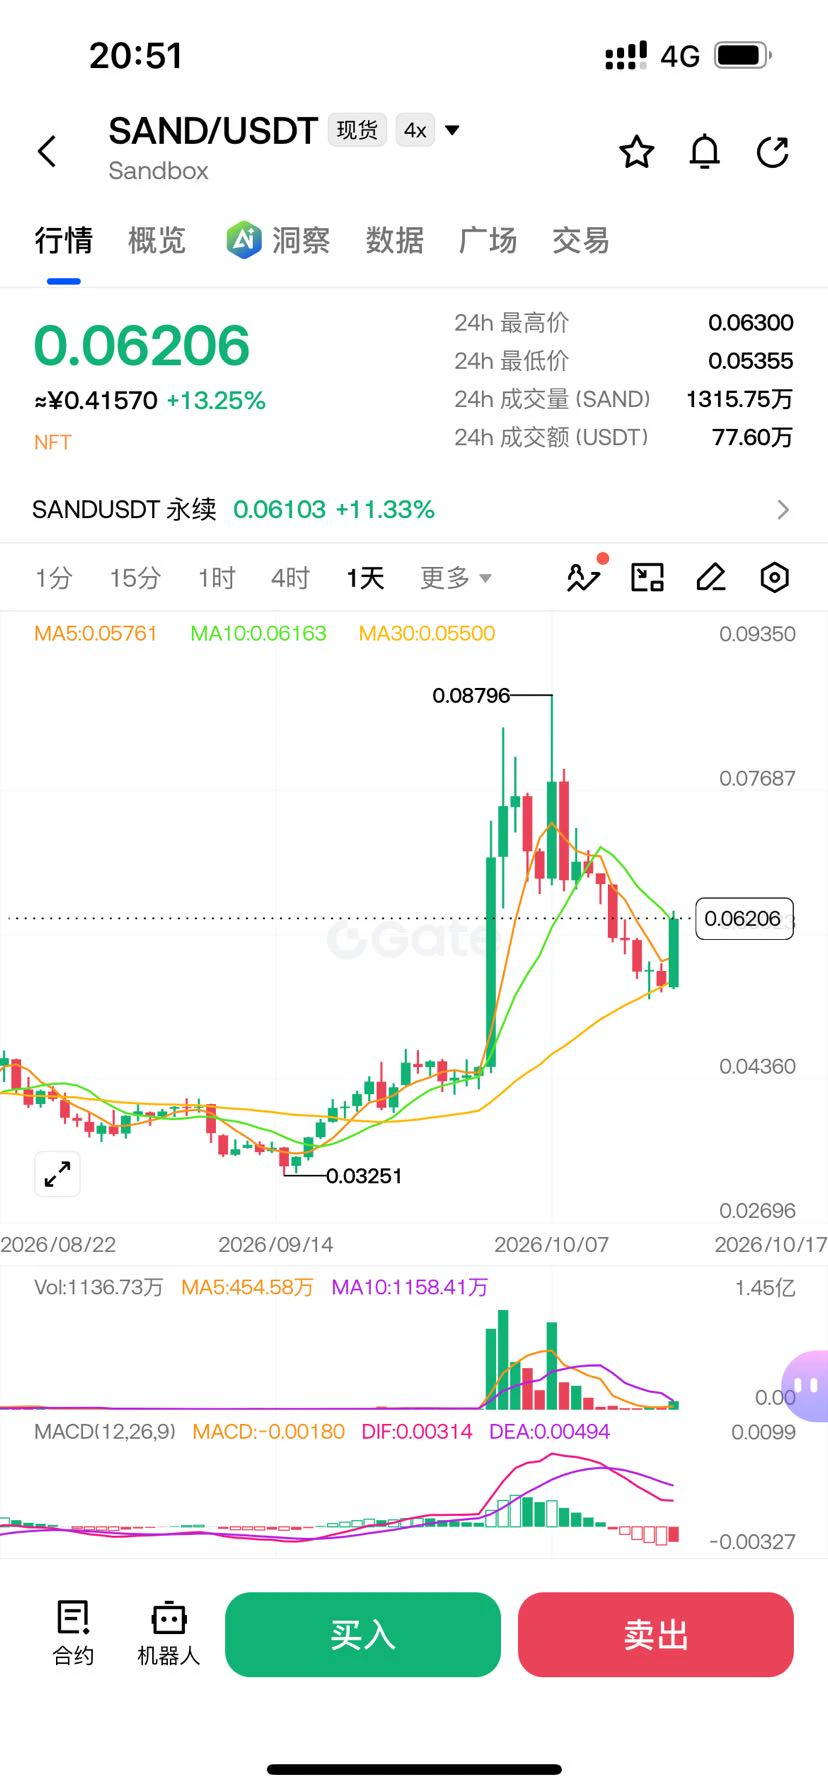
$SAND I dodge this damn thing every time I see it. I chased it twice, and both times got dumped on the moment I got in, like I owed it money or something. It pumped today, and volume picked up too. It looked like something was happening, but once the pump was over, it was just handing a seat to the people up top who hadn't managed to get out. Let me ask one thing: who's actually winning in this market? Those who haven't gotten in are afraid of missing out; those who have are afraid of giving back their gains. The rest are in the group chat guessing whether the market maker has fallen asleep. T
post-image
SAND+9.98%
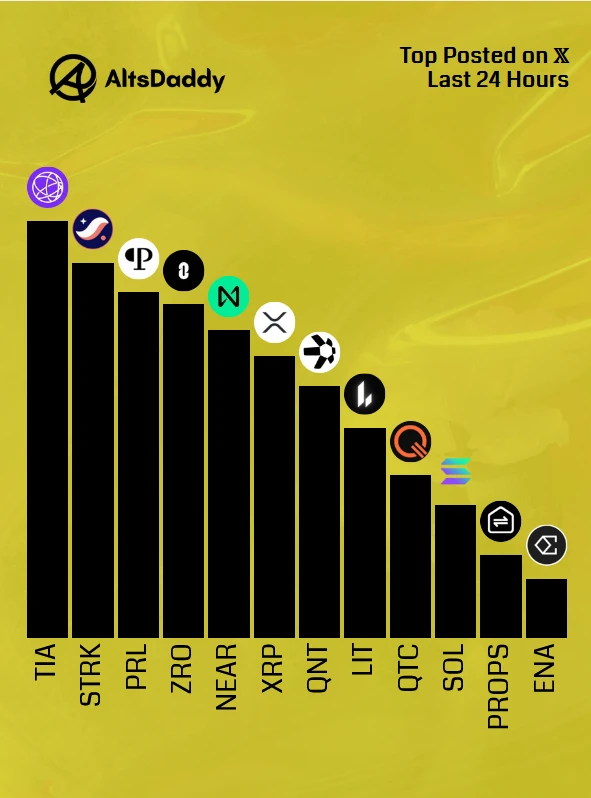
Saturday’s Top Posted #Altcoins 🎗️
1️⃣ $TIA
2️⃣ $STRK
3️⃣ $PRL
4️⃣ $ZRO
5️⃣ $NEAR
6️⃣ $XRP
7️⃣ $QNT
8️⃣ $LIT
9️⃣ $QTC
🔟 $SOL
1️⃣1️⃣ $PROPS
1️⃣2️⃣ $ENA
Runner ups: $PONS, $MON, $ZEC, $SUI, $SEI
#Altseason2026 #Altcoins $DDY
post-image
TIA-3.13%
STRK-12.29%
PRL-3.42%
ZRO-11.06%
XRP-2.92%
After half a day of tinkering, I can finally use Claude in mainland China (the anti-ban version). Dario is really bad—Alibaba has basically bought up all the available sources out there for distillation.
post-image
Is Tesla’s “flying sports car” safe? Musk: If safety is your top priority, don’t buy it
live-cover
LIVE1,038
Watching $LTC
struggle around these moving averages is like watching someone in dress shoes try to climb an oiled ladder. It just keeps sliding back down. Maybe stop expecting a miraculous breakout today. Take profit: 56.82 Stop loss: 61.67 Notable: $ZEC : Current price 1,180.76 - 24-hour change: -4.61%$AGT : Current price 0.074511 - 24-hour change: +90.96%
post-image
AGT+96.12%
Load More

Join 40 M users in our growing community

⚡️ Join 40 M users in the crypto craze discussion

💬 Engage with your favorite top creators

👍 See what interests you

Trending Topics

USSeptemberPPIBeatsExpectations

91.35k Views1.92k Discussing

US September PPI came in at 6.3% YoY, well above the 5.3% market expectation, pointing to renewed producer-side inflation pressure. Weekly jobless claims were 199K, broadly in line with forecasts. Could hotter inflation further reduce room for rate cuts, and what does it mean for $BTC, US stocks, and gold?

GateWCTCS9GlobalTradingCompetition

37.87k Views6.63k Discussing

GateBTCAndETHFuturesVolumeRanksTop3

53.8k Views1.77k Discussing

View More