
Share your thoughts
placeholder
Article
[$Bull Comes Signal] Long + bid-side depth imbalance, targeting the 1H pullback
$Bull Comes order-book bid ratio is 4.89, with a 66% depth imbalance and dense orders at 0.1168-0.1172. The 1H MACD histogram is contracting, and the price is at the BOLL middle band. The 4H moving averages are diverging upward, with a stable long-term trend center. The 1H active sell ratio is 0.39, indicating short-term washout pressure.
The profit-loss ratio is 1.5, with a stop-loss distance of only 0.8%. The risk-reward ratio is not particularly attractive, but the tight stop itself is an advantage. Catching the
post-image
牛来+43.22%
BTC+0.31%
If free time also has to be filled, that is merely another way of constraining yourself.
post-image
2026.9.6 Weekend Summary and Review: Growth Is an Inevitable Journey
This week, I made a total of 5 trades, all profitable: long SNDK at 1515 on Monday, long XAU at 4363 and BTC at 76700 on Tuesday, and long Little Nose tree at 0.418 on Wednesday night. It is either profit or loss; the stop-loss has not been triggered, and it is currently in a take-profit state. If you do not want to hold it, simply take profit; on Thursday night, I went long HYPE at 83.68, reduced the position on Friday, and exited with the remaining position at breakeven with a small profit at 84.
The WIF position left over
post-image
SNDK+11.88%
XAU+0.08%
BTC+0.31%
TREE+2.81%
HYPE+1.10%
$FLOCK Signal】Long - 1H volume contraction, high-level support
$FLOCK 1H volume fell sharply from 578 million to 87 million, while the price remains range-bound near 0.063 at a high level. Order book depth imbalance is -7.83%, with selling pressure slightly prevailing, but bids have appeared repeatedly around 0.0624.
🎯 Direction: Long
⚡ Entry/Limit Order: 0.06284 - 0.06303
🛑 Stop Loss: 0.06240
🚀 Target 1: 0.06398
🚀 Target 2: 0.06445
🛡️Trade Management: - Execution strategy: After reaching Target 1, reduce the position by 50% and move the stop loss up to the breakeven level. If the pric
post-image
FLOCK+26.65%
BTC+0.31%
ETH+1.41%
SOL+1.39%
Morning market
live-cover
LIVE1,891
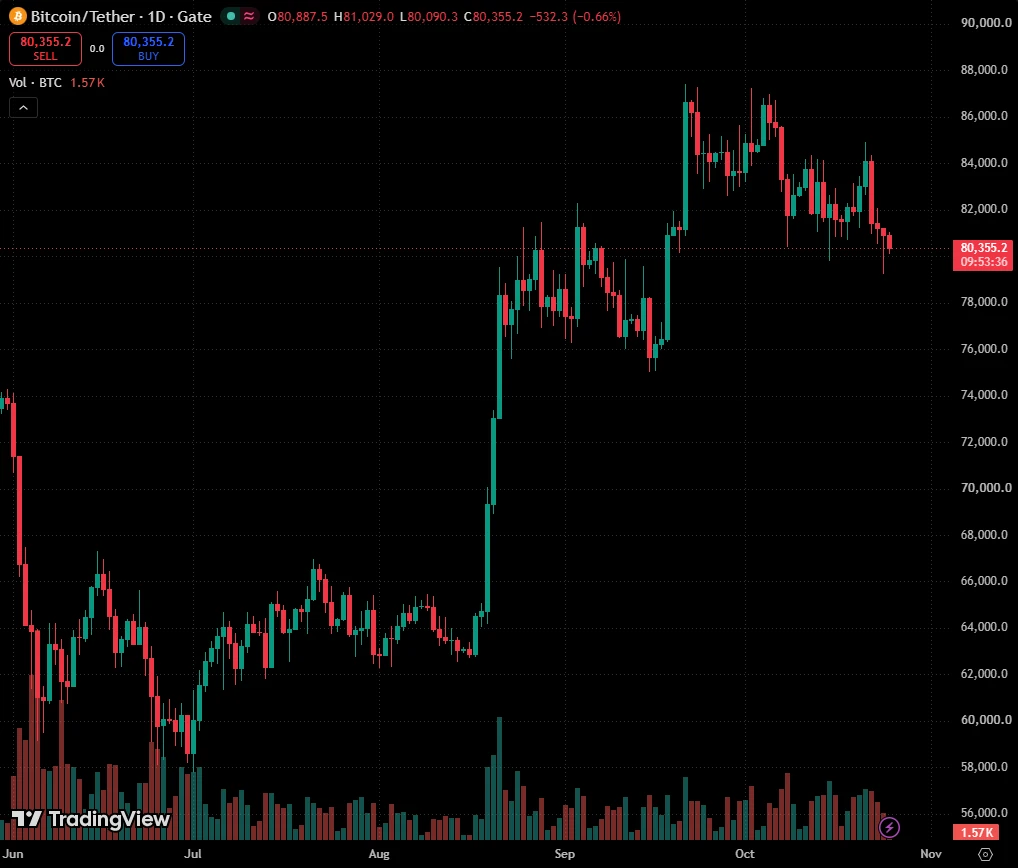
Everyone’s watching the range, but the real money is hiding in the 4h squeeze—$BTC /USDT is about to pick a side.

$BTC /USDT - SHORT

Trade Plan:
Entry: 79699.84 – 79817.26
SL: 80322.21
TP1: 79335.80
TP2: 79053.97
TP3: 78631.22

Why this setup?
Why short now? The 4h structure is armed with a 55% confidence SHORT, not a breakout.
- Price is pinned at 79,758, but the 1D trend is just a range—no bullish conviction.
- RSI on the 15m (47.61) is weak, not oversold, leaving room to drop.
- ATR (234) is tight—volatility is coiling, and TP1 at 79,335 is the first magnet.
This isn’t a chase;
BTC+0.34%
$NVDA NVIDIA's recent price action has been range-bound at high levels, with an overall strong trend and increased volatility, but on the weekly timeframe, it has not seen a truly one-way, straight-line rally or sharp decline.
Based on the latest price action, NVIDIA shares are trading around $230, close to the 52-week high of $236.54, indicating that the bullish trend remains intact, while resistance above is also clearly evident.
The market remains broadly optimistic about its 12-month price target, but short-term funds are more focused on whether the stock can hold the $228–$230 range and c
NVDA+0.87%
I just switched the app to the background, and it shot right back up—are you playing hide-and-seek with me?

When I checked the chart after lunch, it was still grinding along the bottom, but the K-line had already printed several long lower wicks in a row. When I opened it again in the afternoon, I happened to catch the high-volume breakout. This kind of upward move clearly isn't something retail traders can lift, so I went with the trend and opened a long at 13.489, starting with a small position to test the waters.

Now at 17.821, $SNXX the rally has been very clean, and the return on my p
post-image
SNXX+3.39%
SNDK+1.83%
LAB+1.71%
Everyone’s staring at $ETH /USDT’s 2484 level—but the real signal is a 55% short that nobody dares to fade.

$ETH /USDT - SHORT

Trade Plan:
Entry: 2482.1 – 2487.1
SL: 2508.9
TP1: 2466.3
TP2: 2454.2
TP3: 2435.9

Why this setup?
Why now?
- 4h bias is SHORT but confidence is only 55—this is a knife-edge, not a slam dunk.
- 1D trend is *range*, so we’re not chasing a breakout—we’re playing the mean reversion.
- RSI 15m at 55.69 shows a weak bounce, not a reversal—buyers are gasping.
- Entry zone 2482–2487 is tight; TP1 at 2466 is only 0.7% away—quick scalp fuel, but TP3 at 2435 is the
ETH+1.40%
Everyone’s staring at the 1D range, but the 4h clock just struck midnight for $MU /USDT.

$MU /USDT - SHORT

Trade Plan:
Entry: 1015.04 – 1016.60
SL: 1025.51
TP1: 1008.56
TP2: 1003.71
TP3: 996.45

Why this setup?
- RSI on the 15m is already at 45.18—that’s not oversold, that’s a bull trap losing its breath.
- With ATR at 3.10 on the 1h, the move down from 1015.82 to TP1 (1008.56) is just 2.3x the average hourly range—easy prey.
- The “Armed” status means the trigger is live; we don’t need a trend flip, just a range rejection.
- Why now? Because the 1D is sideways, and sideways always
MU+0.55%
Everyone’s chasing SUI longs while the 4h silently flips bearish—are you on the wrong side?

SUI/USDT - SHORT

Trade Plan:
Entry: 0.7921 – 0.7967
SL: 0.8169
TP1: 0.7776
TP2: 0.7663
TP3: 0.7495

Why this setup?
Why now? The daily is *range*, but our 4h map says SHORT with 55% conviction. RSI on the 15m (40.96) is already weak, and ATR (0.0093) shows volatility is compressing—perfect setup for a breakdown. Entry zone 0.7921–0.7967 is armed; first target is a clean 2% drop to 0.7776. The invalidation at 0.7701 is far, giving us room to breathe. This isn’t a scalp—it’s a positional fade.

Deba
SUI+4.37%
$GT Offloaded at $30–55
post-image
GT+11.68%
WLD's 4h chart is whispering a short—but 55% confidence means the market is laughing at certainty.

$WLD /USDT - SHORT

Trade Plan:
Entry: 0.3960 – 0.3982
SL: 0.4076
TP1: 0.3892
TP2: 0.3839
TP3: 0.3760

Why this setup?
Why now? The 1D trend is *range*, not breakout—so mean-reversion rules. RSI on 15m sits at 51.01, dead neutral, giving price room to drop without overbought friction. Entry ref at 0.3971, with TP1 at 0.3892 (a clean 2% sweep) and TP2 at 0.3839—that's where the range's lower lip likely bites. ATR on 1h (0.004387) is tight, so the move should be slow, not violent—perfect for a
WLD+3.17%
BREAKING: Seven long-dormant miner addresses (16.5 years) moved 350 BTC (~$28m) after years idle. If this signals renewed on-chain activity, it could spark fresh attention on long-term supply dynamics. $BTC
post-image
BTC+0.31%
Four signals 🔥 to understand current crypto market changes!
A roundup of four industry trends worth watching closely recently 👇
✅ Morgan Stanley continues increasing its BTC holdings
It has accumulated a total of 355 BTC over the past 4 days, while spot BTC-ETF net inflows continue. The single-day increase is not explosive, but the consistency is what matters. Traditional institutions are steadily entering the market in batches. Short-term inflows do not yet mean the trend has completely reversed.
✅ Fierce competition for USDH issuance rights
Several major players, including Paxos, Frax, and
post-image
BTC+0.34%
HYPE+1.07%
SNDK+11.88%
This rebound in $LIT has honestly been stronger than I expected. After the earlier wick swept out the stop-losses on several of my long positions, the price pulled back up and firmly reclaimed the key level. But compared with predictions, I care more about how to respond. With unrealized profit reaching +1175.49%, I took profit and exited 70% of the position first, and moved the protection level on the remaining 20% above the entry price. The reason is simple: the higher it goes, the more we need to watch out for false breakouts and profit-taking.

The price is now around 4.752. As for wheth
post-image
LIT-2.38%
ADA+4.03%
ZEC+0.82%
I originally just wanted to mooch a breakfast, but the market ended up making dumplings out of me for half a year. I opened the charts this morning, and before my eyes were even fully open, I saw the price bubbling up on its own. A few days ago, while watching the market in the early hours, $TAC had been moving sideways at the bottom. Everyone was waiting and watching. I stared at the order book for a while and saw funds entering slowly but steadily, with small orders constantly providing support at the bottom. In situations like this, I don't hesitate—I reached in and bought some around 0.002
post-image
TAC-4.39%
ZEC+0.82%
LAB+1.71%
$TSLA #美国8月非农超预期
Tesla needs to be wary of further one-sided, straight-line declines next week.
Tesla’s daily-chart trend was broadly strong in August before pulling back in early September: Tesla experienced a significant rebound in August, followed by clear profit-taking around the first trading day of September, with its share price retreating from late-August highs to around $350.
The market is focused on the Cybercab commercialization event in early September. Some institutions chose to reduce their risk exposure ahead of the event, leading to a rapid pullback after the rebound.
In mid-t
TSLA-5.96%
JUST IN: No fact pattern available from the provided link. Please paste the key alert or summarize the alert you want transformed.
post-image
Load More

Join 40 M users in our growing community

⚡️ Join 40 M users in the crypto craze discussion

💬 Engage with your favorite top creators

👍 See what interests you

View More