Share your thoughts
placeholder
Article
BTC ETH and Altcoins
live-cover
LIVE1,754
Wow🥳
ZEC and Ethereum are both raking in profits
Respect the candlestick chart, revere the market; making profits is as easy as breathing
ZEC+15.63%
ETH+2.16%
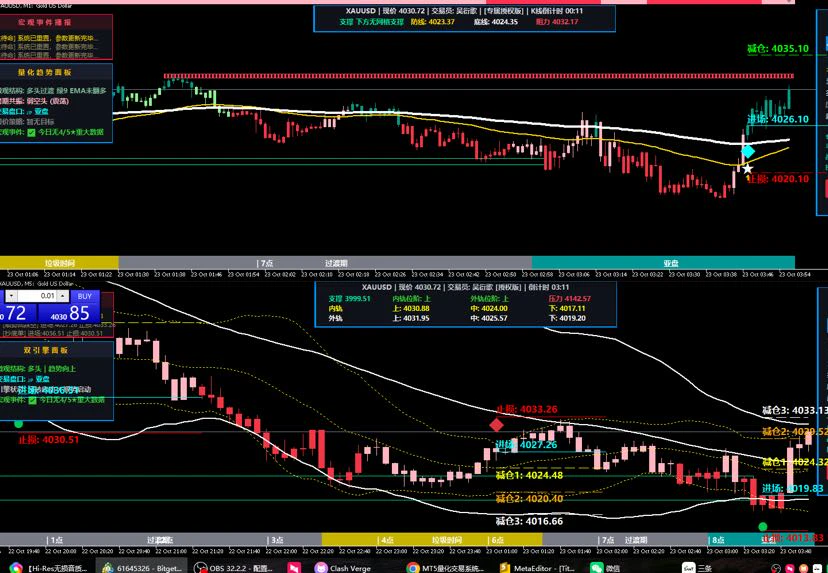

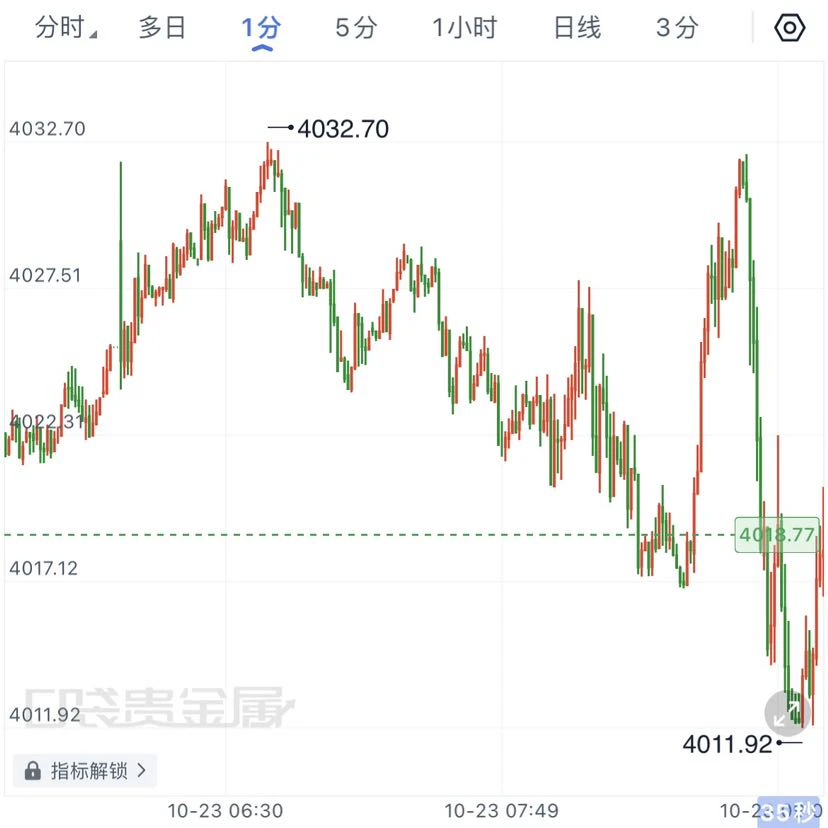
BTC Gold Crude Oil Analysis
live-cover
LIVE1,968
this is the "trenches" @vladtenev is proud of supporting, normalizing hypergambling on tokens from anon devs
If one takes credit for the green candles on the trenches, one shall also take credit for the rugs 🤷‍♂️
post-image
ANON+3.57%
#牛熊未定闲钱该放哪 At a crossroads with neither bulls nor bears in control, instead of repeatedly swinging between “staying fully in cash and waiting for the final drop” and “going all in on a rebound,” it is better to first manage the stablecoins you hold: keep some in flexible products, some in fixed-term products, and some for on-chain strategies; leave the rest to time and compounding.
If I had 10,000 USDT, I would allocate it equally among Gate’s four wealth management products and sit tight for a more reliable market😃😃😃
Ultimately, the logic behind Gate’s wealth management product design come
post-image
Crazy stuff.
My guy @Marsbull scanneed this in the gc at 23K MC
Now it just hit 9M at ATH .
That’s a 363x return.
(ⁱ ˢᵒˡᵈ ᵃᵗ 18ᴷ)
post-image
After $UNI surged to 7.686, I instead took 70% off first. It’s not that I’m bearish, but this level is right around the key prior-high resistance, making the risk-reward of chasing higher less attractive. The move up from 6.662 formed a breakout-pullback-breakout structure, with each pullback holding at a higher key level and volume expanding on the breakouts.

The key levels are clear now: the prior high is the first key level. If, after breaking through, price pulls back on lower volume and holds the upper boundary, that would establish a new entry setup; if it simply spikes higher and then
post-image
UNI+20.69%
ADA+4.68%
DOGE+1.98%
BREAKING: Ondo welcomed the SEC’s temporary exemption for onchain trading of certain tokenized US stocks, calling it a major step toward regulated tokenized markets in the US.
post-image
ONDO+11.88%
Watching the market got so annoying that turning it off actually made things clearer; once my eyes stopped staring at it, my mind stopped panicking too.

A few days ago, I checked $HUMA before bed. The pullback held, buying pressure strengthened, and it signaled that longs could be taken. From 0.02133 to 0.02458, +371.6%—felt really good.

The timing was right.

Take some profits first: secure 80%, protect the remaining 20% at the entry price, and let the profits run if it keeps surging. Have a strategy before the session, discipline during the session, and reflection after the session.

T
post-image
HUMA+4.84%
BTC+1.13%
DOGE+1.98%
The market doesn’t explain itself; it only moves. Your job is simply not to make random moves.
During the repeated intraday volatility, the $CROSS key level held and buying pressure strengthened. I signaled a long entry around 0.09064—if the level doesn’t break, hold.
Now 0.18279 has given the answer: +2006.53% in juicy profits. The grind earlier was painful, but this feels really good now.
Take profit on 80% first, and protect the remaining 20% at the entry price. If it keeps surging, let the profits run; when it’s time, lock them in.
Have a strategy before the session, discipline during it,
post-image
CROSS+28.66%
BTC+1.13%
XRP+0.44%
405% profit cooked $NEAR signal ❤️‍🔥
Our Signals Can't Disappoint you 😉
CryptoSat
$NEAR QUICK SCALPING Signal
$CROSS Signal】1H high-volume breakout, buy the pullback
$CROSS 1H high-volume bullish candle, price moved above 0.1755, piercing the 4H Bollinger upper band at 0.1581, while the 1H upper band at 0.1713 opened up simultaneously. RSI 1H 78.10, 4H 76.81; chasing the price requires management. MACD 1H/4H histograms are expanding simultaneously, with bullish momentum continuing. Order book depth imbalance -30.48%, Bid/Ask 0.53, with significant selling pressure overhead. Funding rate 0.0050%, OI stable, leverage crowding not high.
🎯Direction: Long
⚡Entry/limit orders: 0.1755418 - 0.1760700
🛑Stop
post-image
CROSS+28.66%
BTC+1.08%
ETH+2.16%
SOL+3.17%
Arc's 48 Hours: What Happened, Hour by Hour?
Arc's story actually began a year ago: the public testnet went live in October 2025 and processed more than 700 million transactions in under a year. But everything the market is talking about today happened in the last 48 hours.
September 16: Circle officially launched Arc's public mainnet, and the genesis mint of 10 billion ARC tokens was completed the same day. Circle specifically stated that this mint is only a technical milestone and does not amount to a commitment to a public offering. The chain runs under network ID 5042; gas fees are paid in
post-image
ARC-3.56%
  • 1
Does a bullish moving-average alignment equal a healthy trend? Not necessarily—the key is whether the distance between the price and moving averages is reasonable and whether momentum is moving in sync.
Take $SNDK as an example. The current price is 1599.24, with MA5=1598.15 having just crossed above and held above MA20=1560.03, forming a standard bullish structure; however, the price is almost hugging MA5, indicating that it has not deviated excessively from the moving averages in the short term, which actually makes a pullback confirmation more reliable. The MACD histogram at +5.258 remains
post-image
SNDK+5.60%
LTC+5.67%
Launchpad Economics: Is Supply Structure Setting the Price of Arc Tokens?
In the first two parts of this series we discussed Arc's opening hours and how capital flowed into the chain. Now we turn the microscope on the tokens themselves — because ARGUS, LONG and TOLLY are not the same class of asset.
First, the infrastructure: Arc's official token launch platform is Pools, and its rule set is unusually strict. Tokens issued there go directly into a pool paired with USDC, liquidity is permanently locked, and the platform takes no launch fee. Projects either launch instantly or choose a one-hour
post-image
xxx40xxx
USDC's Near-Double Premium: What Was Everyone Trying to Front-Run?
Last time we walked through Arc's 48 hours hour by hour. Now let's look at the same period through the eyes of capital.
One of the most concrete ways to measure demand for a chain's launch is the price of the stablecoin on that chain. In Arc's case an interesting signal appeared: just before the mainnet opened, USDC on Arc was reported to be trading at a premium of nearly double versus USDC on Ethereum mainnet.
What produced this premium was not the need to use the chain but the desire to take an early position. Most of the projections for Arc were based on the hundreds- and thousands-fold returns seen on Robinhood Chain. The market assumed a similar move would happen on Arc, and began moving capital before the bridge infrastructure had fully settled. A third-party platform matched over 11,660 swaps and generated more than $5 million in volume, charging a 3% service fee for it. In other words, investors were willing to pay extra just to get into the chain.
Two conclusions follow. First: Arc's first-day pricing was fed not by real user demand but by expectation transfer — the assumption that a pattern that worked on one chain automatically repeats on a new one. Second: this kind of demand pushes the price up while unbalancing liquidity. Capital enters fast, but when it wants to leave it finds no buyer on the other side.
Arc's front-running phase also explains the first-day drop: the same crowd tried to walk out of the door at once.
In the next part we will look at the supply structure of these tokens.
Note: The data is based on open-source market tracking tools; not investment advice.
$ARC
#Gate广场中秋团圆局 #Arc生态热门代币波动加剧 #ArcEcosystemHotTokensSeeIncreasedVolatility
#GateSquareMidAutumnReunion
repost-content-media
ARC-3.56%
  • 1
ARB HOLDERS, WAKE UP
$ARB has been cooking this double bottom for months
Two clean lows → strong bounce → now we’re knocking on $0.21-$0.23
If bulls flip that zone into support, I’m watching $0.40 next
From $0.21 to $0.40 is 90%
Not exactly the worst gamble
ARB+10.53%
Honestly, I’m surprised this trade has survived until now; luck played a significant part.

A few days ago, I was watching $FOLKS in the early morning. The key level held, the bottom moved sideways, and before the market had fully started, I signaled going long and said to follow after a pullback held.

It ground from 1.975 all the way to 2.133, and +387.98% finally delivered the answer. It was truly sluggish at first, but the move turned out great.

I’ve taken profit on 80% first, with the remaining 20% protected at the entry price. If it keeps surging, let the profits run.

The market is
post-image
FOLKS+4.40%
ETH+2.21%
BTC+1.13%
What are we talking about today? Gate Square’s hot topics have been updated!
🏦 The Fed’s first rate hike in three years, by 25 bps—where will the market go next?
⚡ Volatility is intensifying across the Arc / Solana ecosystem—opportunity or risk?
🚀 $ARC leads PayFi, Solana Meme hype is heating up again—where will the next wave of capital flow?
Have an opinion? Come chat 👇
Bring the hot topics, discuss the market, share your views, and share your positions and trading plans.
💰 High-quality content can receive traffic support + up to 60% in content mining rewards
👉 https://www.gate.com/post/
post-image
ARC-3.56%
SOL+3.17%
MEME+4.87%
The market doesn’t explain itself—it just moves. Your job is simply not to mess with it blindly.

Opened the chart this morning, $BR funds quietly entered, forming a bottom without breaking support, signaling that long positions could be held. From 0.21096 to 0.67624, +4345.69%—nailed it.

Time to have a good meal.

Take profit on 80% first, protect the remaining 20% at the entry price, and let the profits run if it keeps surging. Panic comes from having no plan; losses come from overthinking.

Those who didn’t get in, don’t rush. This isn’t the time to charge in—wait for the next signal
post-image
BR+4.40%
SOL+3.25%
BTC+1.13%
Violent rebound after the plunge! Holding above 4350, targeting 4400!
Yesterday, gold extended its bearish trend and moved lower, reaching the key support level at 4257. Today, the Asian session opened with a sharp oversold rebound. During the choppy climb, it successively reclaimed the 4300 and 4350 round-number levels, reaching a high around 4381 before pulling back slightly under pressure from the previous platform above. It is currently trading around 4366. Overall, the market is showing a rebound pattern of “bottoming out and recovering, followed by a sharp rally,” with the bull-bear batt
post-image
XAU+1.99%
Load More

Join 40 M users in our growing community

⚡️ Join 40 M users in the crypto craze discussion

💬 Engage with your favorite top creators

👍 See what interests you

Trending Topics

GateTopsStockPerpetualCoverage

36.15k Views1.83k Discussing

According to the latest DefiLlama report, Gate has listed 385 stock-related perpetual contracts, ranking first in coverage; average daily volume is about $1.15B and average open interest about $738M, both ranking third in the industry; liquidity depth for its five highest-volume contracts — SNDK, SKHYNIX, SPCX, SOXL, and MU — ranks first across the board. How do you view Gate leading in both coverage breadth and liquidity depth? [👉 Full Report](ttps://defillama.com/research/spotlight/deep-enough-trade-gate-case-tokens-stocks)

GateTrenchesExclusive0GasTrading

46.25k Views844 Discussing

FedHikes25bpsForFirstTimeIn3Years

32.52k Views8.35k Discussing

View More