


















$XBRUSD
Why did Brent fall below $100?
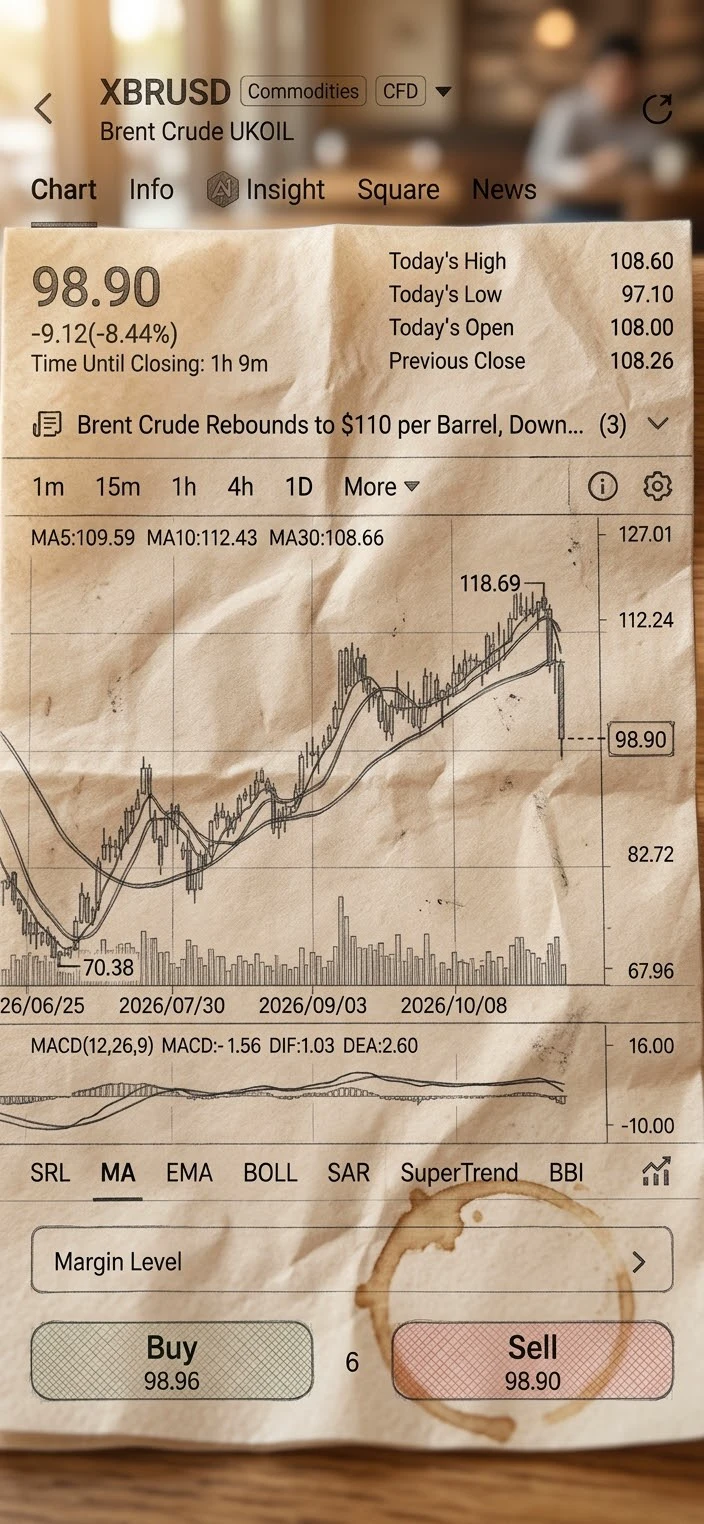
Brent fell more than 4% in January contracts, dropping to around $98.76 on November 4th. This is the first time it has fallen below $100 since early October. The three-session decline indicates a rapid repricing of the geopolitical risk premium embedded in oil prices.
This isn't just a technical level; it's a combination of structural shifts in supply expectations and post-election market reassessment.
What's returning to normal on the supply side?
The US energy statistics agency forecasts that Middle East crude oil production will increase in the coming months as transit through the Strait of Hormuz recovers and alternative routes are utilized. Previously closed capacity is expected to be brought back online.
According to an independent energy study, flow through the Strait of Hormuz is currently around 12 million barrels per day, lower than the approximately 18 million barrels per day before the conflict. So there is a recovery, but it is fragile and partial; a full return to pre-war levels is not on the table.
Why is the pipeline story important?
In September, drone attacks on the East-West pipeline, which bypasses the Strait of Hormuz, temporarily halted a critical route. The pipeline was repaired and restarted on September 22, and shipments from Yanbu port soon resumed. This was one of the steps taken to alleviate the immediate supply constraint.
Alternative routes also came into play. Increased shipments via Fujairah and Oman partially compensated for the reduced flow through the strait. The logistics landscape is not fully back to normal, but the worst is behind us.
What has changed on the demand side?
The September short-term energy outlook revised the global liquid fuel consumption forecast downwards. The expectation for 2026 was lowered to 102.59 million barrels per day, approximately 1.69 million barrels below the 2025 level, and both OECD and non-OECD demand were revised more subdued.
In short, high prices and slowing growth are suppressing consumption. This is pulling the price anchor for crude oil down. Refinery operations, product consumption, and growth data from major economies will show whether this softening is permanent.
How should we interpret this decline?
Looking at it from a long-term and dialectical perspective, two forces are working together. On the one hand, the gradual restoration of physical supply routes, and on the other hand, the downward revision of global demand expectations. The risk premium, which increased with the pipeline attacks in September, has subsided along with the overall pullback in oil prices.
But the structural picture is still nuanced. Although the Strait of Hormuz has recovered from its September lows, it remains well below pre-war levels, and the recovery is described as fragile. The geopolitical background is not resolved, and if there is another disruption on the main routes, upward pressure on prices may return.
What should you watch?
There are two questions here. Will the speed of supply normalization or the trajectory of demand revisions be more decisive?
On the supply side, the daily level of the Strait of Hormuz flow, loadings at Yanbu and alternative ports, and the turnaround rate of closed capacity. On the demand side, global growth data, refinery utilization rates, and product consumption.
Below $100 is a threshold, but it's not the sole indicator. What will be lasting is the balance between how much logistics return to normal and how much demand slows down.
This content is for informational purposes only and is not investment advice.
#GateSquareTradingChallenge #WCTCS9 #ShareWeekly #𝐎𝐈𝐋
Why did Brent fall below $100?
Brent fell more than 4% in January contracts, dropping to around $98.76 on November 4th. This is the first time it has fallen below $100 since early October. The three-session decline indicates a rapid repricing of the geopolitical risk premium embedded in oil prices.
This isn't just a technical level; it's a combination of structural shifts in supply expectations and post-election market reassessment.
What's returning to normal on the supply side?
The US energy statistics agency forecasts that Middle East crude oil production will increase in the coming months as transit through the Strait of Hormuz recovers and alternative routes are utilized. Previously closed capacity is expected to be brought back online.
According to an independent energy study, flow through the Strait of Hormuz is currently around 12 million barrels per day, lower than the approximately 18 million barrels per day before the conflict. So there is a recovery, but it is fragile and partial; a full return to pre-war levels is not on the table.
Why is the pipeline story important?
In September, drone attacks on the East-West pipeline, which bypasses the Strait of Hormuz, temporarily halted a critical route. The pipeline was repaired and restarted on September 22, and shipments from Yanbu port soon resumed. This was one of the steps taken to alleviate the immediate supply constraint.
Alternative routes also came into play. Increased shipments via Fujairah and Oman partially compensated for the reduced flow through the strait. The logistics landscape is not fully back to normal, but the worst is behind us.
What has changed on the demand side?
The September short-term energy outlook revised the global liquid fuel consumption forecast downwards. The expectation for 2026 was lowered to 102.59 million barrels per day, approximately 1.69 million barrels below the 2025 level, and both OECD and non-OECD demand were revised more subdued.
In short, high prices and slowing growth are suppressing consumption. This is pulling the price anchor for crude oil down. Refinery operations, product consumption, and growth data from major economies will show whether this softening is permanent.
How should we interpret this decline?
Looking at it from a long-term and dialectical perspective, two forces are working together. On the one hand, the gradual restoration of physical supply routes, and on the other hand, the downward revision of global demand expectations. The risk premium, which increased with the pipeline attacks in September, has subsided along with the overall pullback in oil prices.
But the structural picture is still nuanced. Although the Strait of Hormuz has recovered from its September lows, it remains well below pre-war levels, and the recovery is described as fragile. The geopolitical background is not resolved, and if there is another disruption on the main routes, upward pressure on prices may return.
What should you watch?
There are two questions here. Will the speed of supply normalization or the trajectory of demand revisions be more decisive?
On the supply side, the daily level of the Strait of Hormuz flow, loadings at Yanbu and alternative ports, and the turnaround rate of closed capacity. On the demand side, global growth data, refinery utilization rates, and product consumption.
Below $100 is a threshold, but it's not the sole indicator. What will be lasting is the balance between how much logistics return to normal and how much demand slows down.
This content is for informational purposes only and is not investment advice.
#GateSquareTradingChallenge #WCTCS9 #ShareWeekly #𝐎𝐈𝐋