$BTC $BTC $BTC $BTC $BTC 🚨 BITCOIN IS ENTERING ANOTHER TRAP?
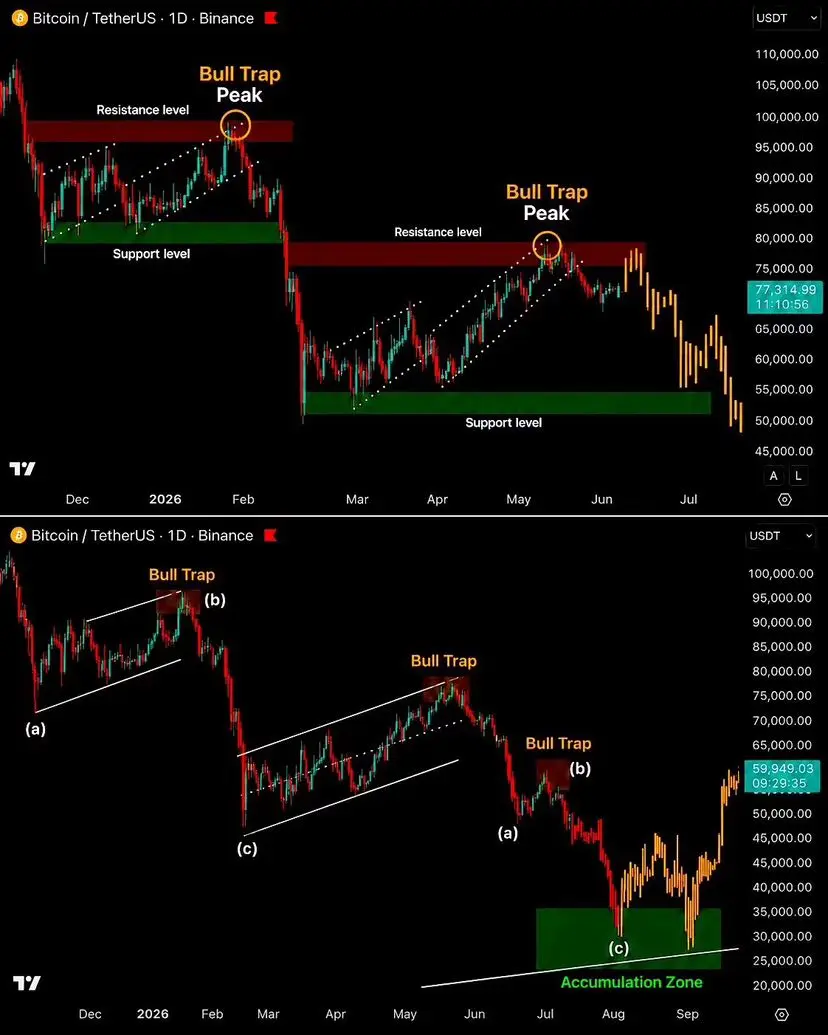
This chart highlights a pattern that some traders are closely monitoring.
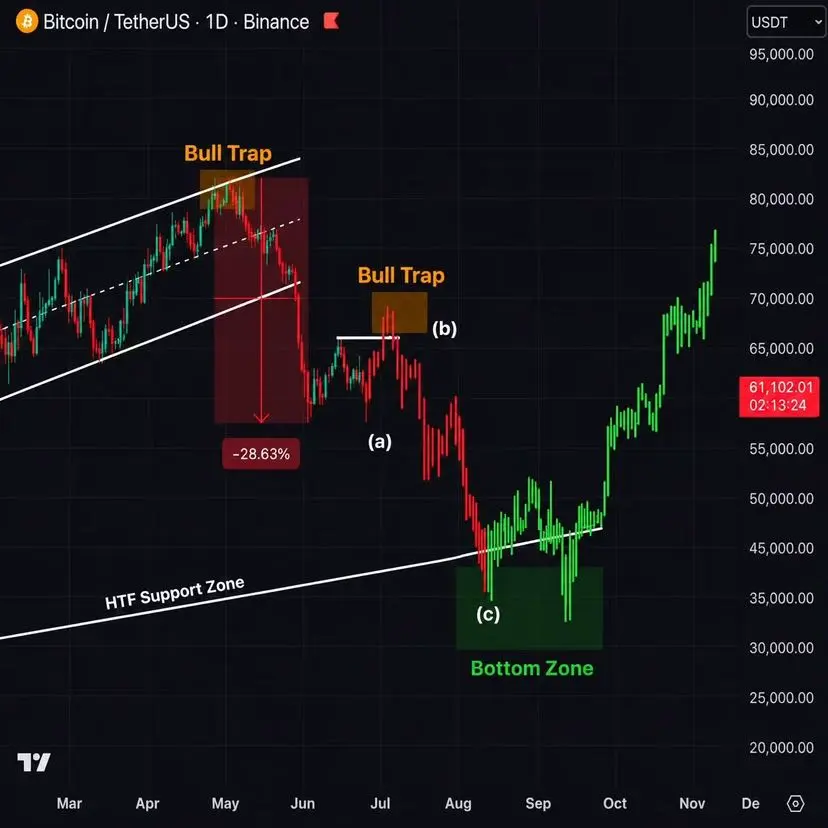
The first rally peaked near $82k before reversing sharply.
Now Bitcoin has returned to the $66K–$67K area, marked here as Trap Zone 2.
Instead of a breakout, the chart suggests this could be another liquidation trap before a deeper move lower.
This is what the setup indicates:
◉ Trap Zone 1: Rejection near $82K.
◉ Trap Zone 2: Recovery toward $67K, followed by renewed selling pressure.
◉ Current Price: Approximately $59k.
◉ Expected Support: The chart points